Elastic Security UI
editElastic Security UI
editThe Elastic Security app is a highly interactive workspace designed for security analysts that provides a clear overview of events and alerts from your environment. You can use the interactive UI to drill down into areas of interest.
Search
editFilter for alerts, events, processes, and other important security data with the benefit of Kibana Query Language (KQL) in the Search bar, which appears at the top of each page throughout the app. A date/time filter set to Last 24 hours is enabled by default, but can be changed to any time range. If you want to filter your search results with other fields, select Add Filter, followed by the field from which to filter and the operator (such is not or is between) for your query.
To save specific filters and queries, click the Save button, then Save current query.

Page navigation
editThe Elastic Security app contains the following pages that enable analysts to view, analyze, and manage security data:
- Getting started
- Overview
- Alerts
- Rules
- Exception lists
- Hosts
- Network
- Users
- Timelines
- Cases
- Endpoints
- Policies
- Trusted applications
- Event filters
- Host isolation exceptions
- Blocklist
Pages are grouped into four main sections within the navigation pane:
- Detect: View, create, and manage alerts, rules, and rule exceptions.
- Explore: Access key metrics about your hosts, network, and users.
- Investigate: Access and manage Timelines and cases.
- Manage: View and manage hosts that are running Endpoint Security.
Click the Collapse side navigation button to collapse and expand the main navigation menu.
Getting started page
editThe Getting started page guides you to integrations that you can use to monitor your hosts and ingest data. Other Elastic Security app pages that show event data (for example, the Hosts and Network pages) display the getting started prompt until event data has been ingested.
Overview page
editThe Overview page provides a high-level snapshot view of detections, external alerts, and event trends. These trends are useful to assess overall system health and find anomalies that may require further investigation.
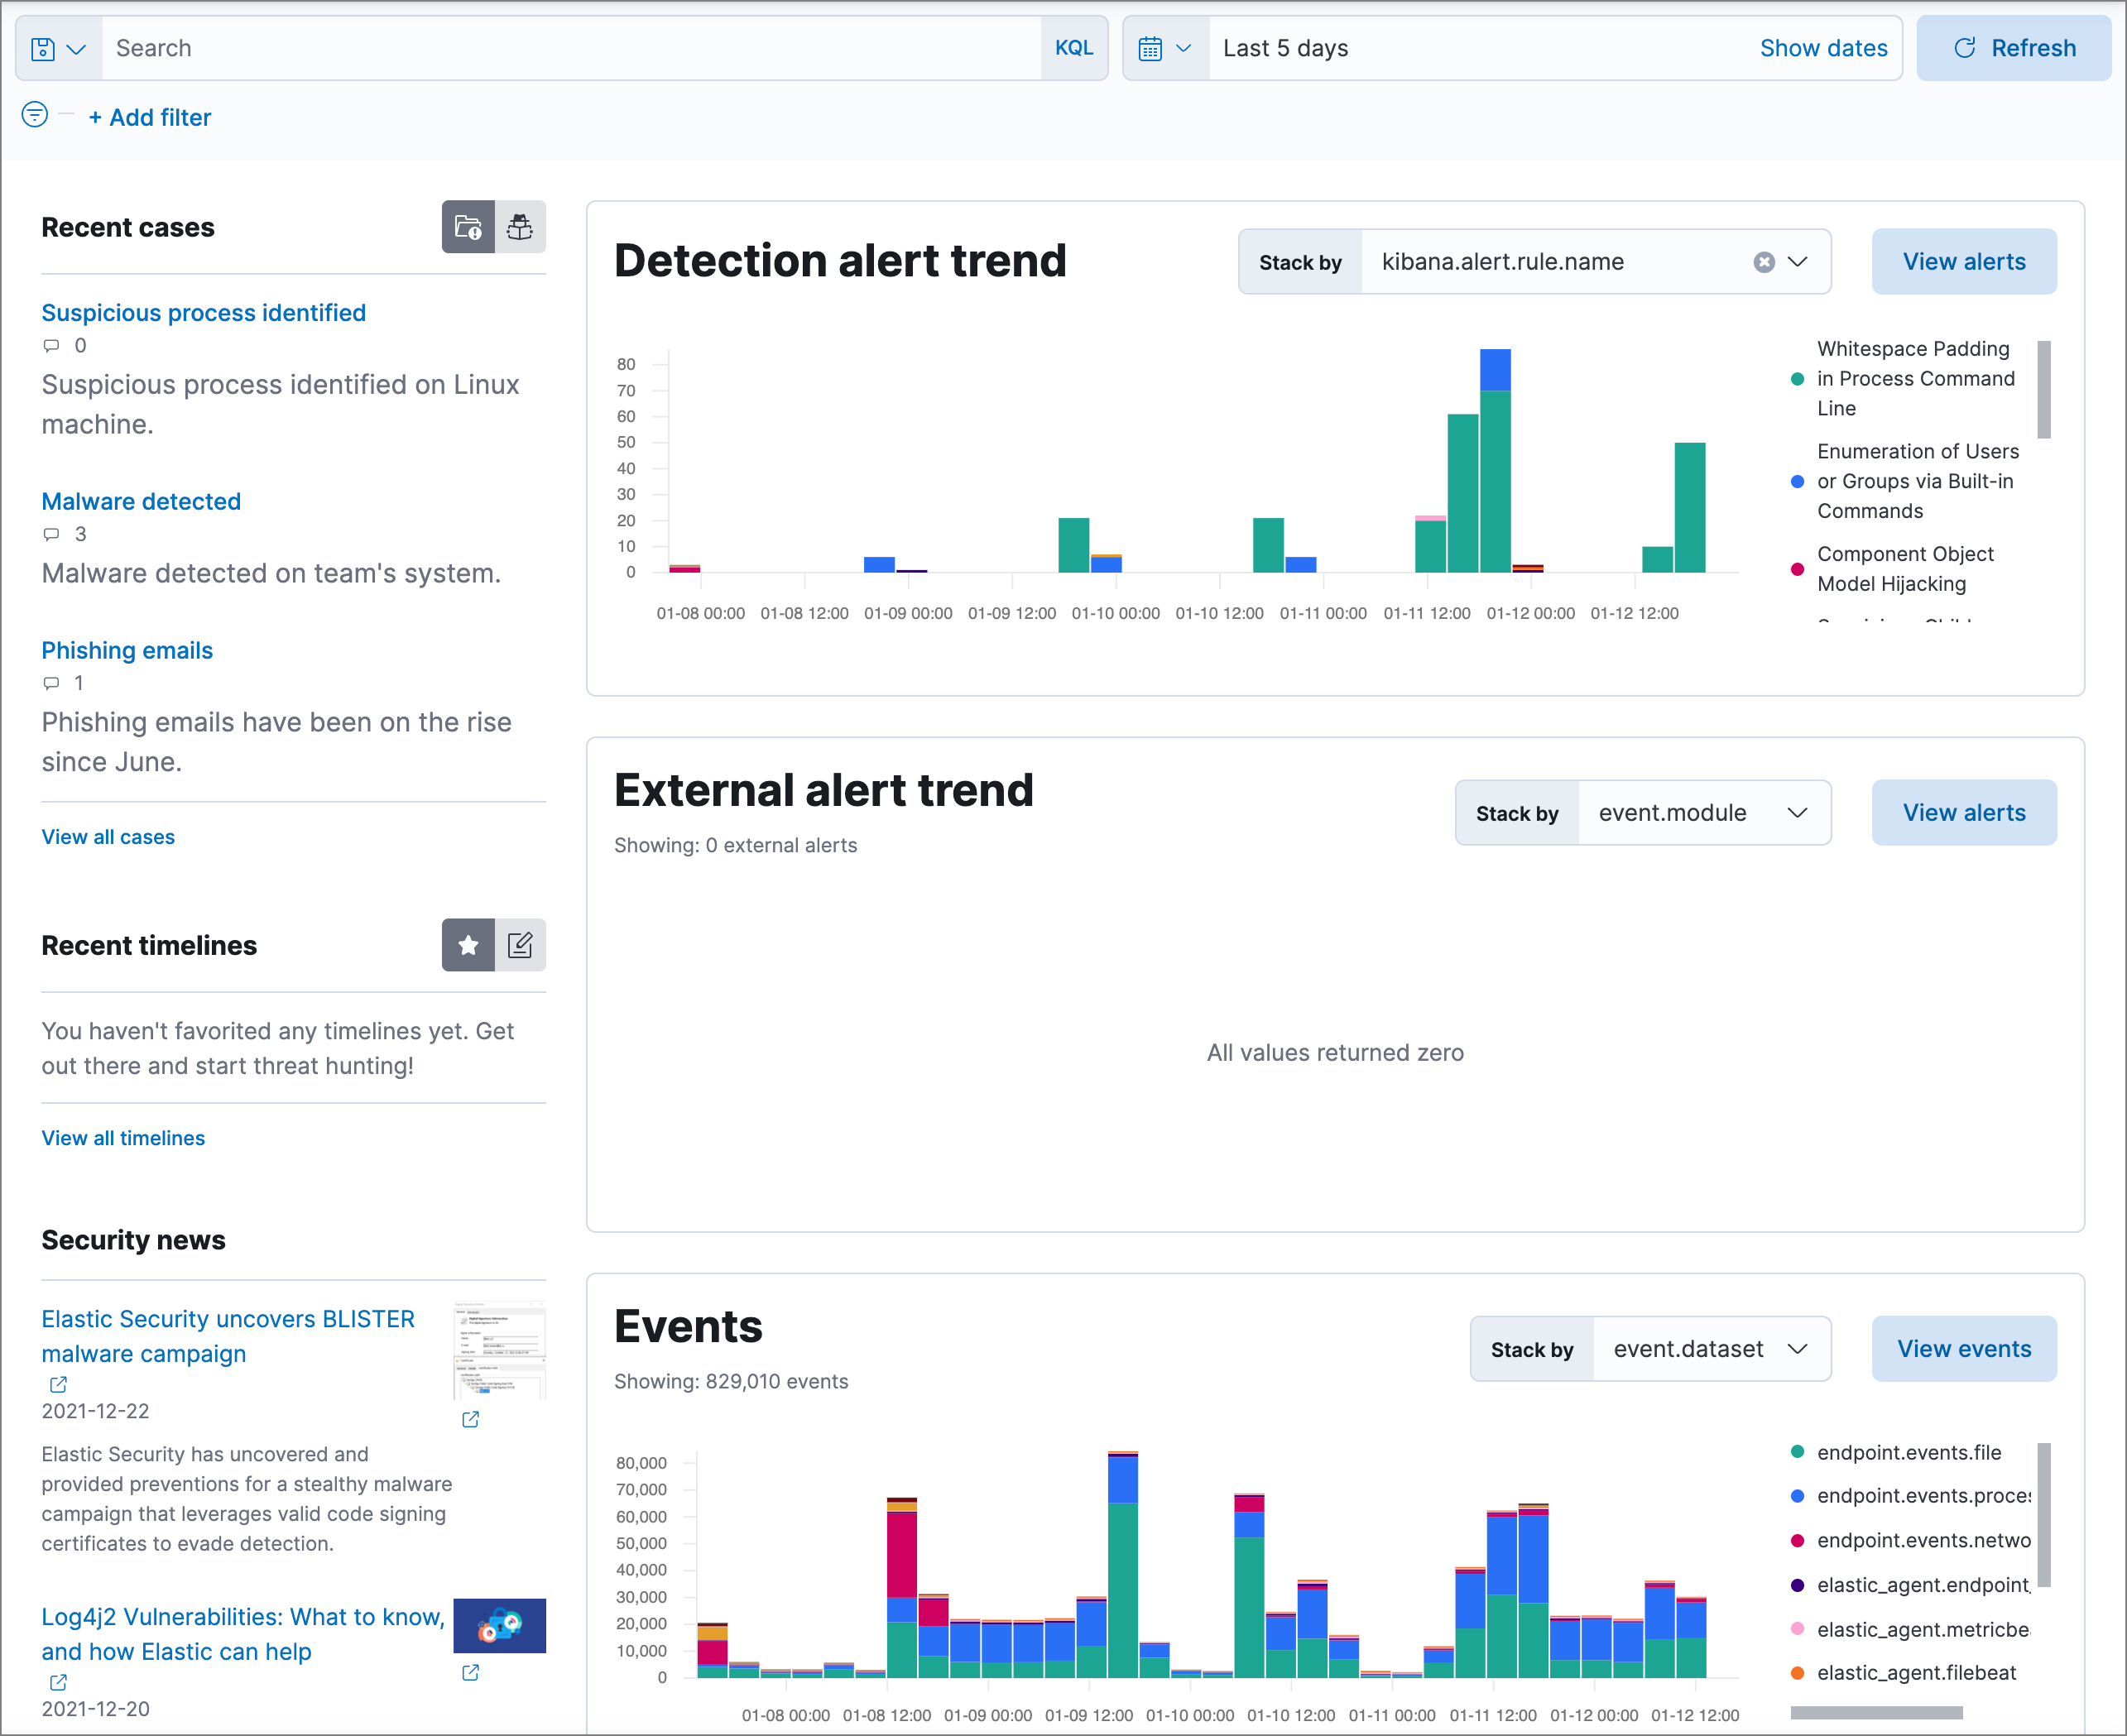
From the live feed on the Overview page, you can quickly access recently created cases, favorited timelines, and the latest Elastic Security news.
The Security news section provides you with the latest Elastic Security news to stay informed on new developments, learn about Elastic Security features, and more.
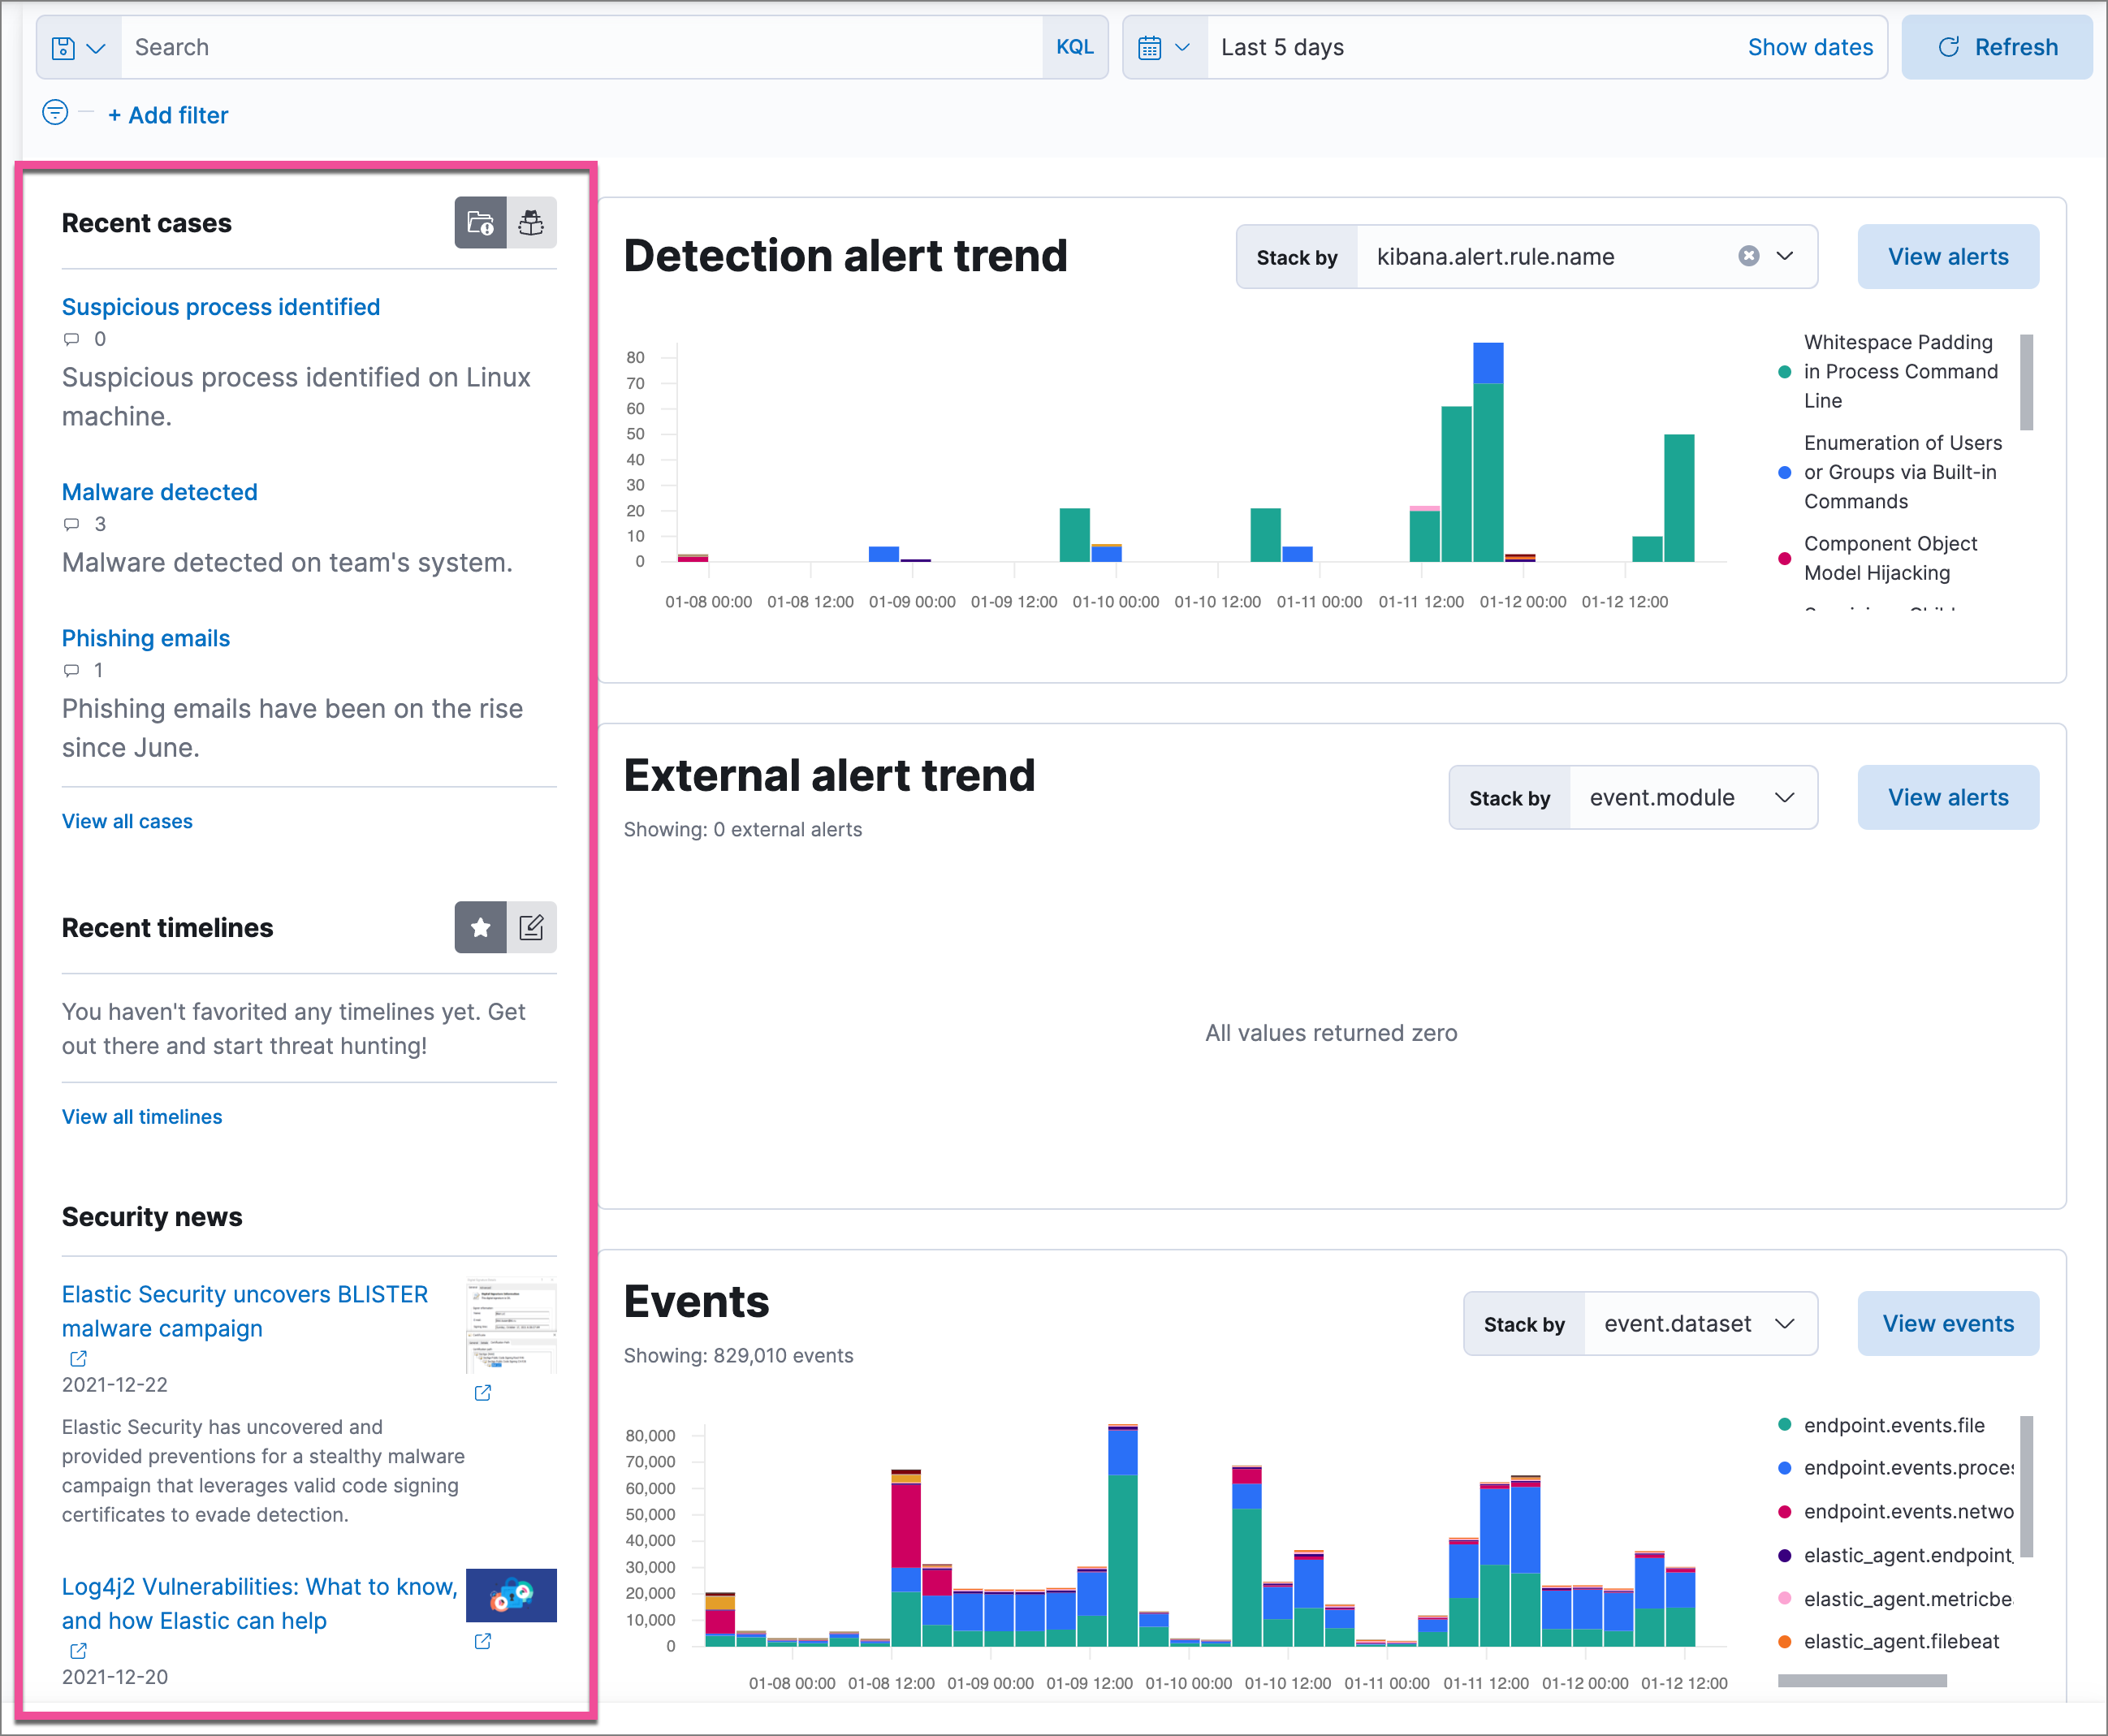
Histograms
Time-based histograms show you the number of detections, alerts, and events that have occurred within the selected time range. To focus on areas of interest in time-based histograms, select a region to reflect a date range, or select a preset value in the timepicker. In the Stack by dropdown, you can select specific parameters to visualize individual counts. For example, in the Detection alert trend histogram, stack by kibana.alert.rule.name to display the total counts by alert name within the specified time frame.
All Elastic Security histograms, graphs, and tables contain an Inspect button so you can examine the Elasticsearch queries used to retrieve data throughout the app.
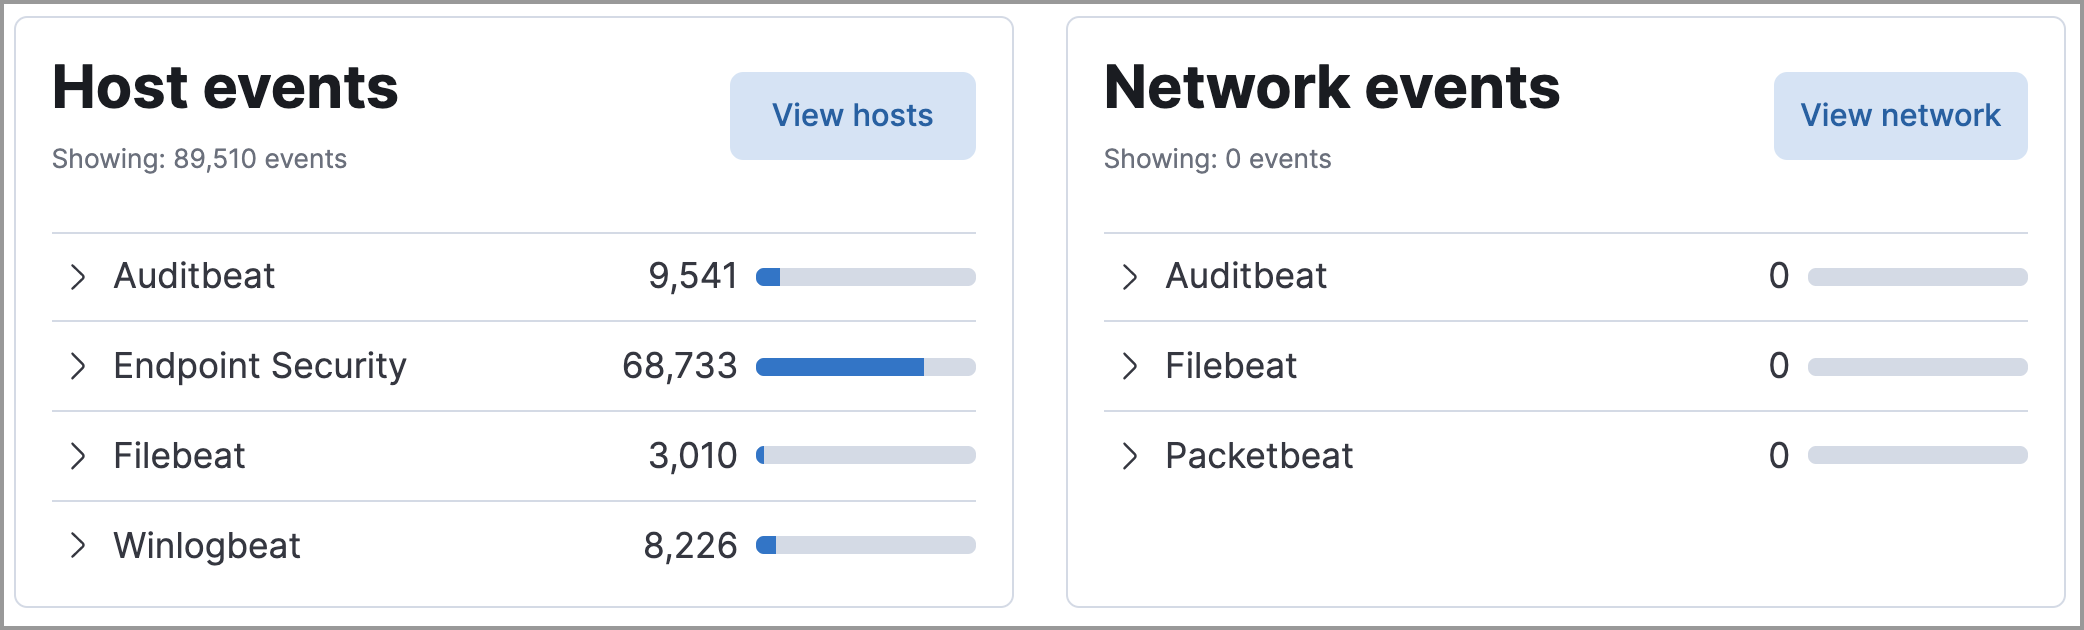
Host and network events
View event and host counts specific to Elastic data shippers and apps, such as Auditbeats or Elastic Endpoint Security. Expand each category to view specific counts of hosts or network events related to the selected category.
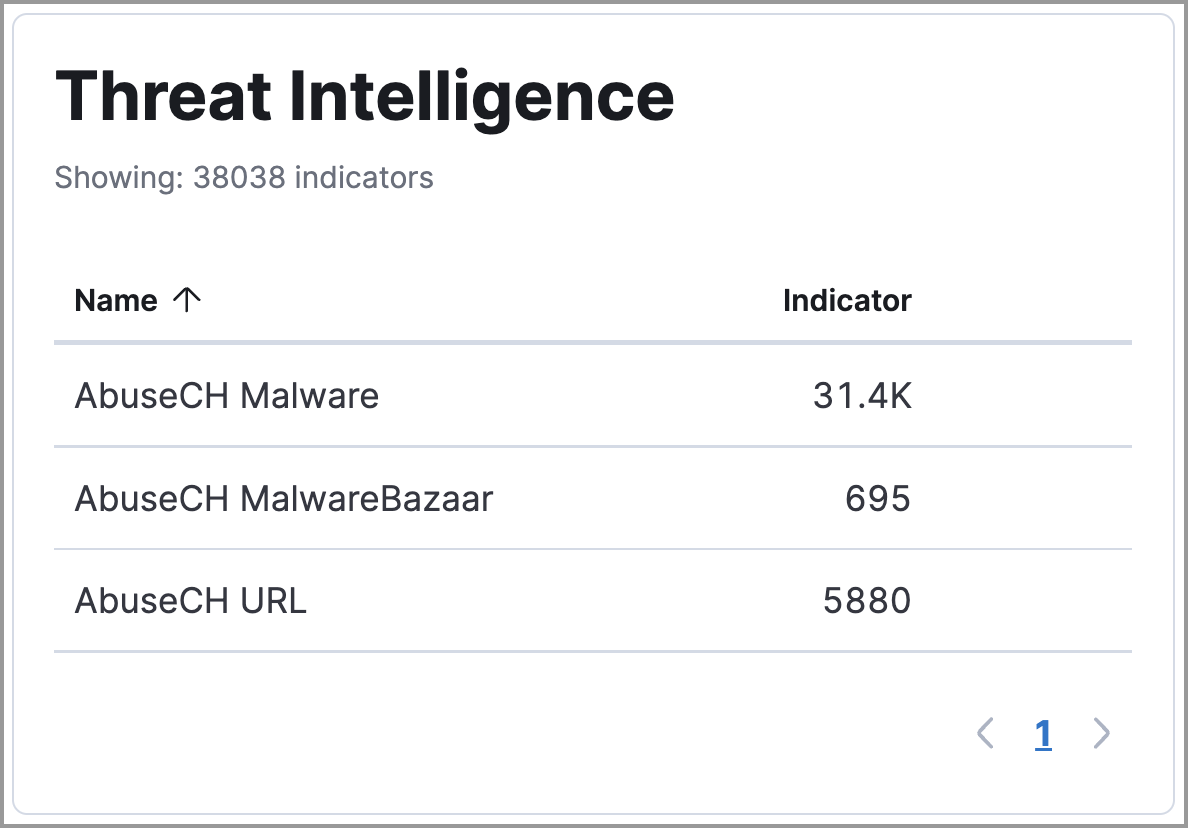
Threat Intelligence
The Threat Intelligence view on the Overview page provides a streamlined way to collect threat intelligence data for threat detection and matching.
The view shows the total number of ingested threat indicators, enabled threat intelligence sources, and ingested threat indicators per source. To visualize the ingested threat indicator data, click the Source link for a threat intelligence source.
For more information about connecting to threat intelligence sources, visit Enable threat intelligence integrations.
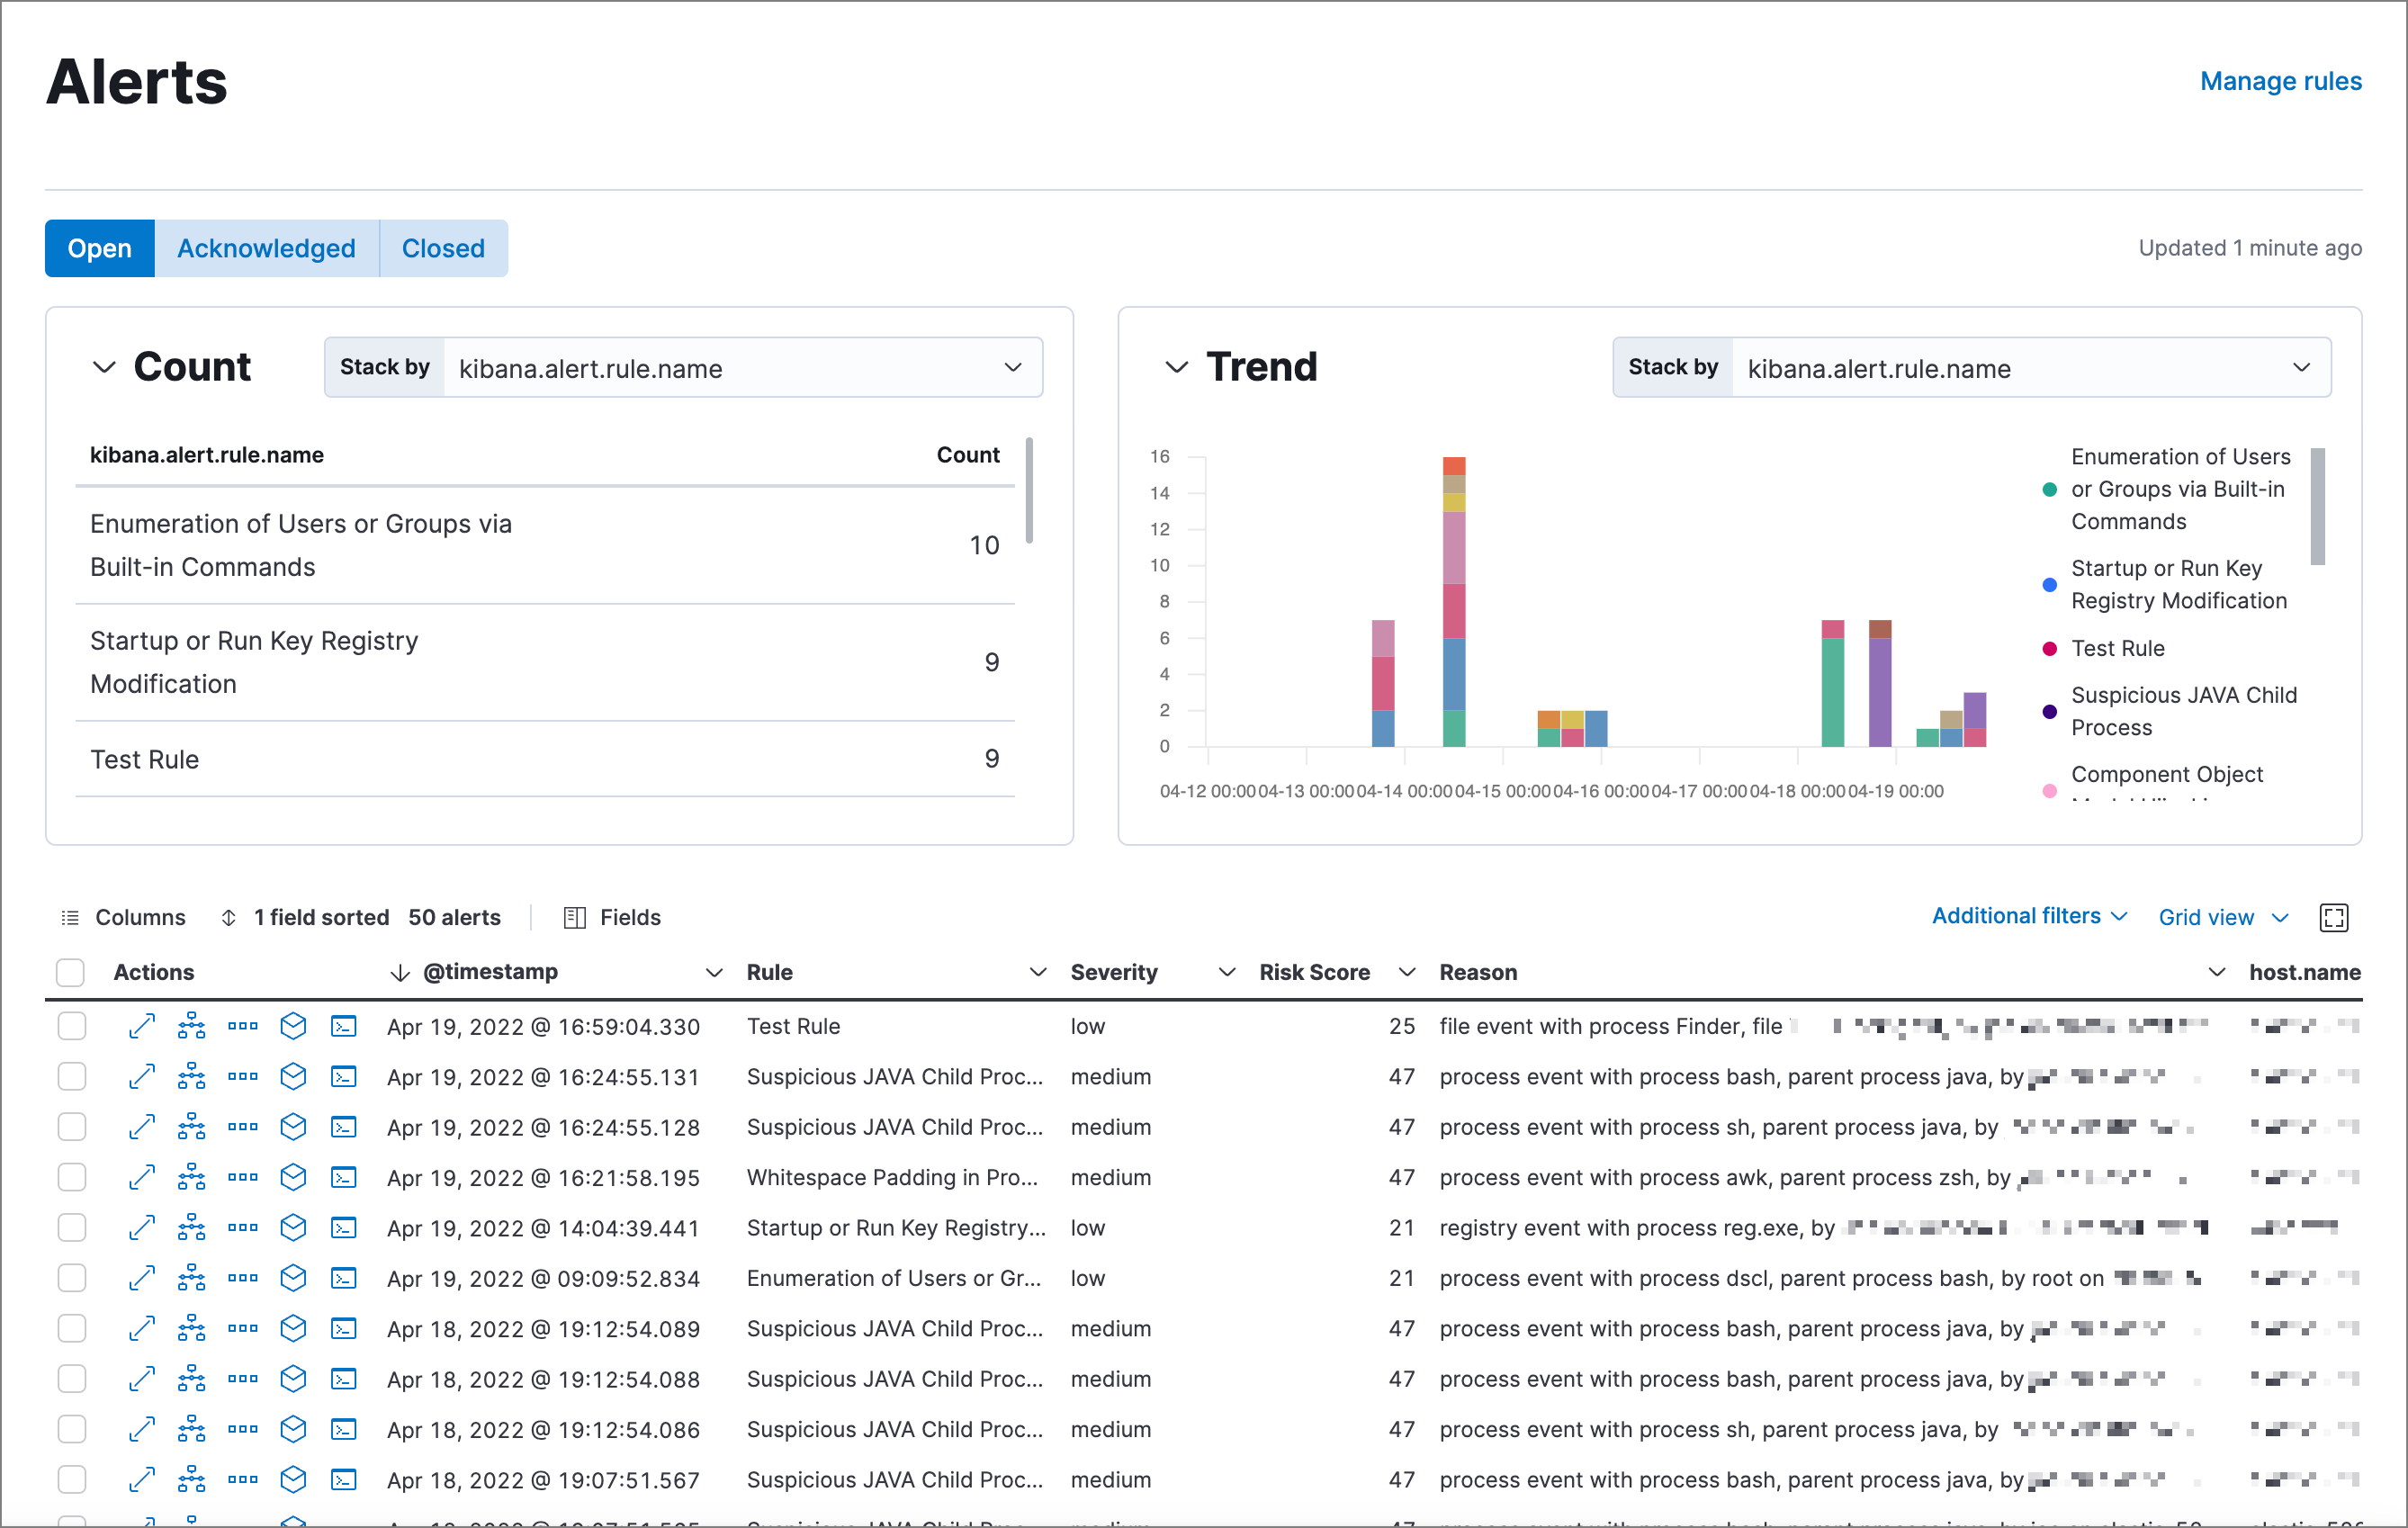
Alerts page
editThe Alerts page allows you to view and manage all alerts to monitor activity within your network. Refer to Detections and Alerts for more information.
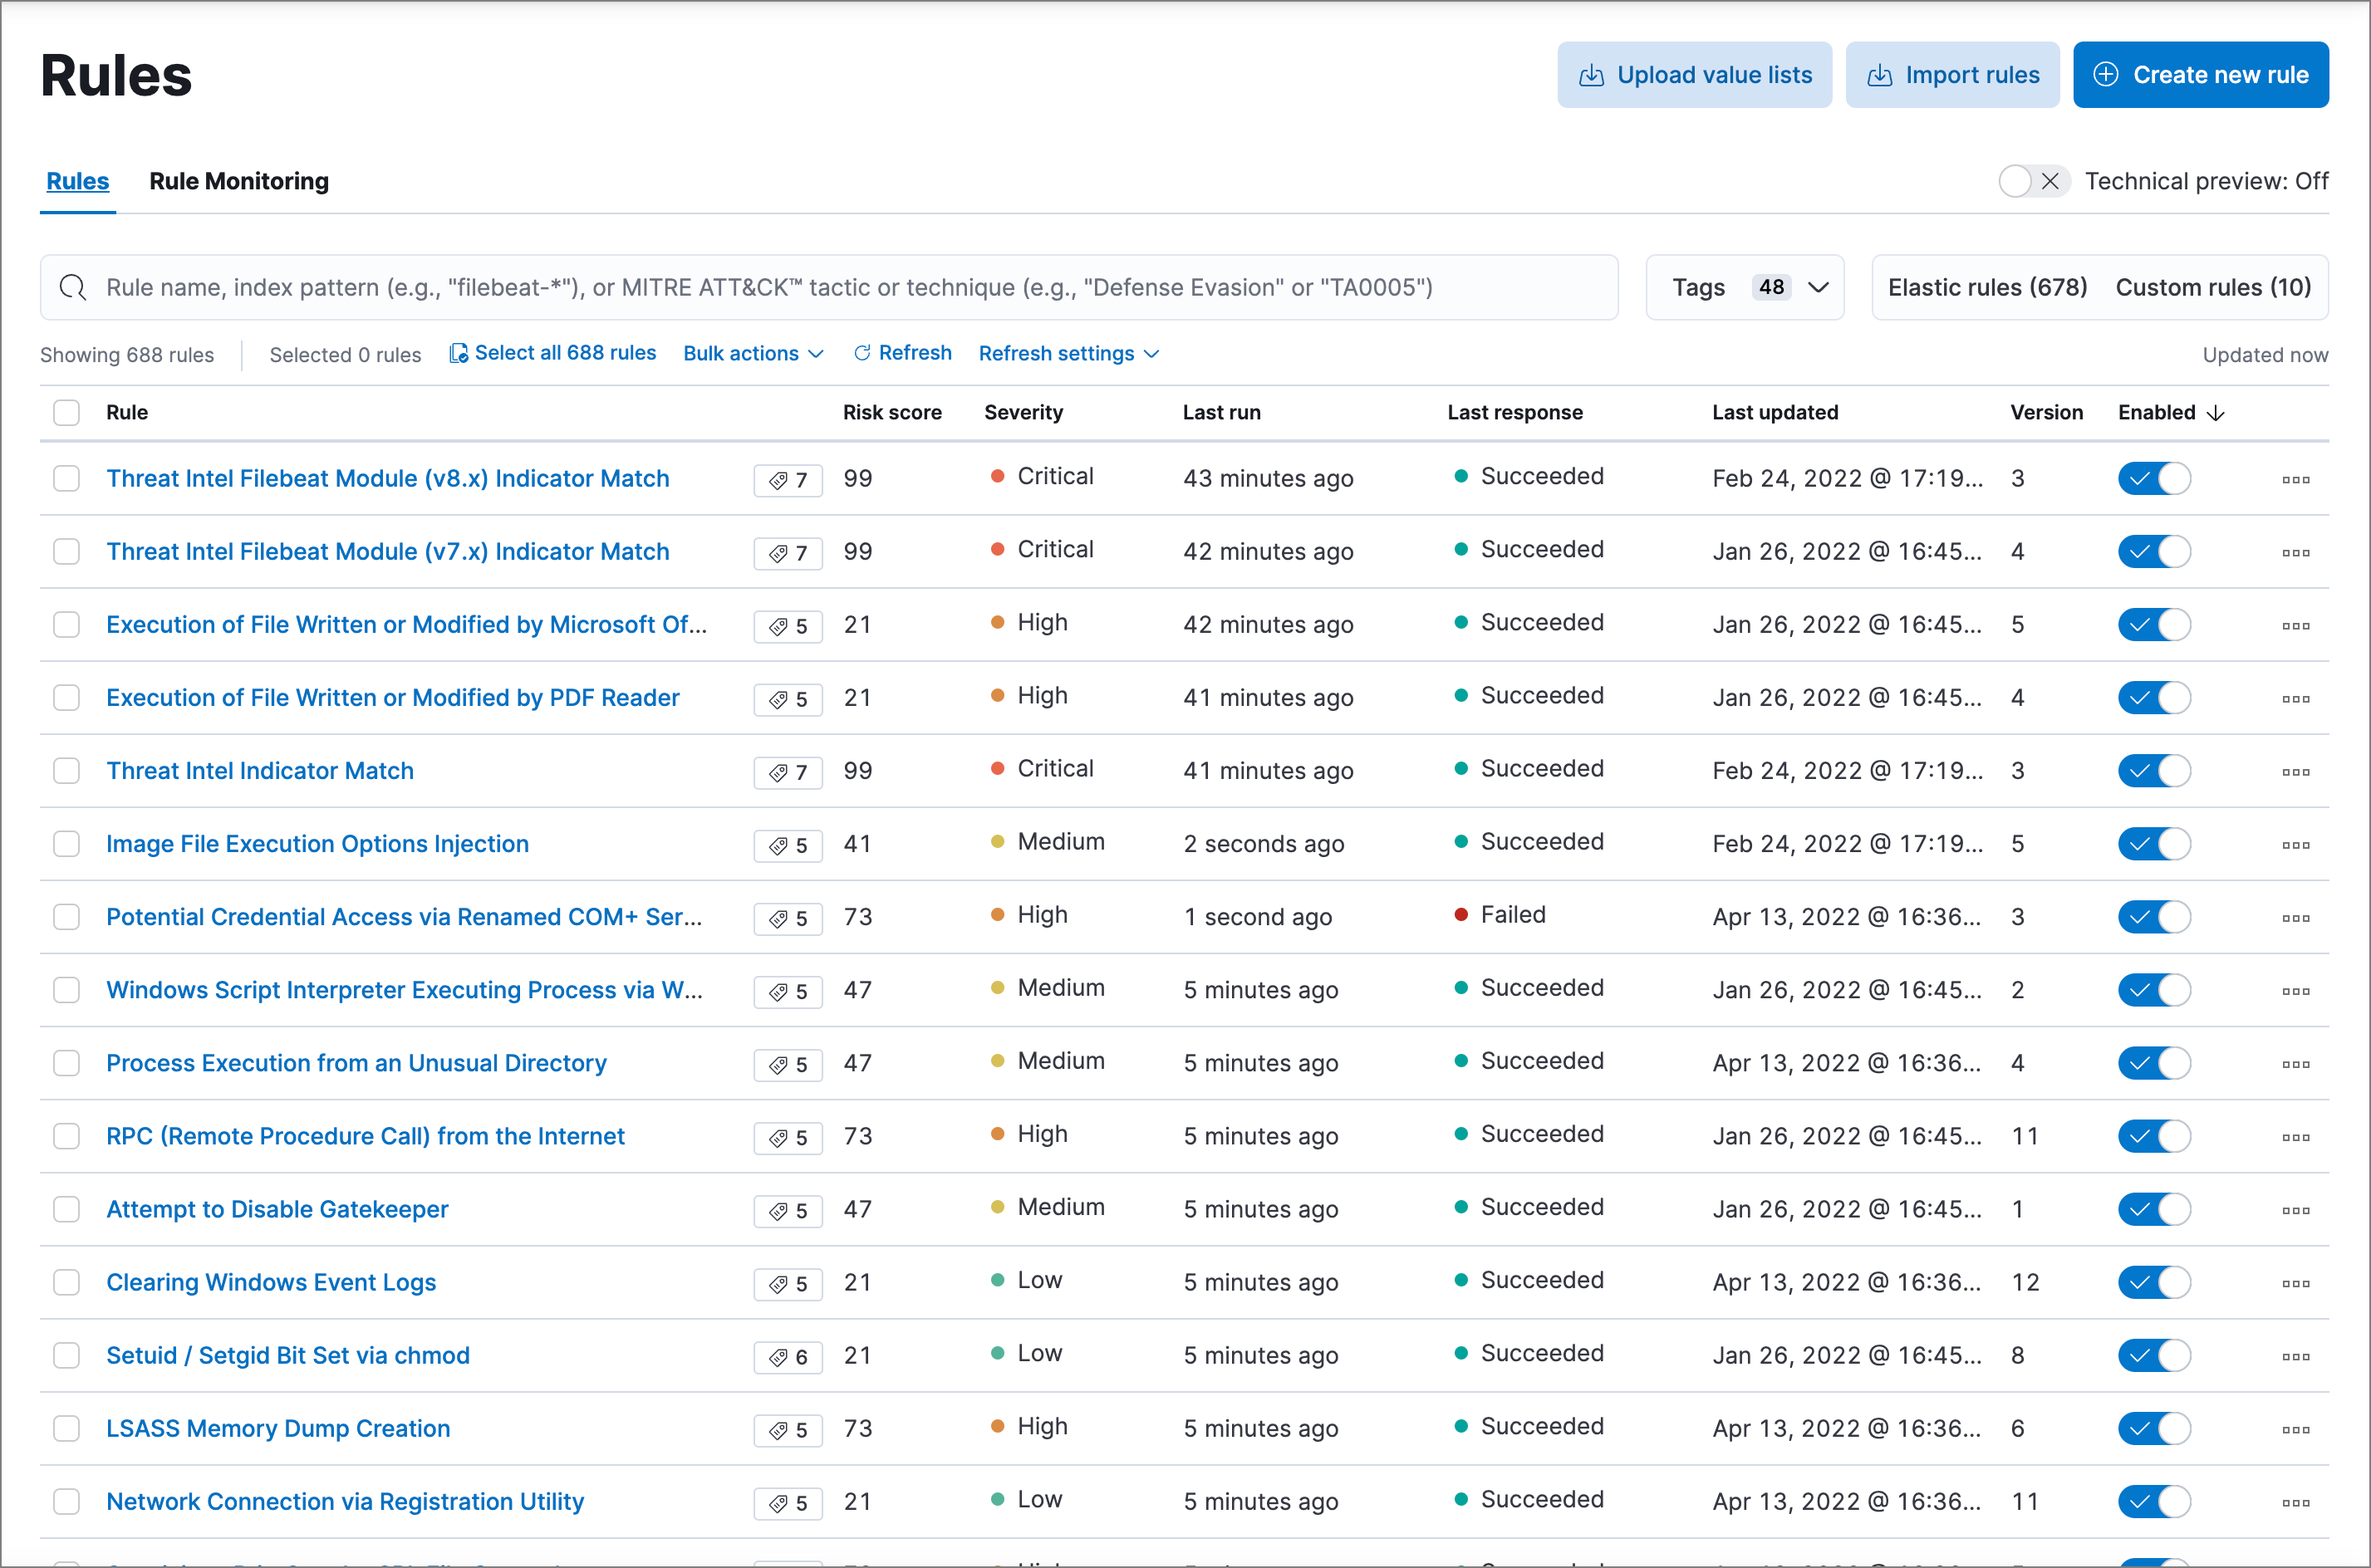
Rules page
editThe Rules page allows you to view and manage all detection rules. Refer to Manage detection rules for more information about prebuilt and custom rules.
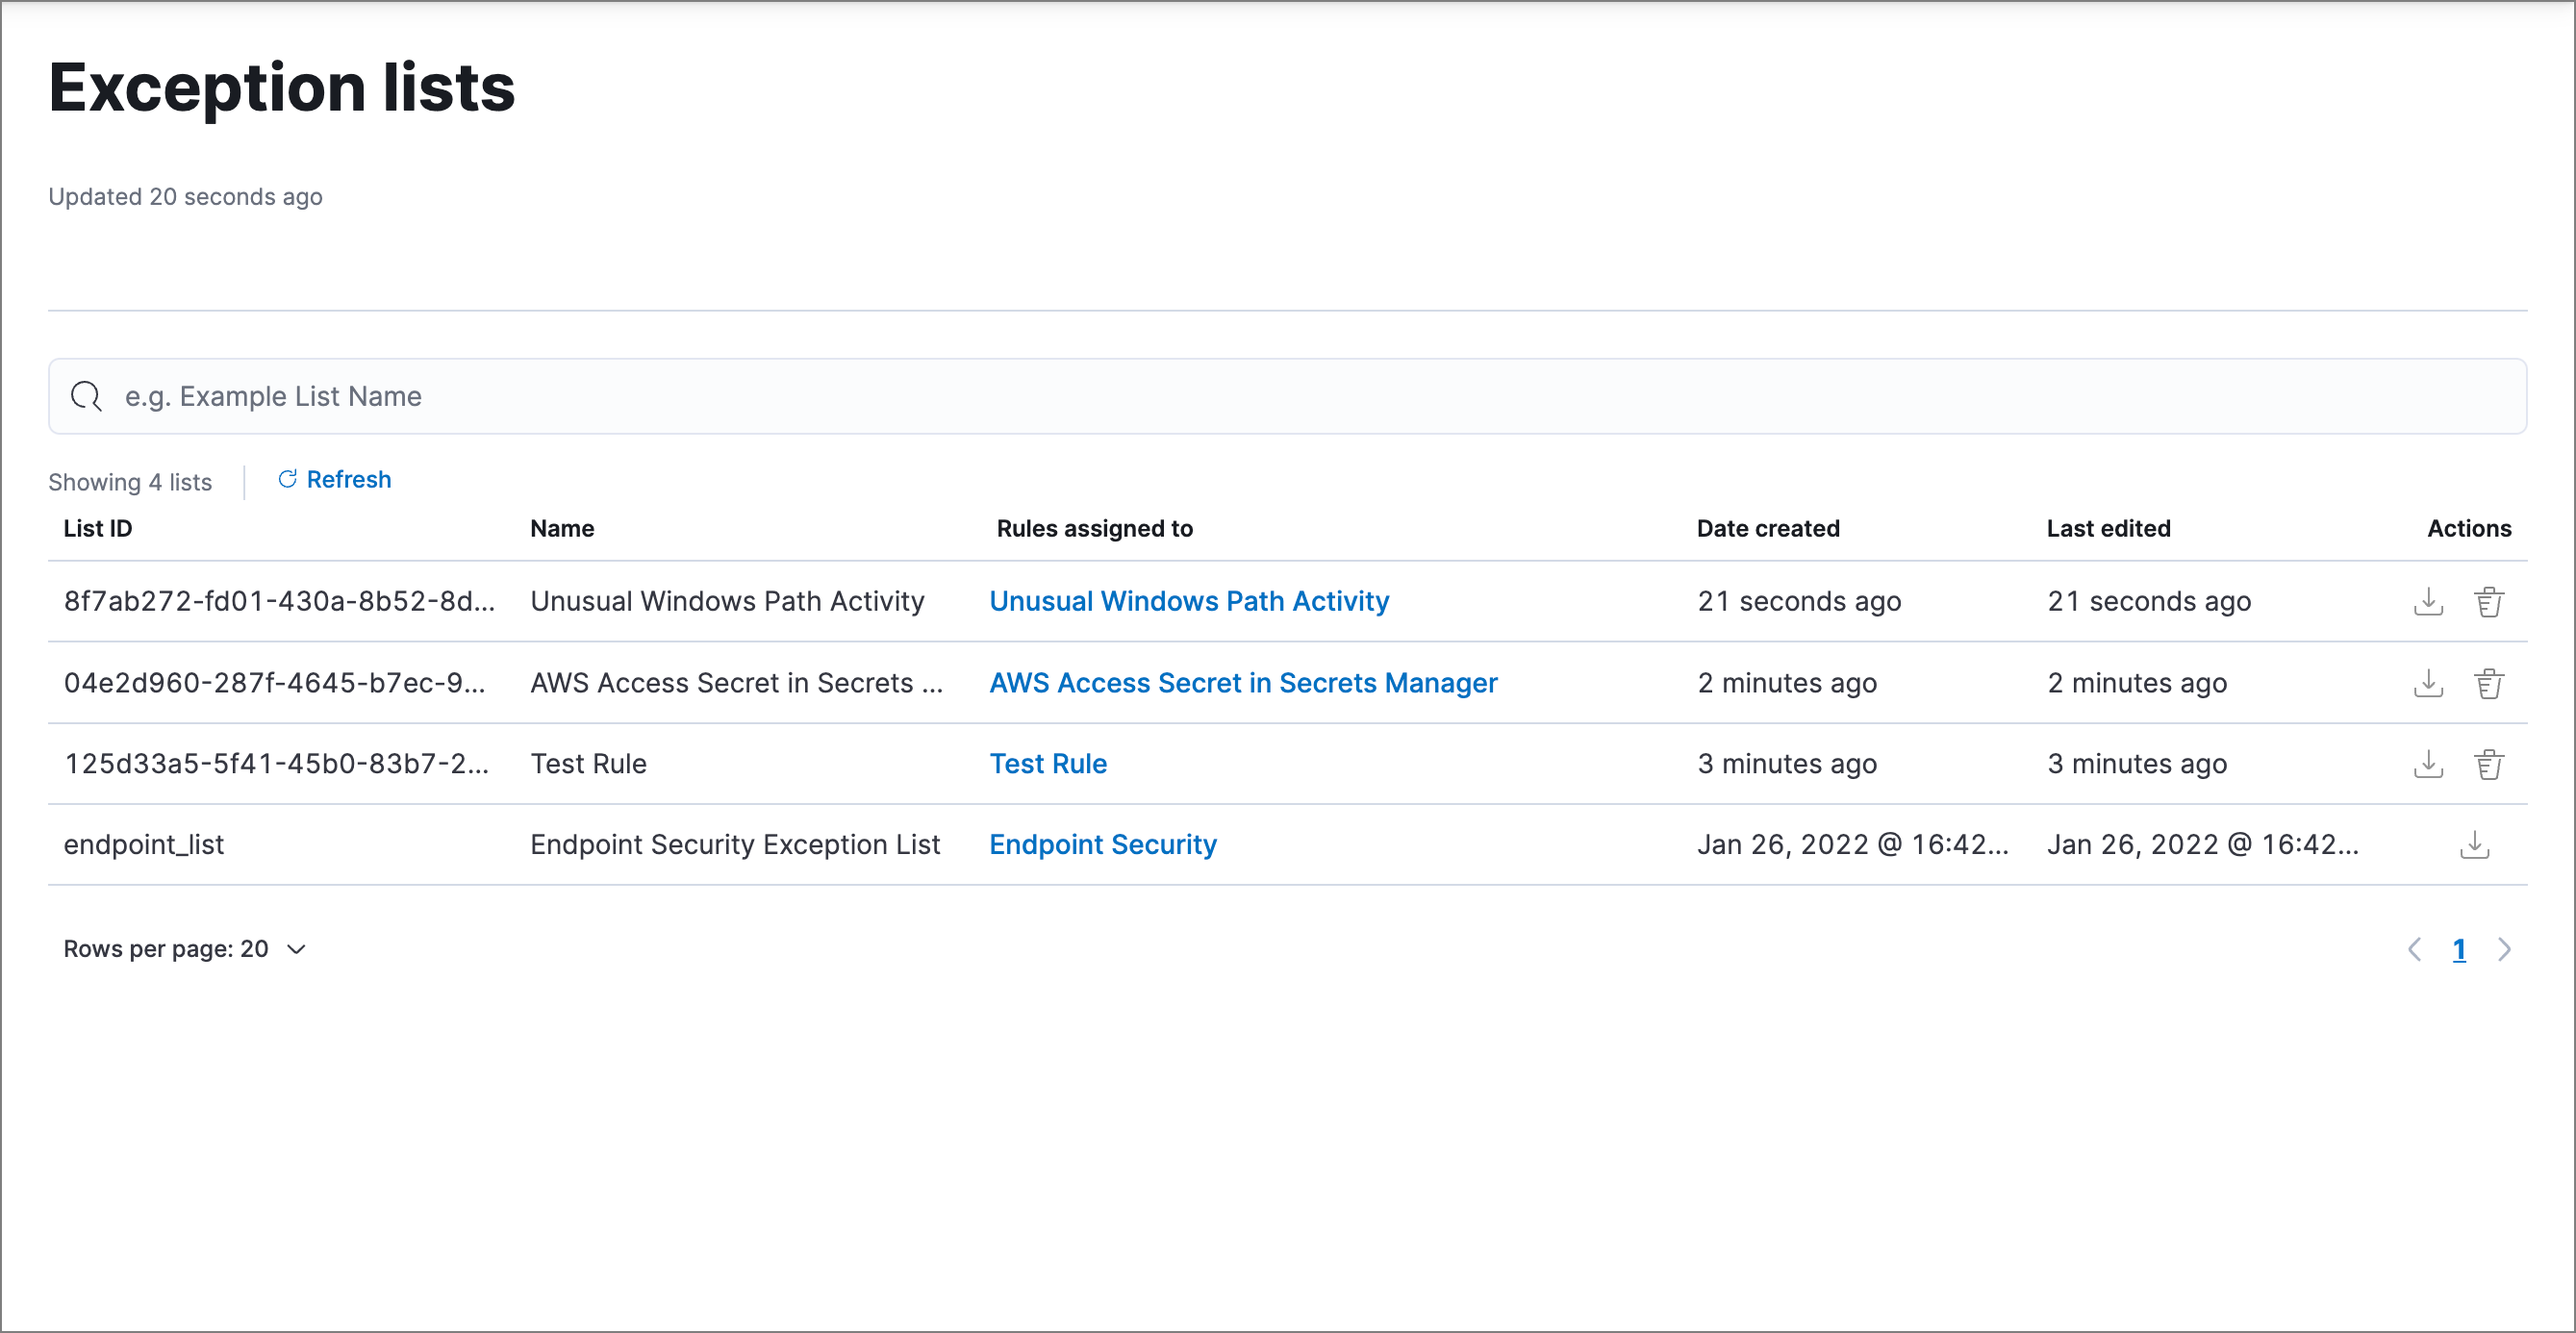
Exception lists page
editThe Exception lists page allows you to view and manage all rule exceptions. Refer to Rule exceptions and value lists for more information about rule exceptions.
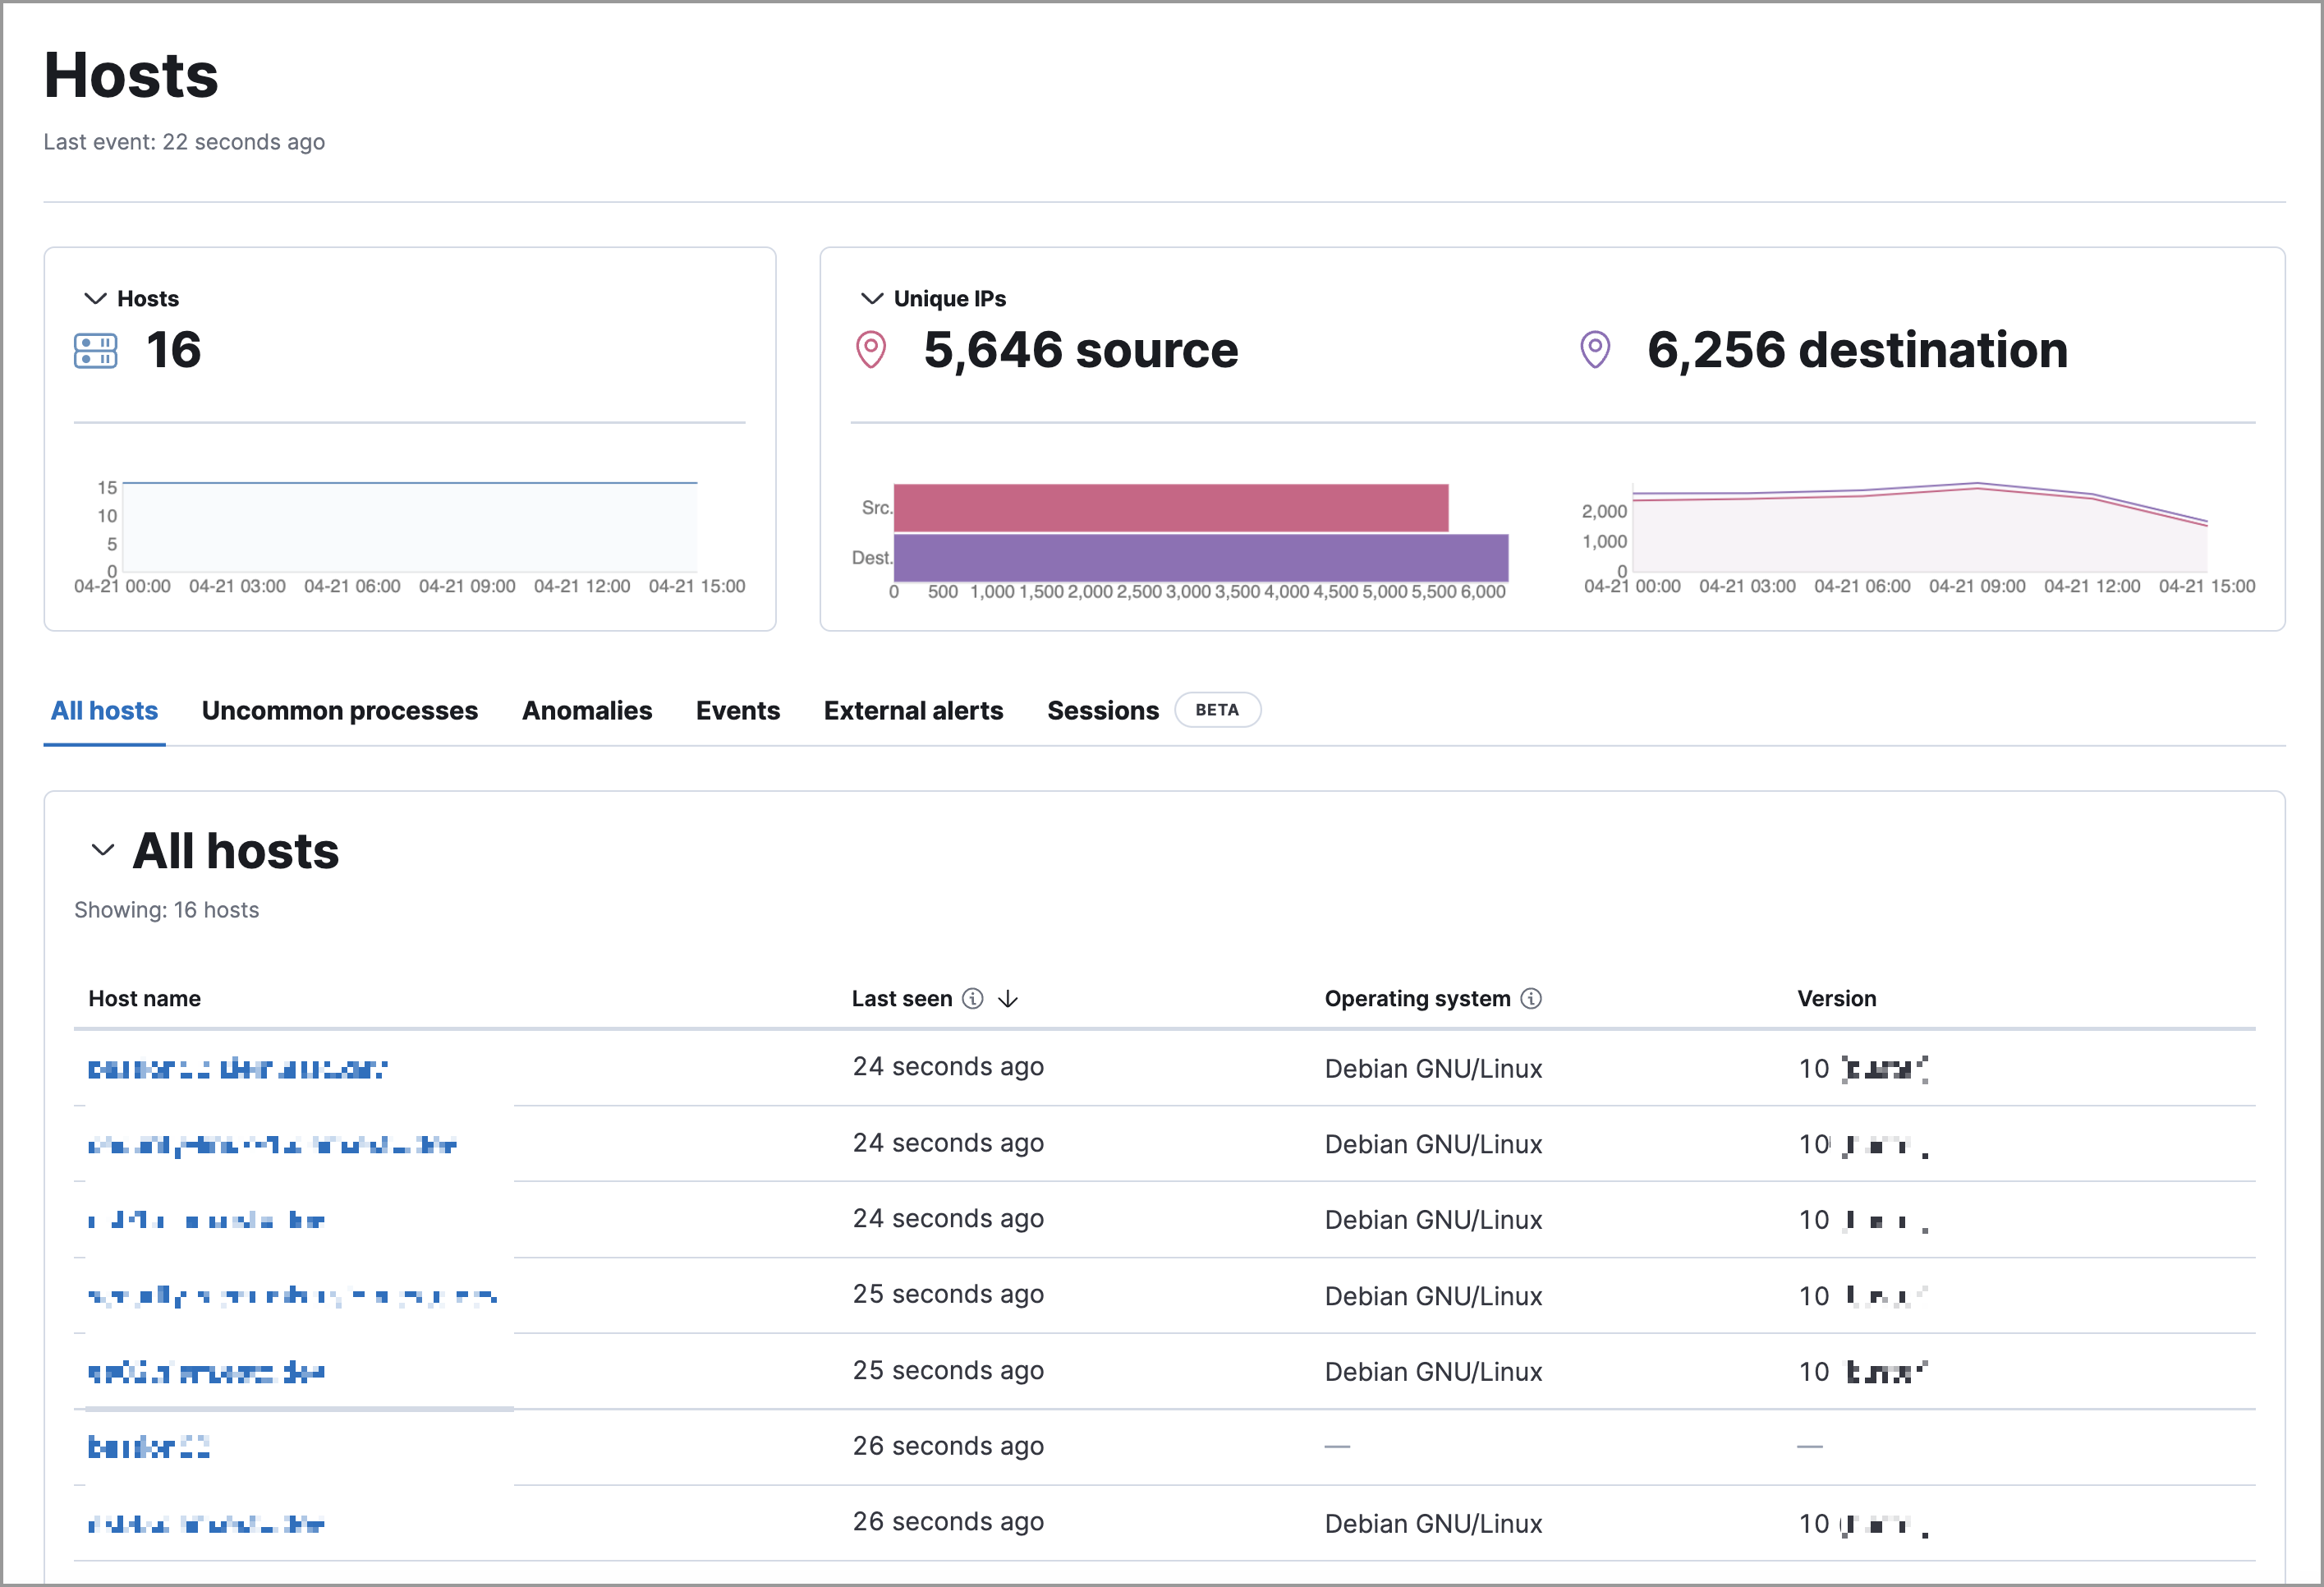
Hosts page
editThe Hosts page provides key metrics for host-related security events and a set of interactive data tables. Refer to Hosts page for more information.
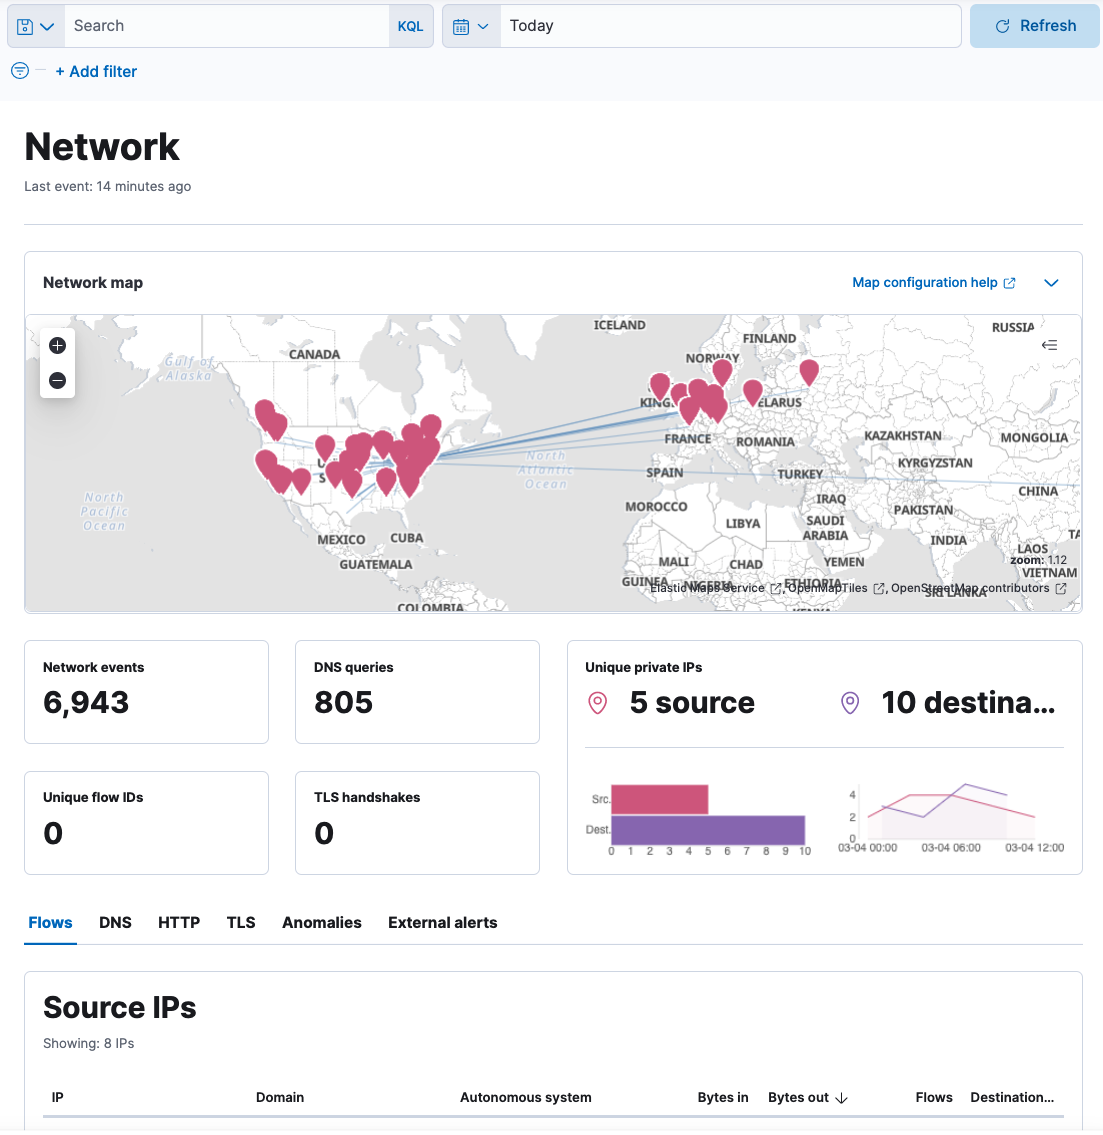
Network page
editThe Network page provides key network activity metrics via an interactive map and network event tables that enable interaction with Timeline. Refer to Network page overview for more information.
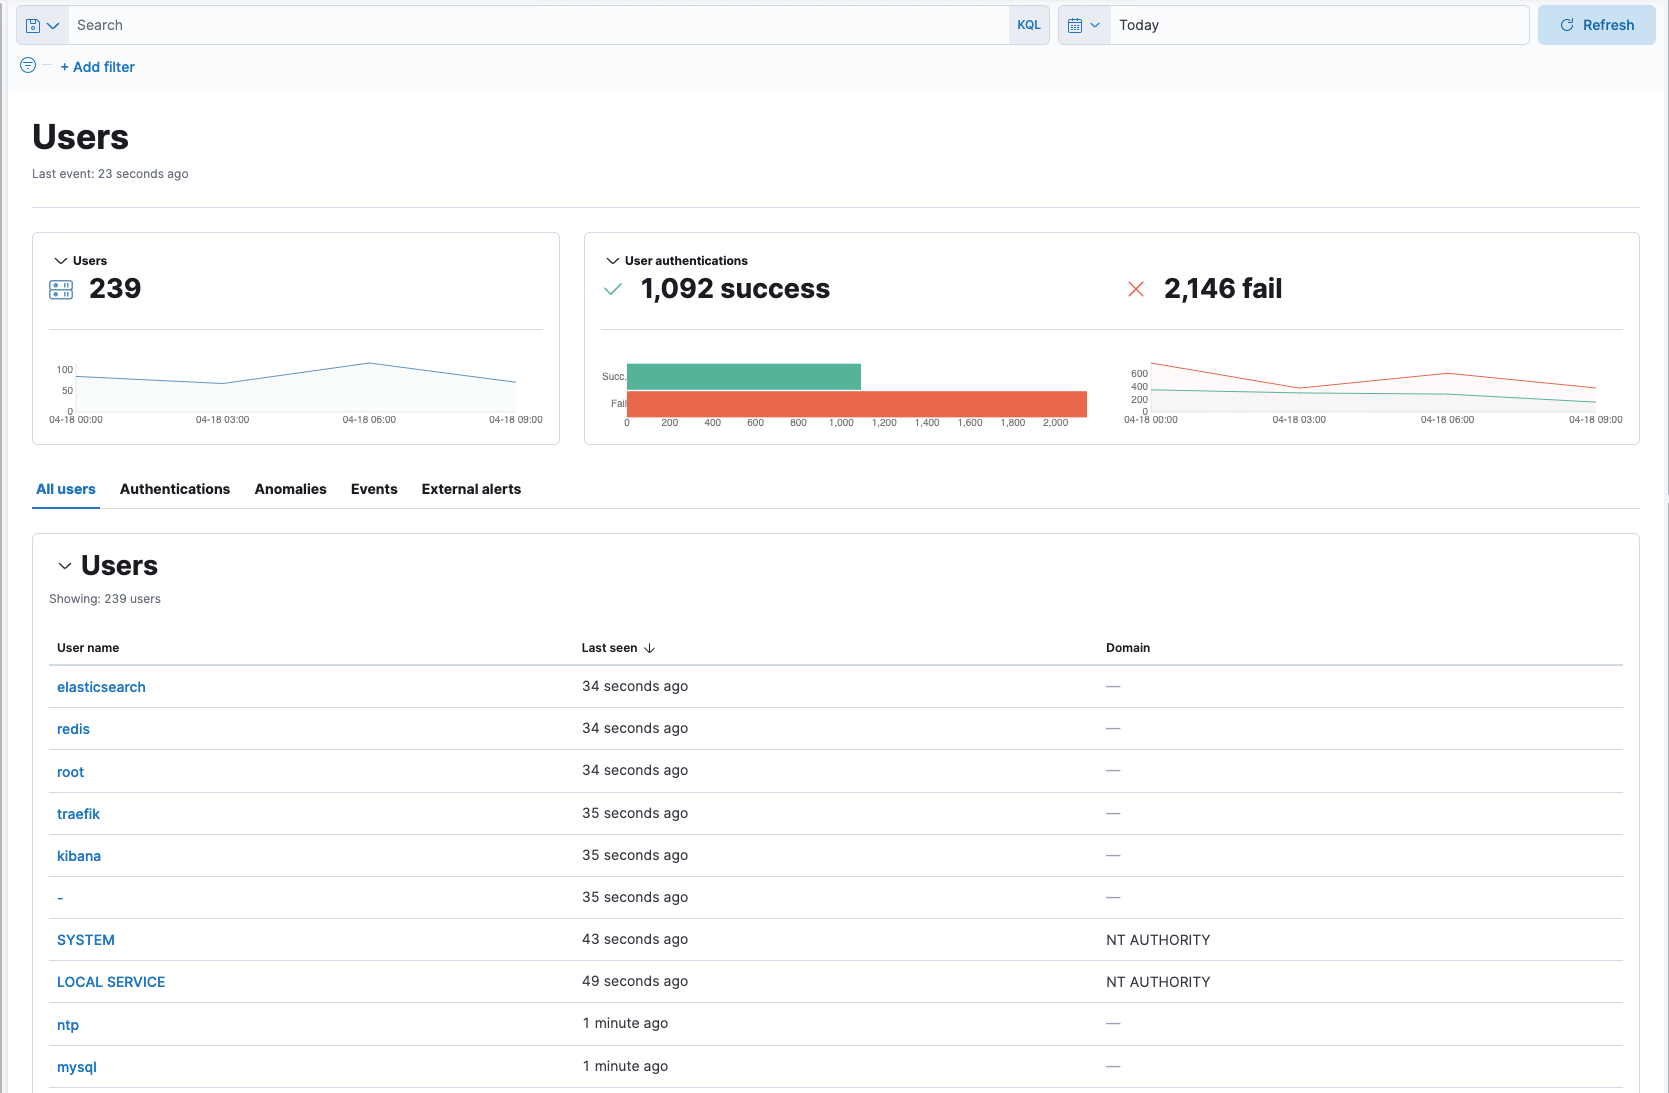
Users page
editThe Users page provides a comprehensive overview of user data to help you understand authentication and user behavior within your environment. Refer to Users page for more information.
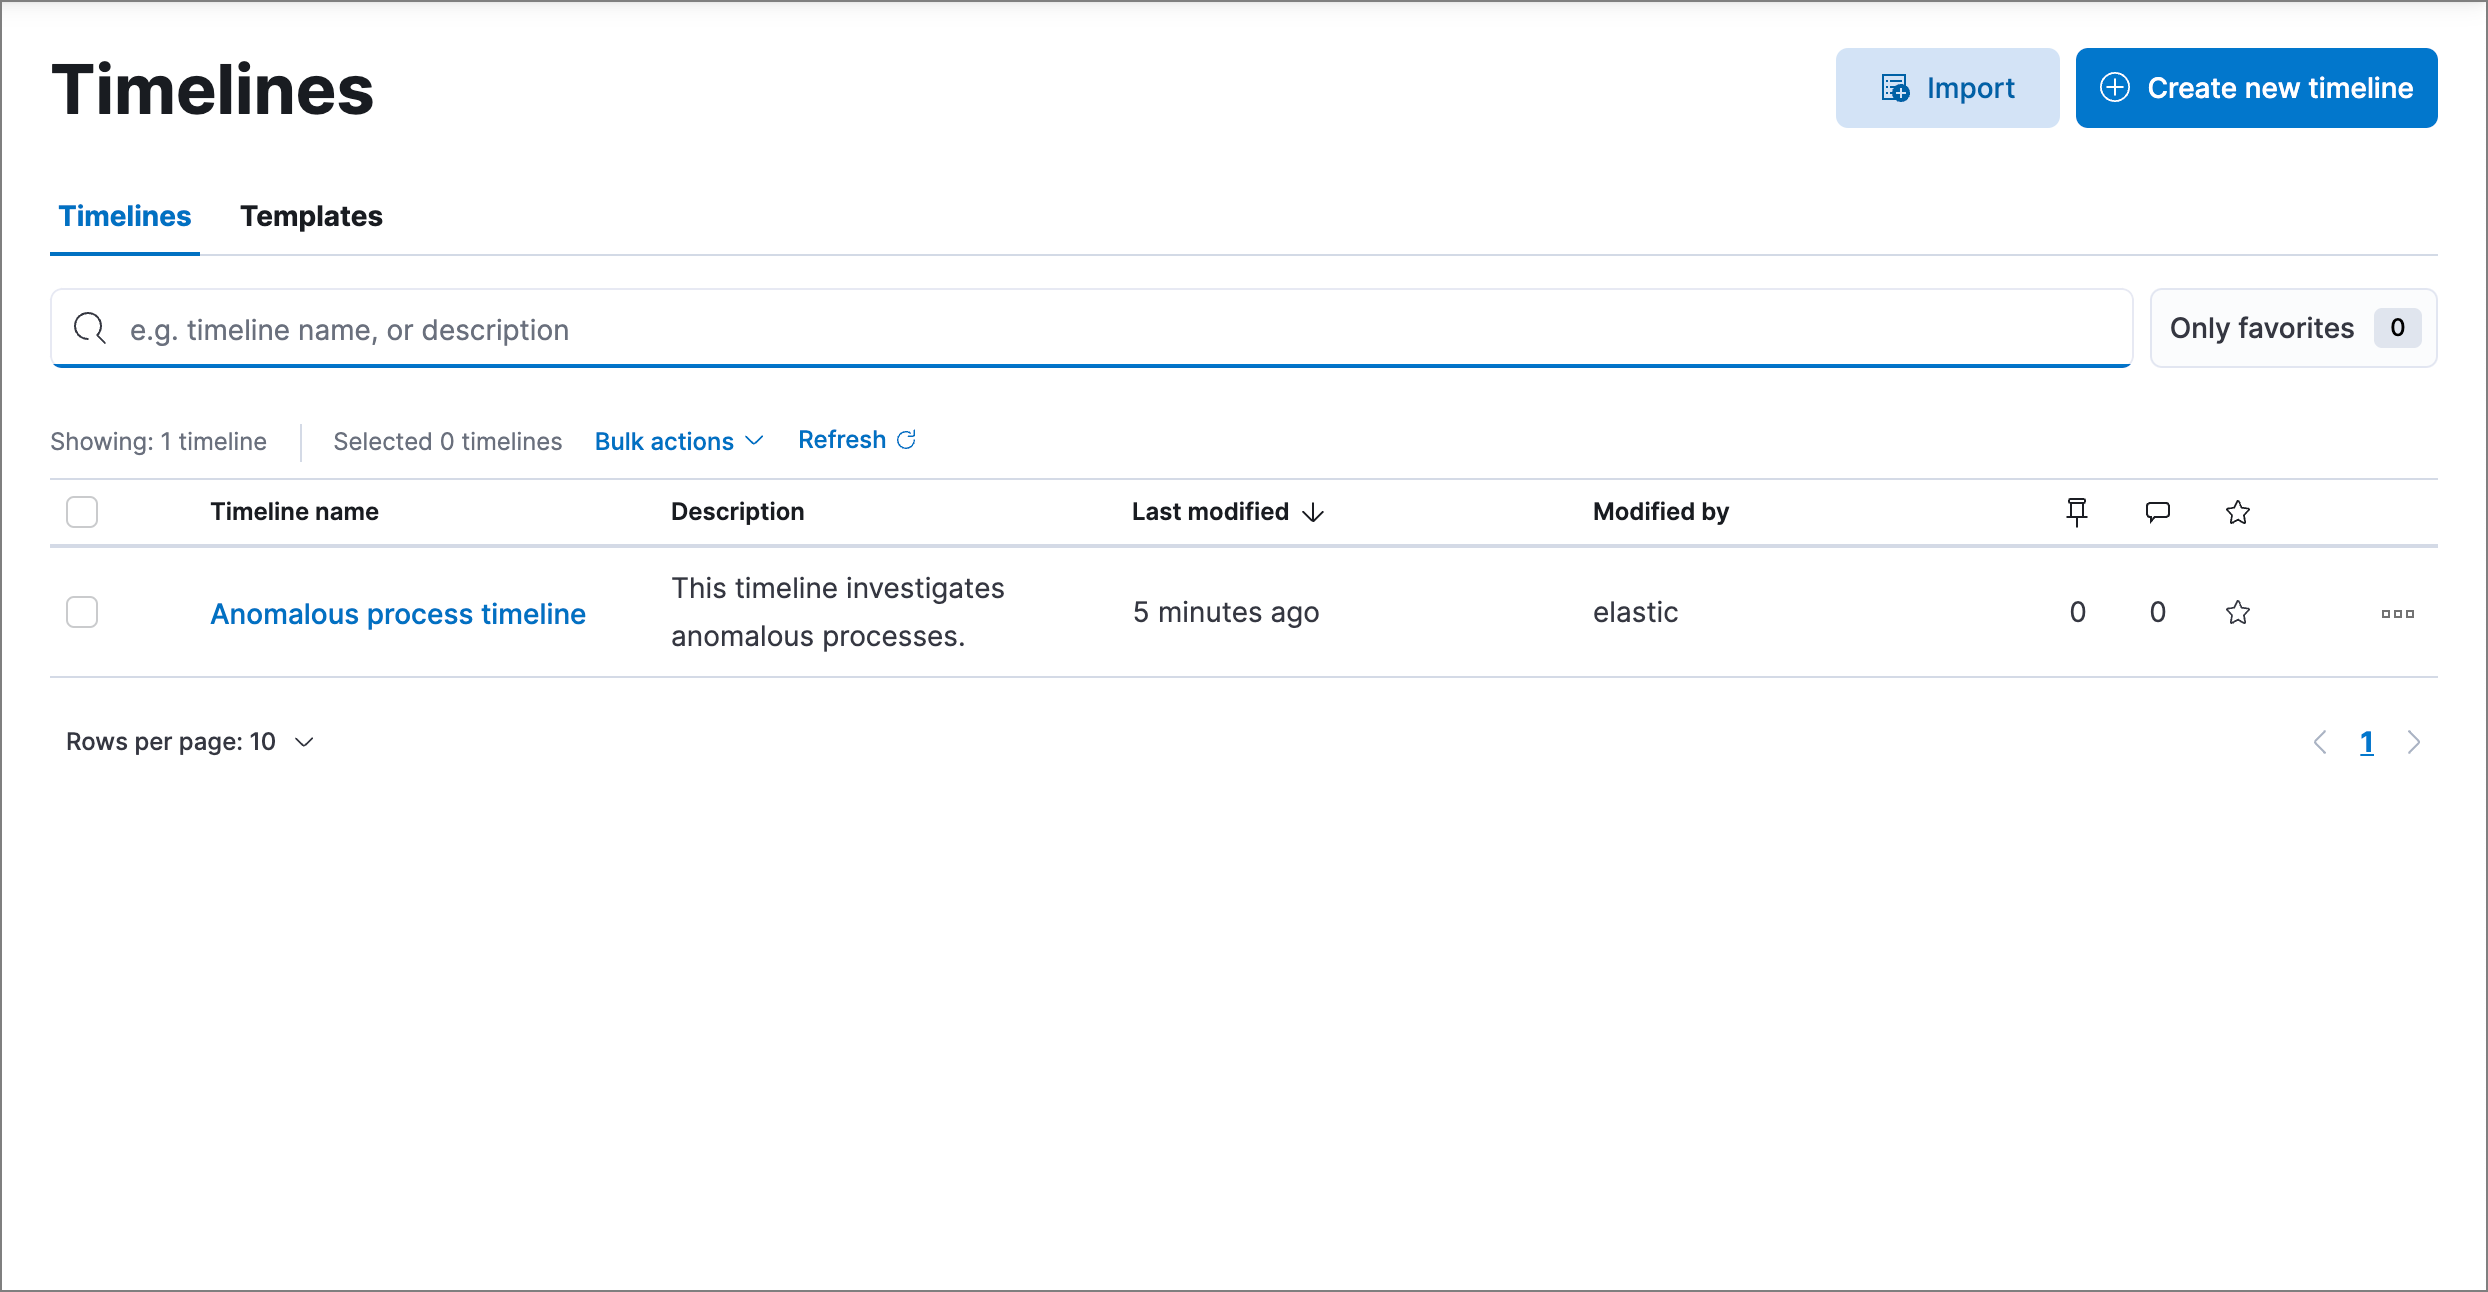
Timelines page
editUse the Timelines page to investigate alerts and complex threats, such as lateral movement of malware across hosts in your network. Timelines are responsive and allow you to share your findings among other team members. Refer to Investigate events in Timeline for information about getting started with Timelines.
Select the collapsable Timeline button at the bottom of the Elastic Security app to start an investigation.
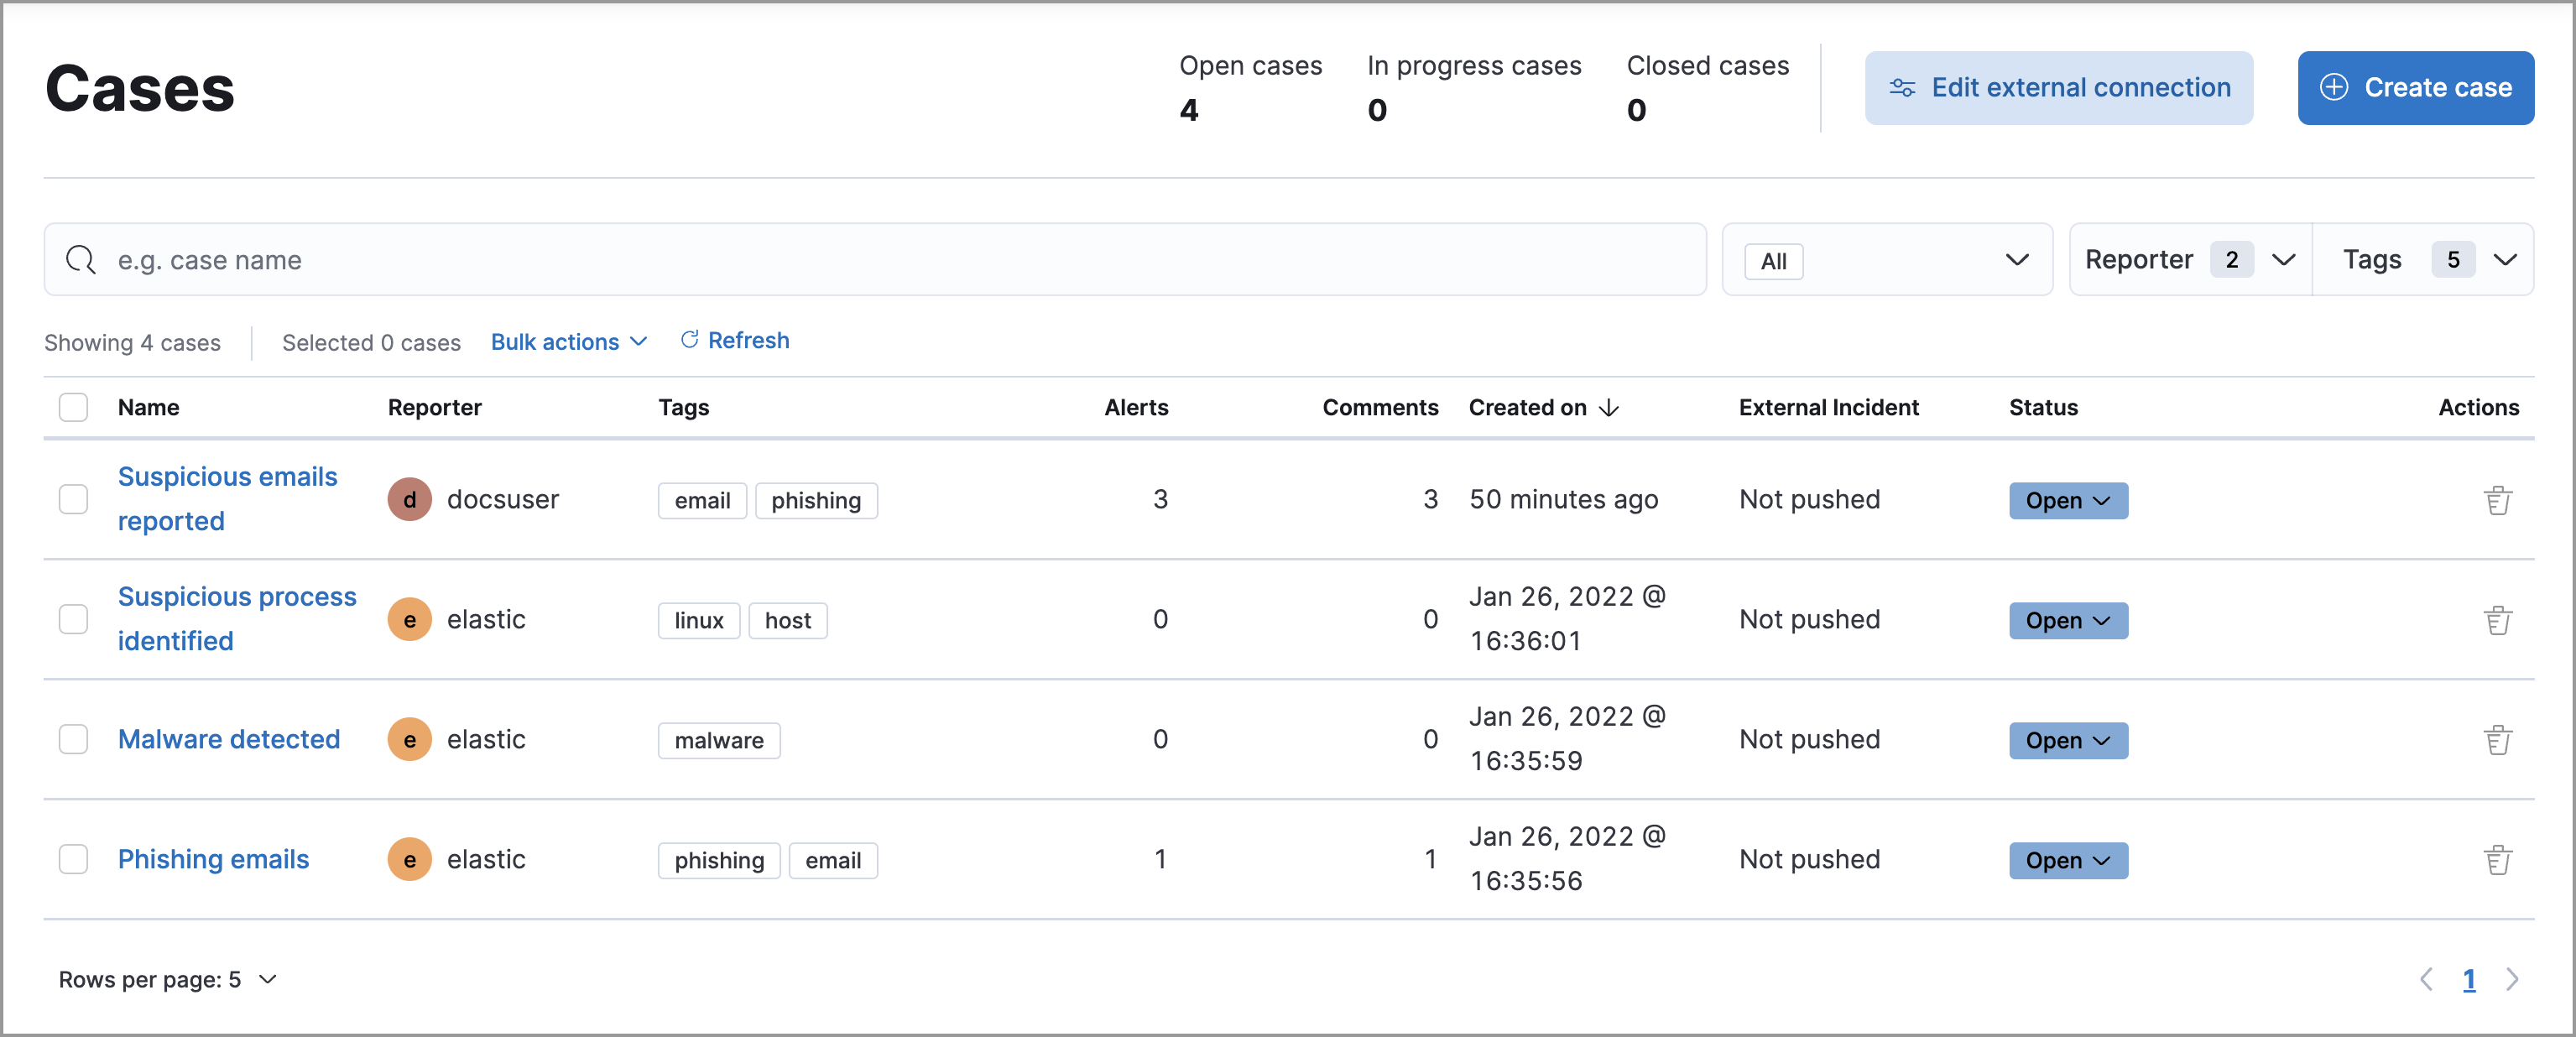
Cases page
editThe Cases page is used to open and track security issues directly in the Elastic Security app. Refer to Cases for more information.
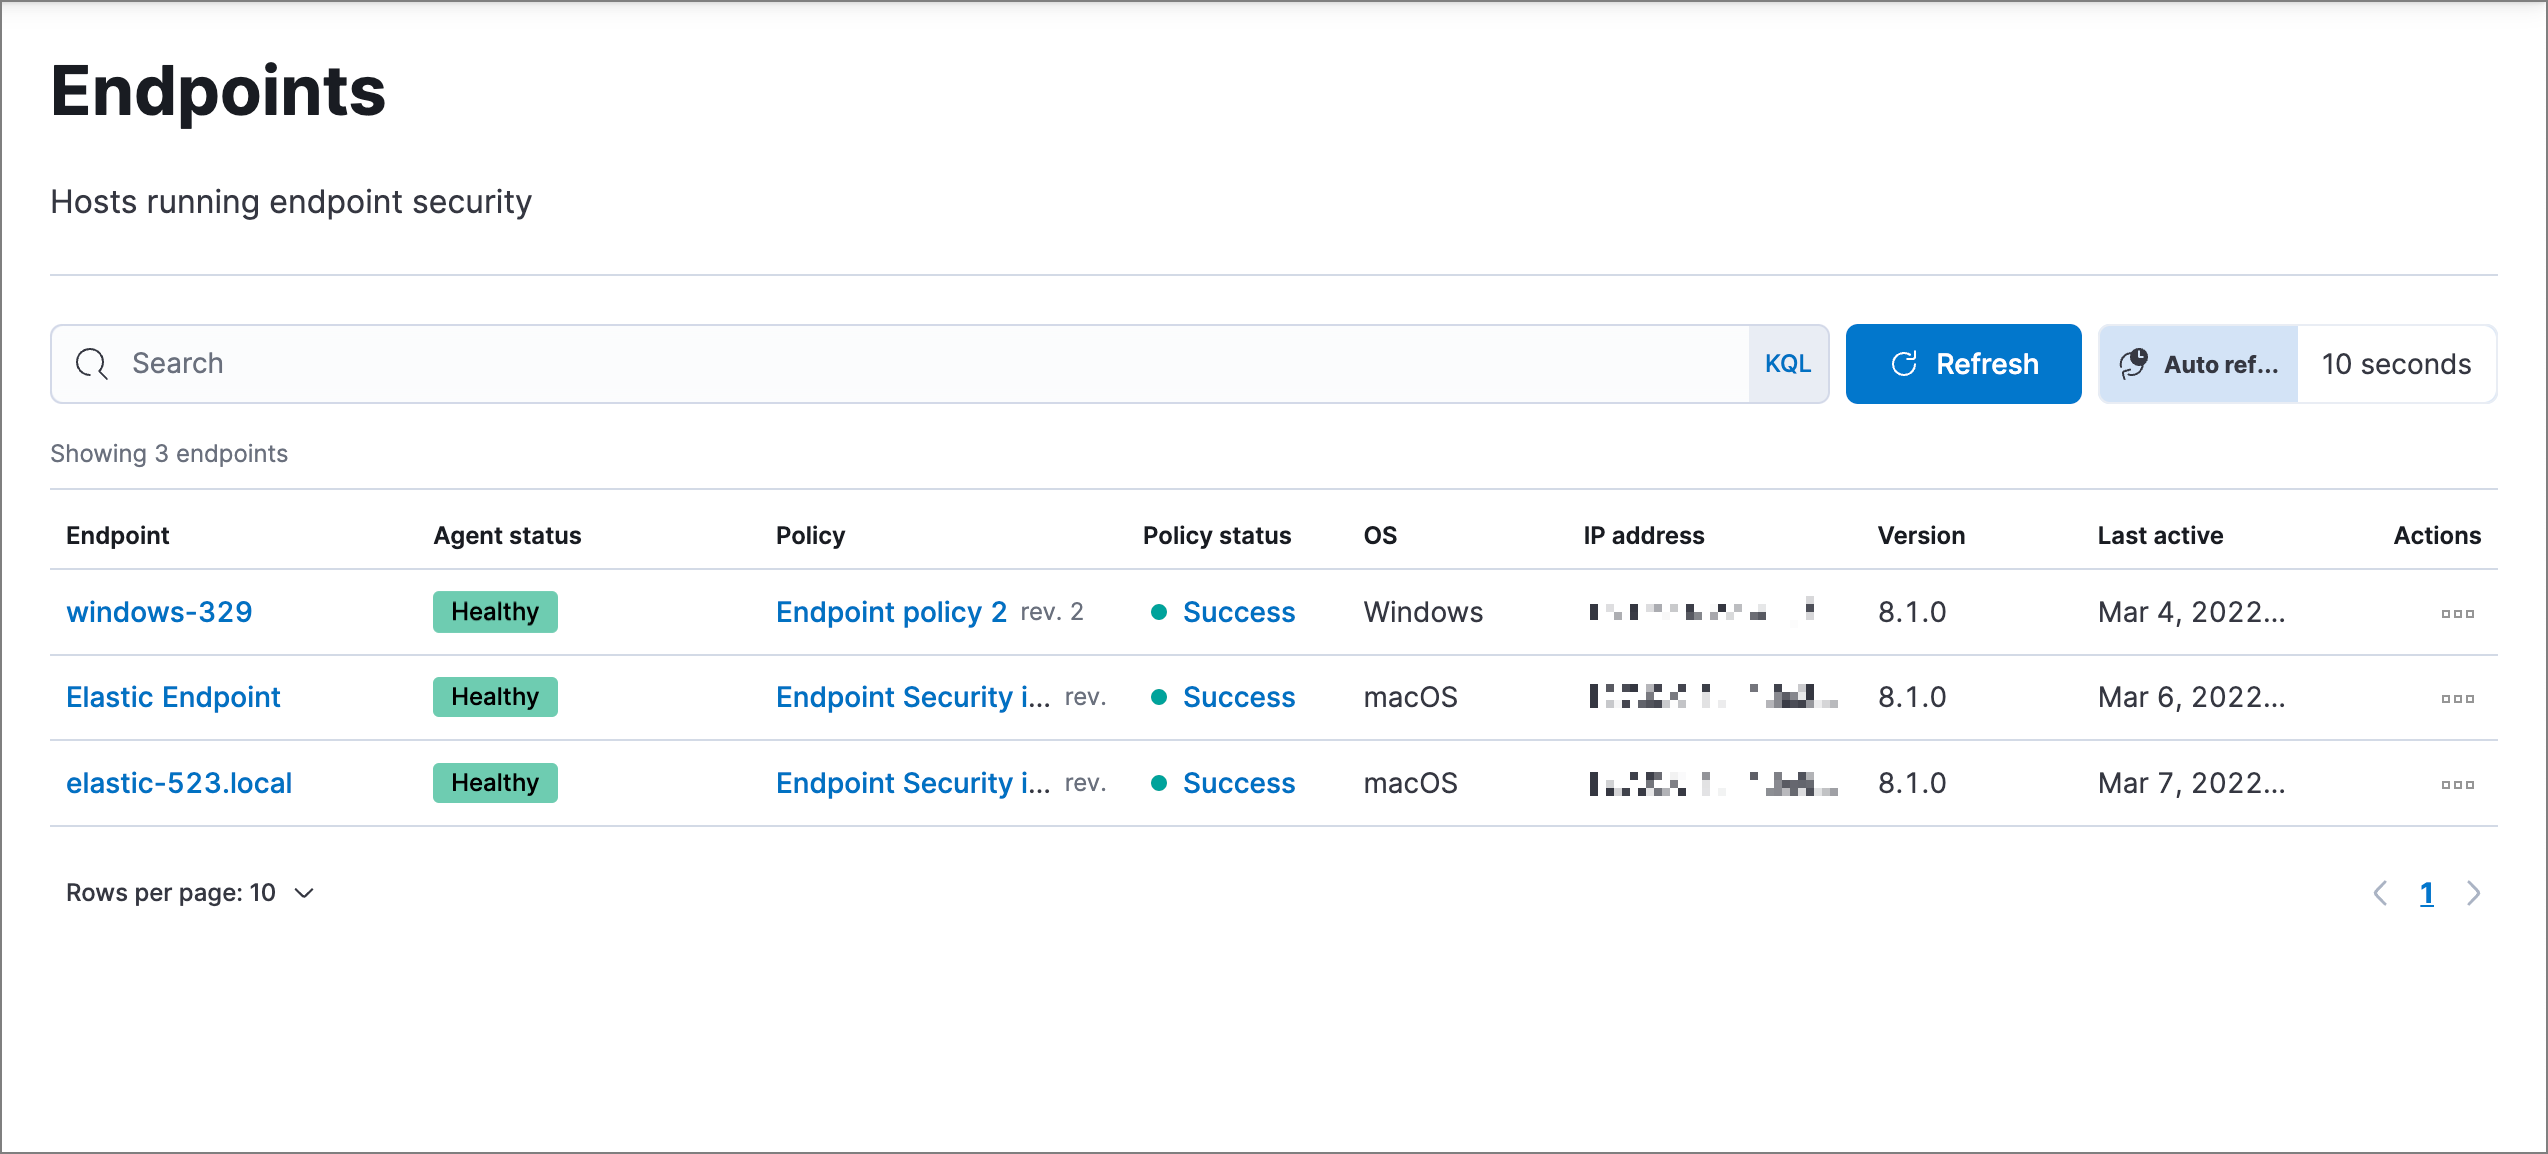
Endpoints page
editThe Endpoints page allows you to view and manage hosts running Endpoint Security. Refer to Endpoints for more information.
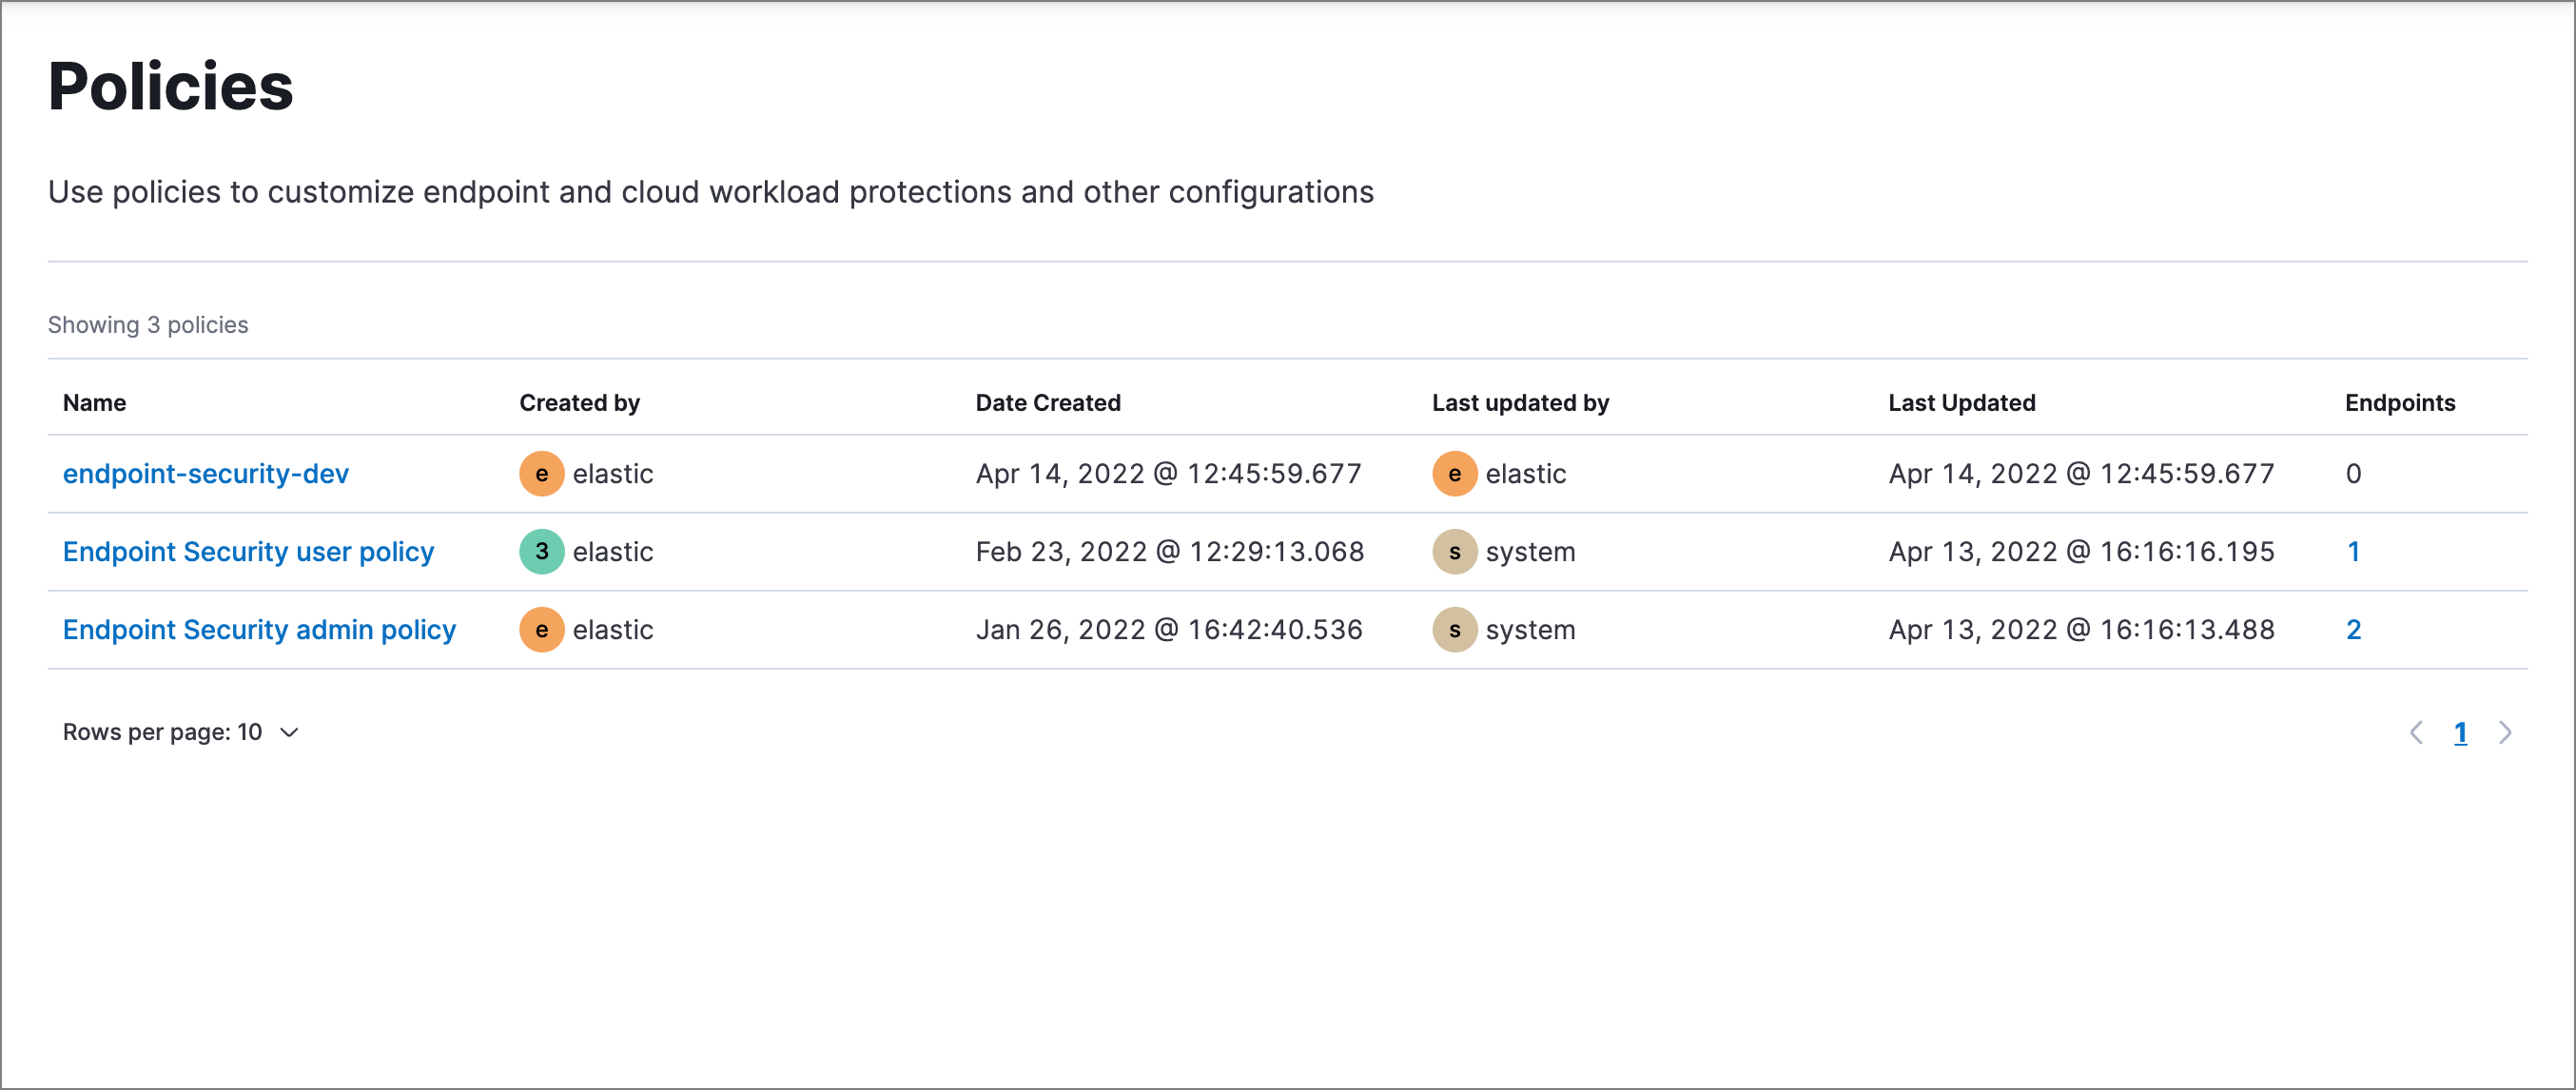
Policies page
editThe Policies page lists all of the integration policies configured for Endpoint Security. Refer to Policies for more information.
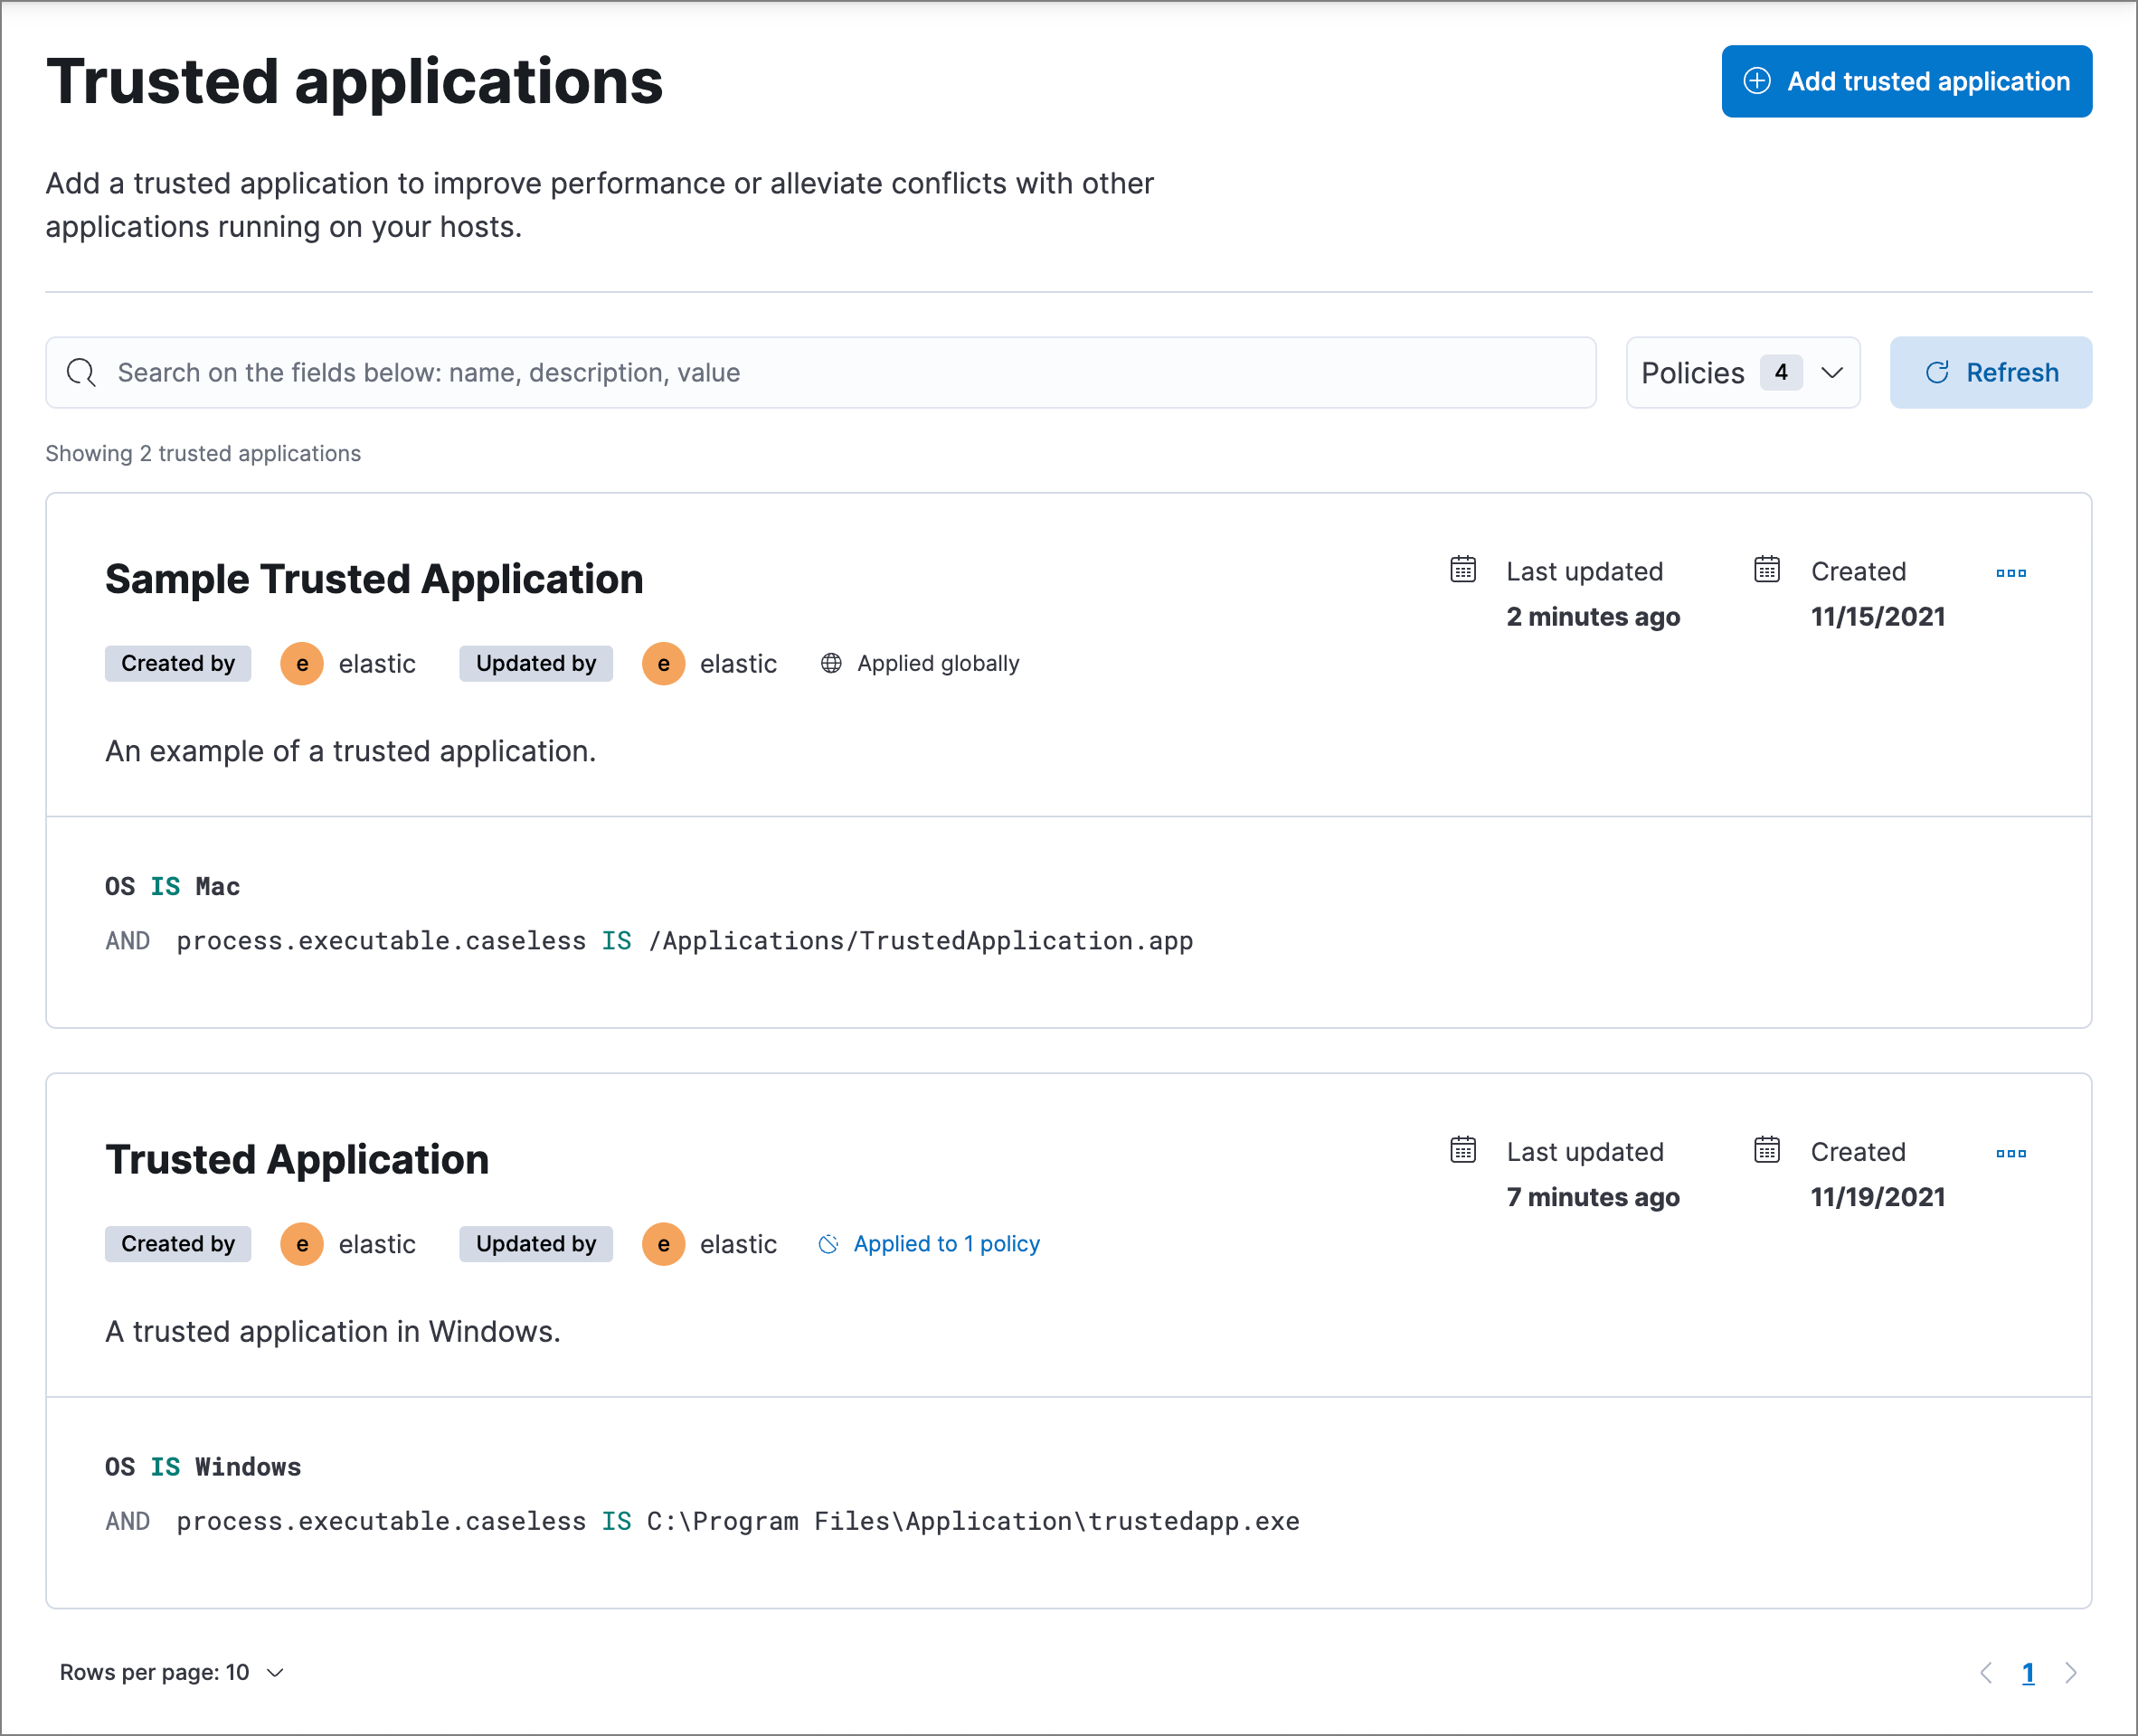
Trusted applications page
editThe Trusted applications page allows you to add Windows, macOS, and Linux applications that should be trusted. Refer to Trusted applications for more information.
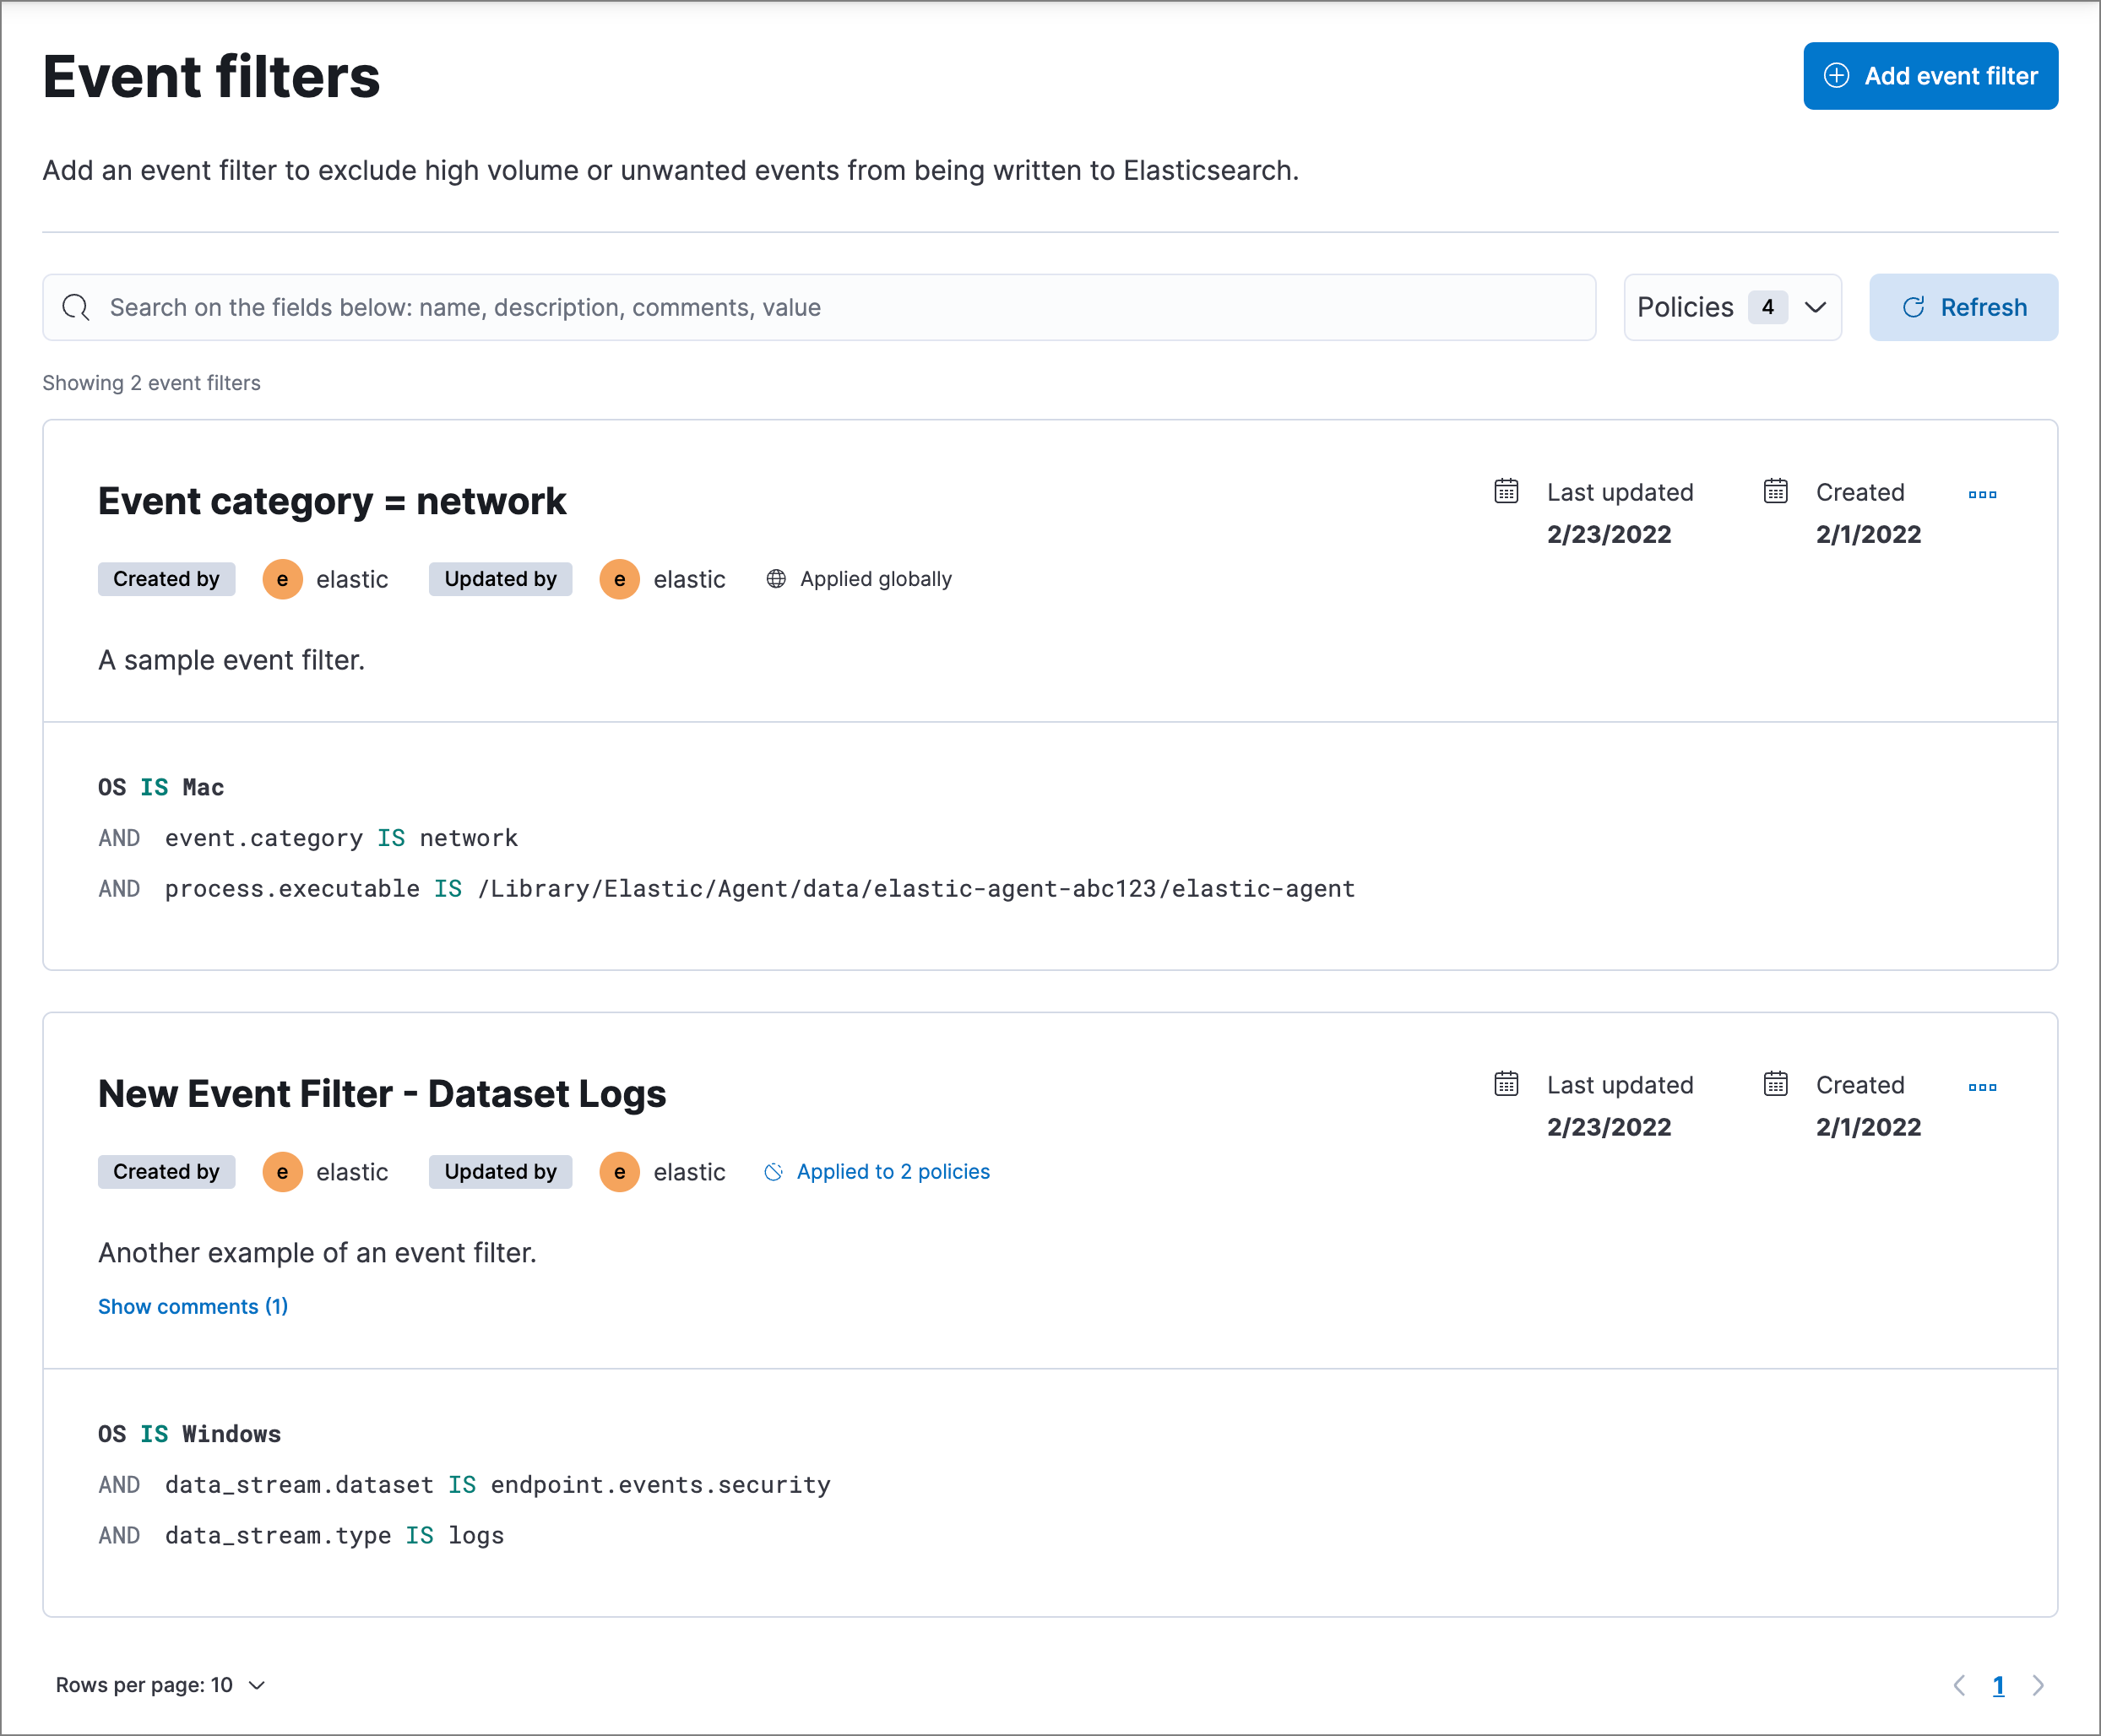
Event filters page
editThe Event filters page allows you to filter endpoint events that you do not need or want stored in Elasticsearch. Refer to Event filters for more information.
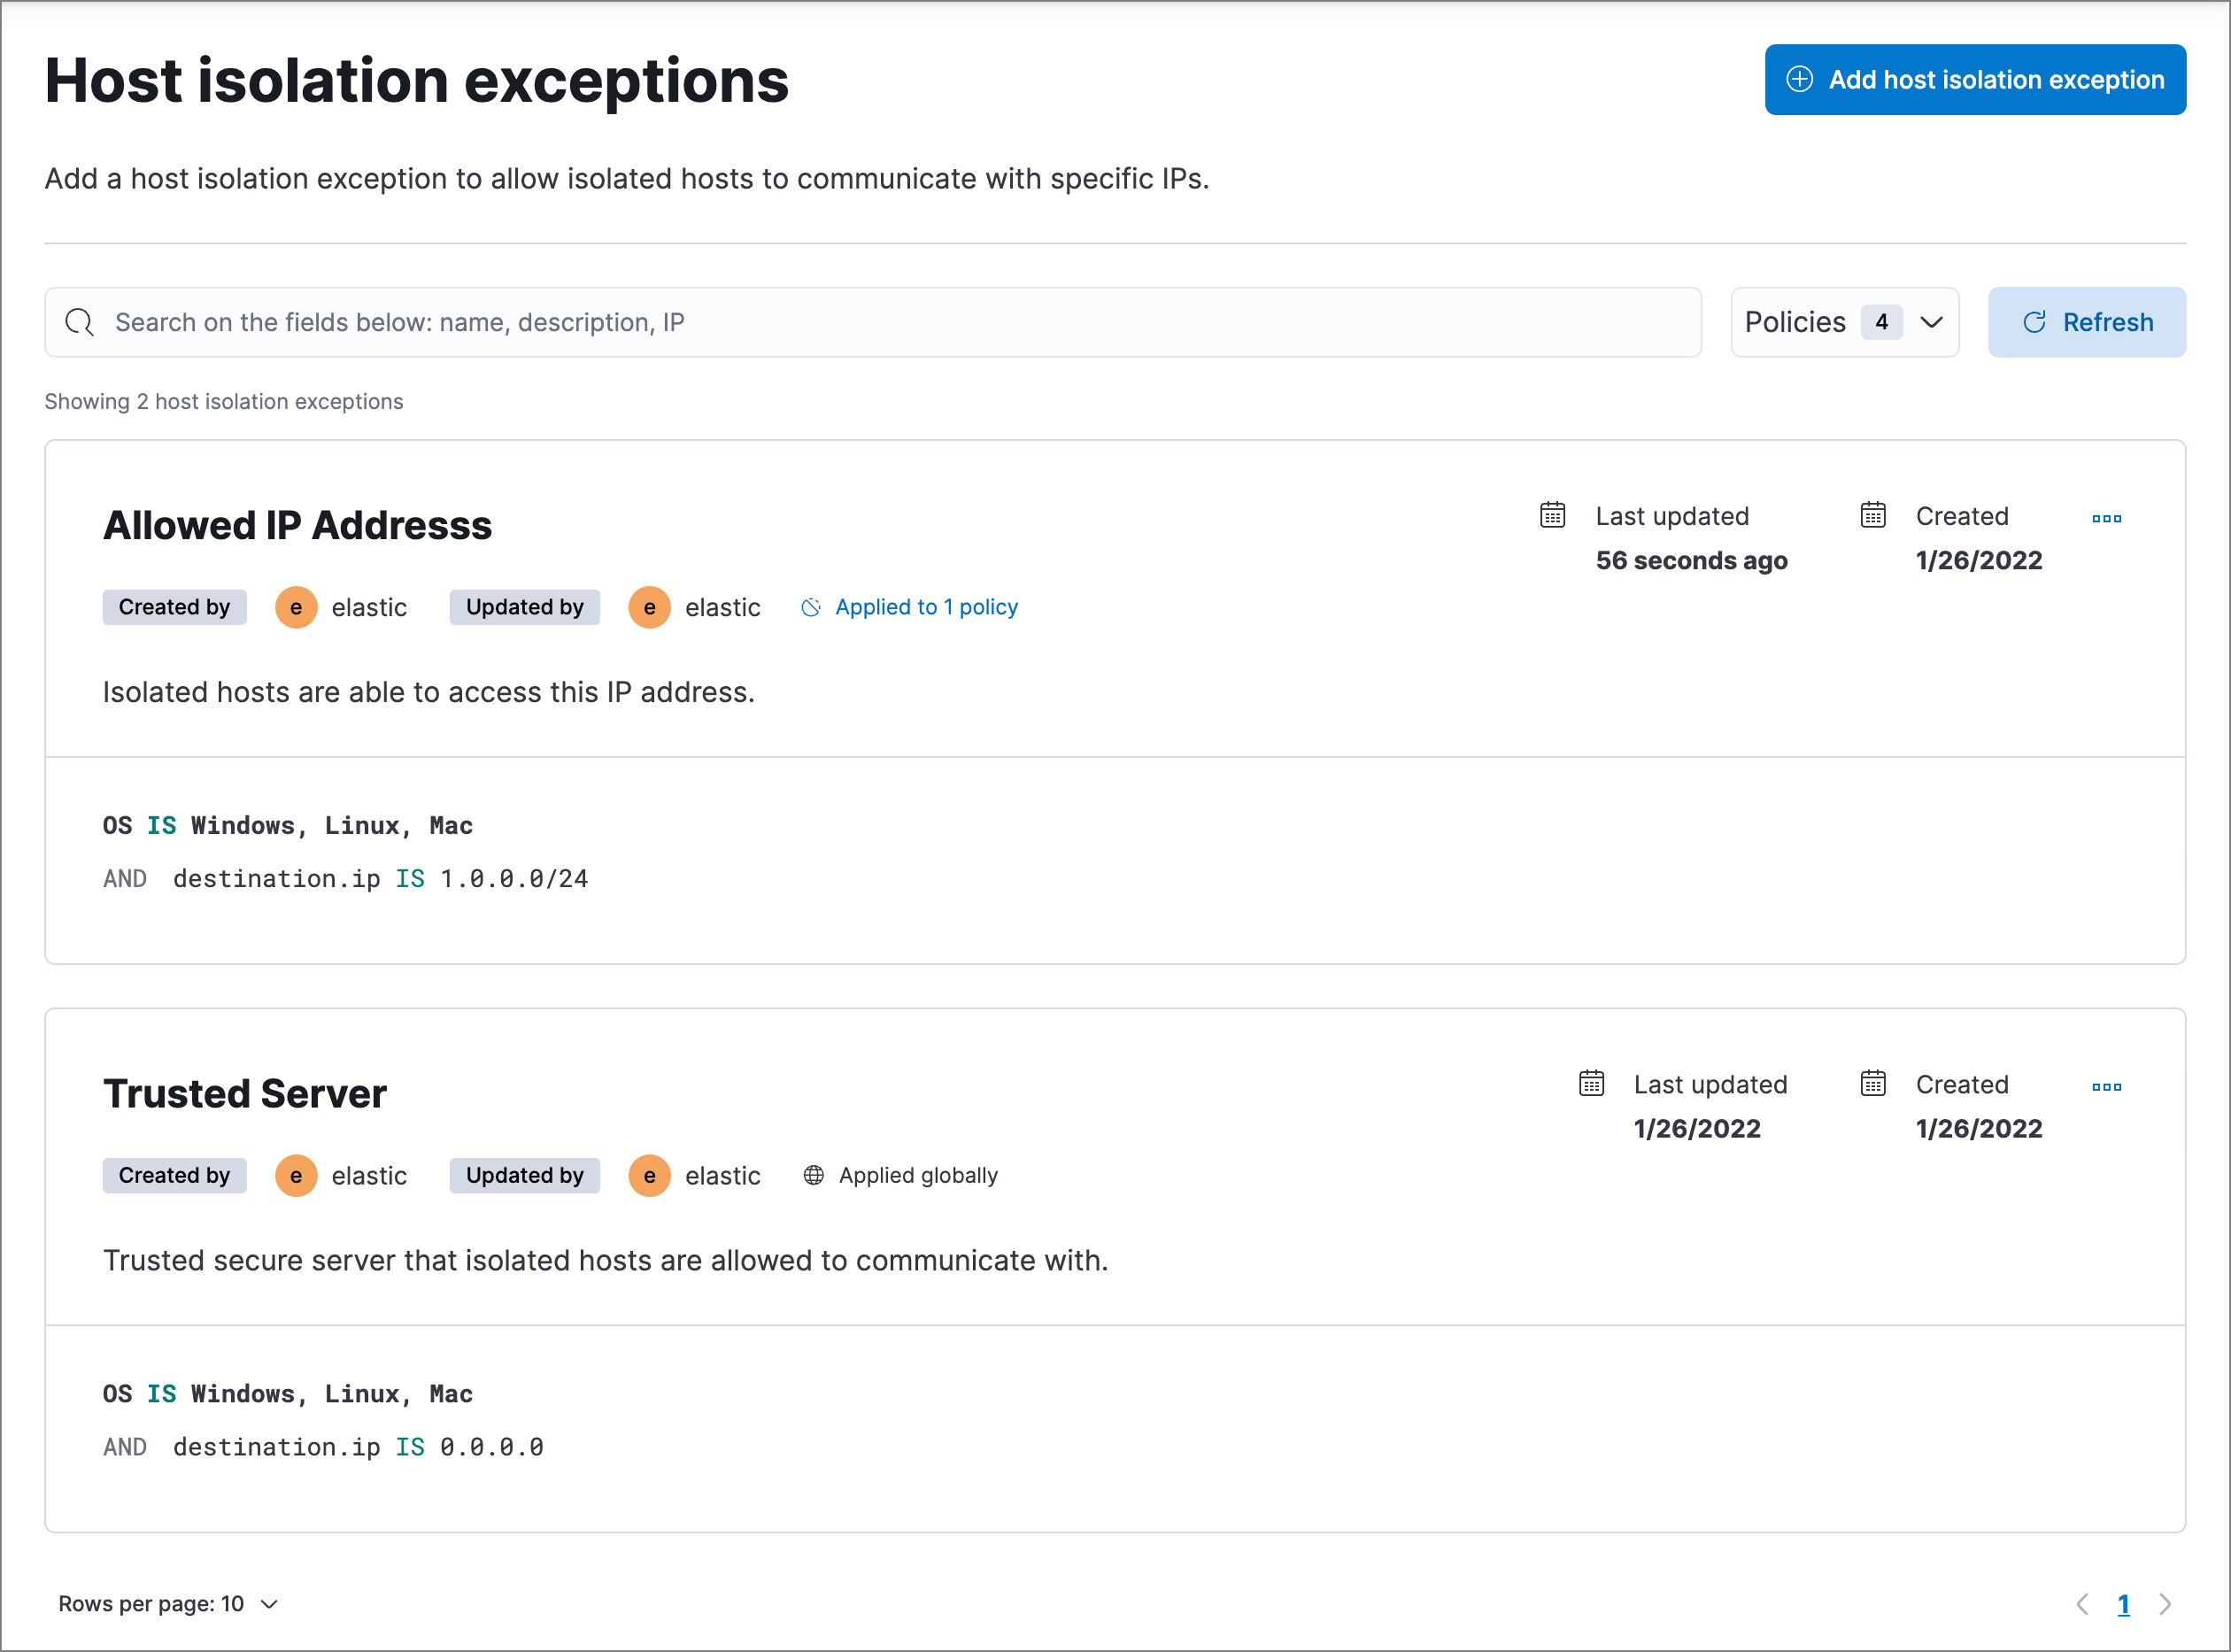
Host isolation exceptions page
editThe Host isolation exceptions page allows you to specify IP addresses that allow communication with isolated hosts, even when blocked from the rest of your network. Refer to Host isolation exceptions for more information.
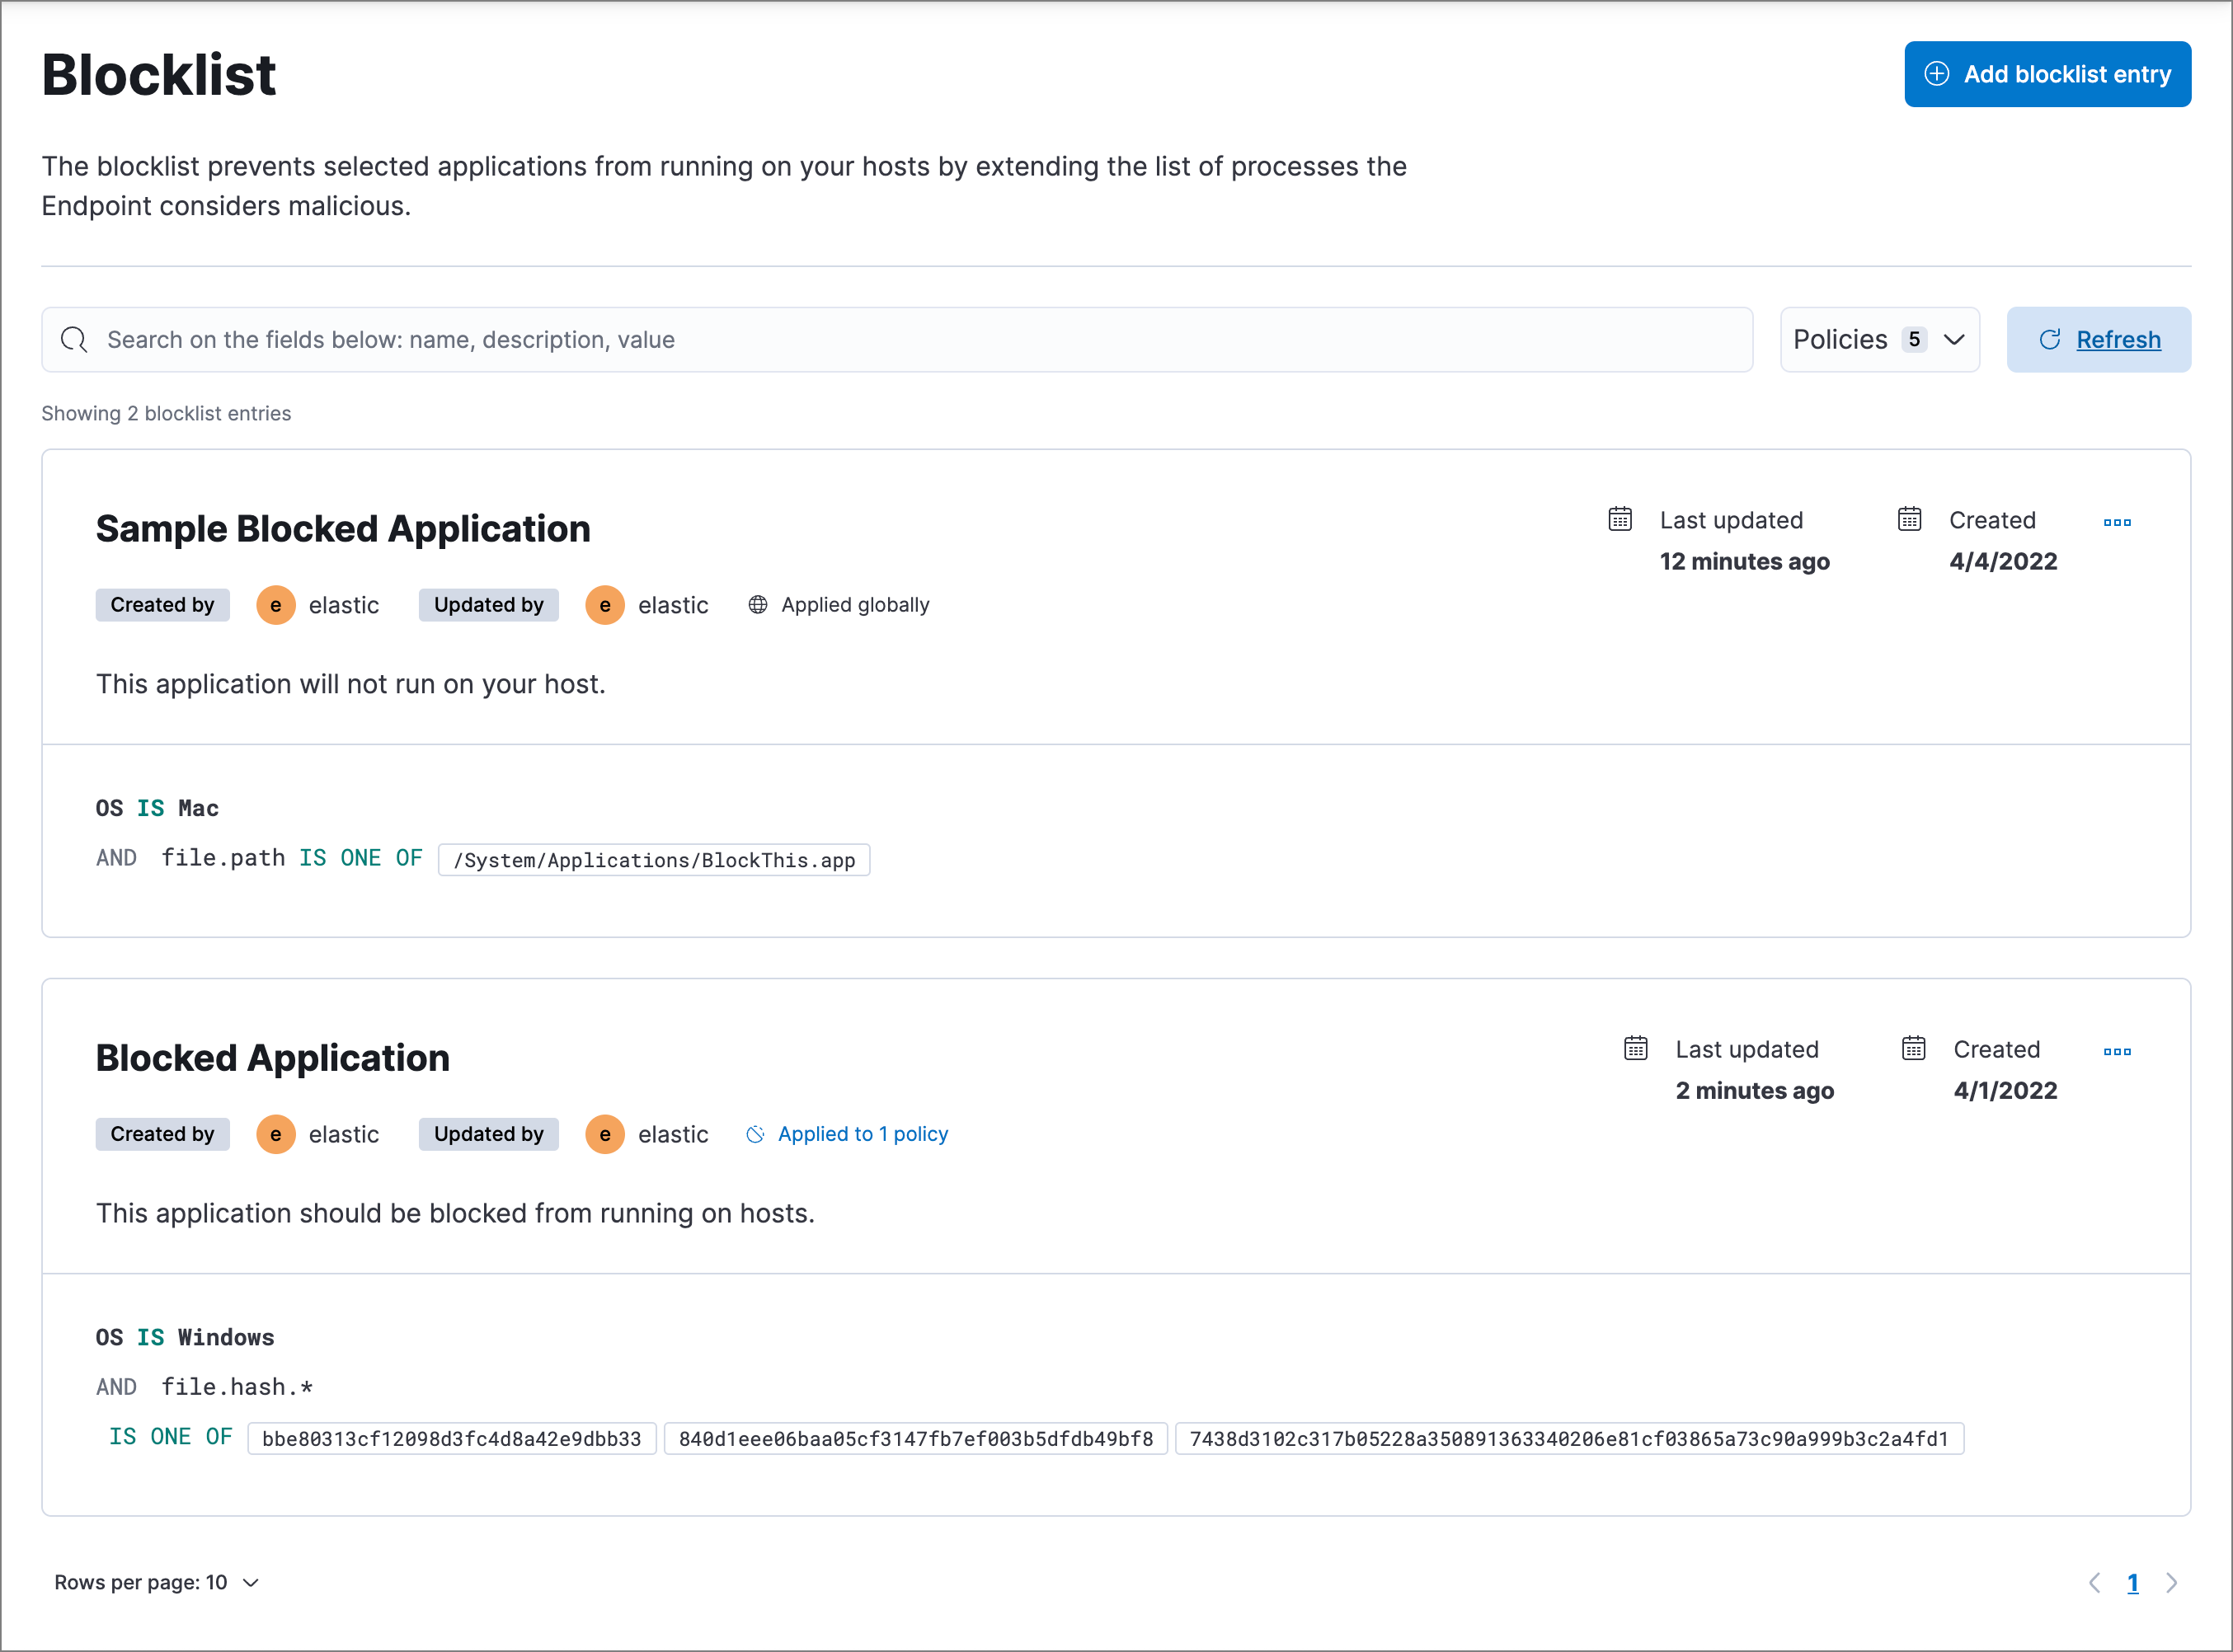
Blocklist page
editThe Blocklist page allows you to prevent specified applications from running on hosts, extending the list of processes that Endpoint Security considers malicious. Refer to Blocklist for more information.
Accessibility features
editAccessibility features, such as keyboard focus and screen reader support, are built into the Elastic Security UI. These features offer additional ways to navigate the UI and interact with the application.
Interact with draggable elements
editUse your keyboard to interact with draggable elements in the Elastic Security UI:
-
Press the
Tabkey to apply keyboard focus to an element within a table. Or, use your mouse to click on an element and apply keyboard focus to it.
-
Press
Enteron an element with keyboard focus to display its menu and pressTabto apply focus sequentially to menu options. Thef,o,a,t,chotkeys are automatically enabled during this process and offer an alternative way to interact with menu options.
- Press the spacebar once to begin dragging an element to a different location and press it a second time to drop it. Use the directional arrows to move the element around the UI.
-
If an event has an event renderer, press the
Shiftkey and the down directional arrow to apply keyboard focus to the event renderer andTaborShift+Tabto navigate between fields. To return to the cells in the current row, press the up directional arrow. To move to the next row, press the down directional arrow.
Navigate the Elastic Security UI
editUse your keyboard to navigate through rows, columns, and menu options in the Elastic Security UI:
- Use the directional arrows to move keyboard focus right, left, up, and down in a table.
-
Press the
Tabkey to navigate through a table cell with multiple elements, such as buttons, field names, and menus. Pressing theTabkey will sequentially apply keyboard focus to each element in the table cell.
-
Use
CTRL + Hometo shift keyboard focus to the first cell in a row. Likewise, useCTRL + Endto move keyboard focus to the last cell in the row.

-
Use the
Page UpandPage Downkeys to scroll through the page.