Users page
editUsers page
editThe Users page provides a comprehensive overview of user data to help you understand authentication and user behavior within your environment. Key performance indicator (KPI) charts, data tables, and interactive widgets let you view specific data and drill down for deeper insights. Here’s some of the information available to you:
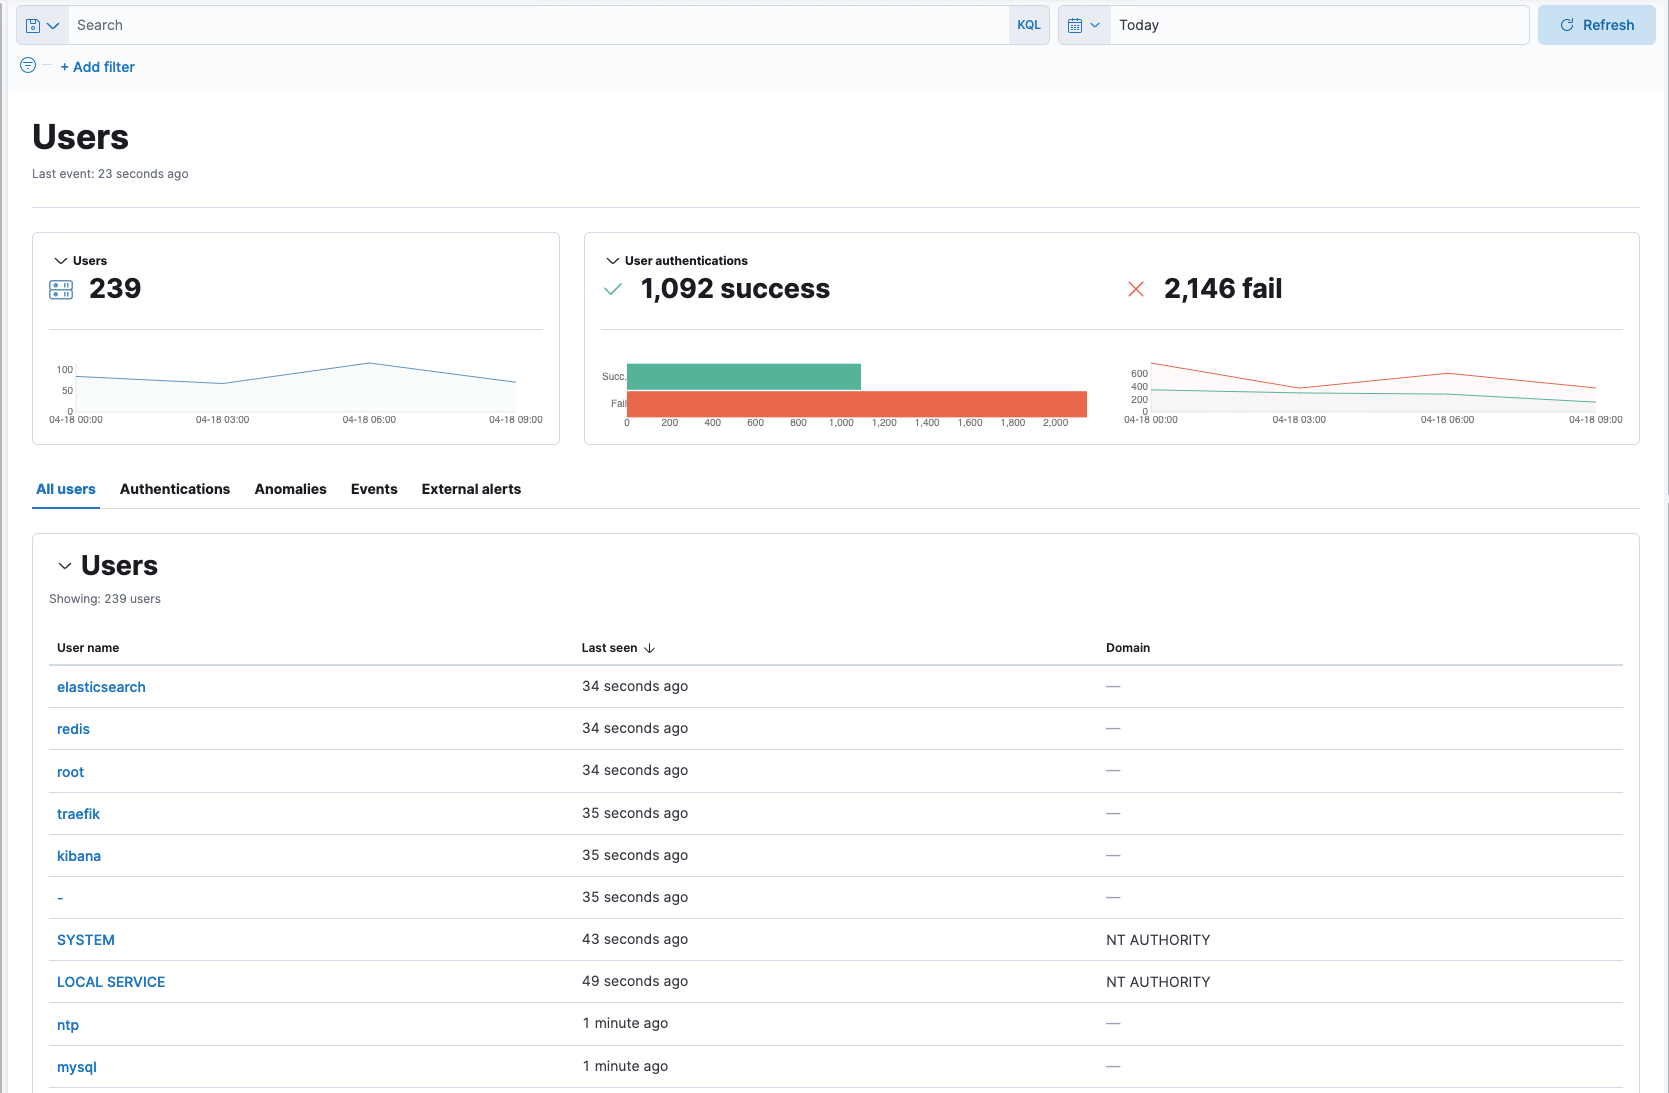
User KPI charts
KPI charts show the total number of users and successful and failed user authentications within the time range specified in the date picker. Data in the KPI charts is visualized through linear and bar graphs.
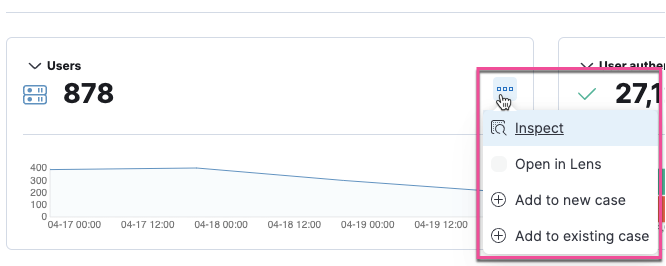
Hover your cursor inside a KPI chart to access the actions menu (…), where you can perform these actions: inspect, open in Lens, and add to a new or existing case.
Data tables
Beneath the KPI charts are data tables, which are useful for viewing and investigating specific types of data. Select the relevant tab to view the following details:
- All users: A chronological list of unique user names, when they were last active, and the associated domains.
- Authentications: A chronological list of user authentication events and associated details, such as the number of successes and failures, and the hostname of the last successful destination.
- Anomalies: Unusual activity discovered by machine learning jobs that contain user data.
-
Events: Ingested events that contain the
user.namefield. You can stack by theevent.action,event.dataset, orevent.modulefield. -
External alerts: Alerts received from external monitoring tools. You can stack by the
event.moduleorevent.categoryfield.
The tables within the Events and External alerts tabs include inline actions and several customization options. To learn more about what you can do with the data in these tables, refer to Manage detection alerts.