Monitor and troubleshoot rule executions
editMonitor and troubleshoot rule executions
editThe Rules page offers several ways to gain insight into the status of your detection rules:
- Rule Monitoring tab — The current state of all detection rules and their most recent executions. Go to the Rule Monitoring tab to get an overview of which rules are running, how long they’re taking, and if they’re having any trouble.
- Rule execution logs — Historical data for a single detection rule’s executions over time. Consult the rule execution logs to understand how a particular rule is running and whether it’s creating the alerts you expect.
Refer to the Troubleshoot missing alerts section below for strategies on using these tools.
Rule Monitoring tab
editTo view a summary of all rule executions, including the most recent failures and execution times, select the Rule Monitoring tab on the Rules page (Detect → Rules → Rule Monitoring).
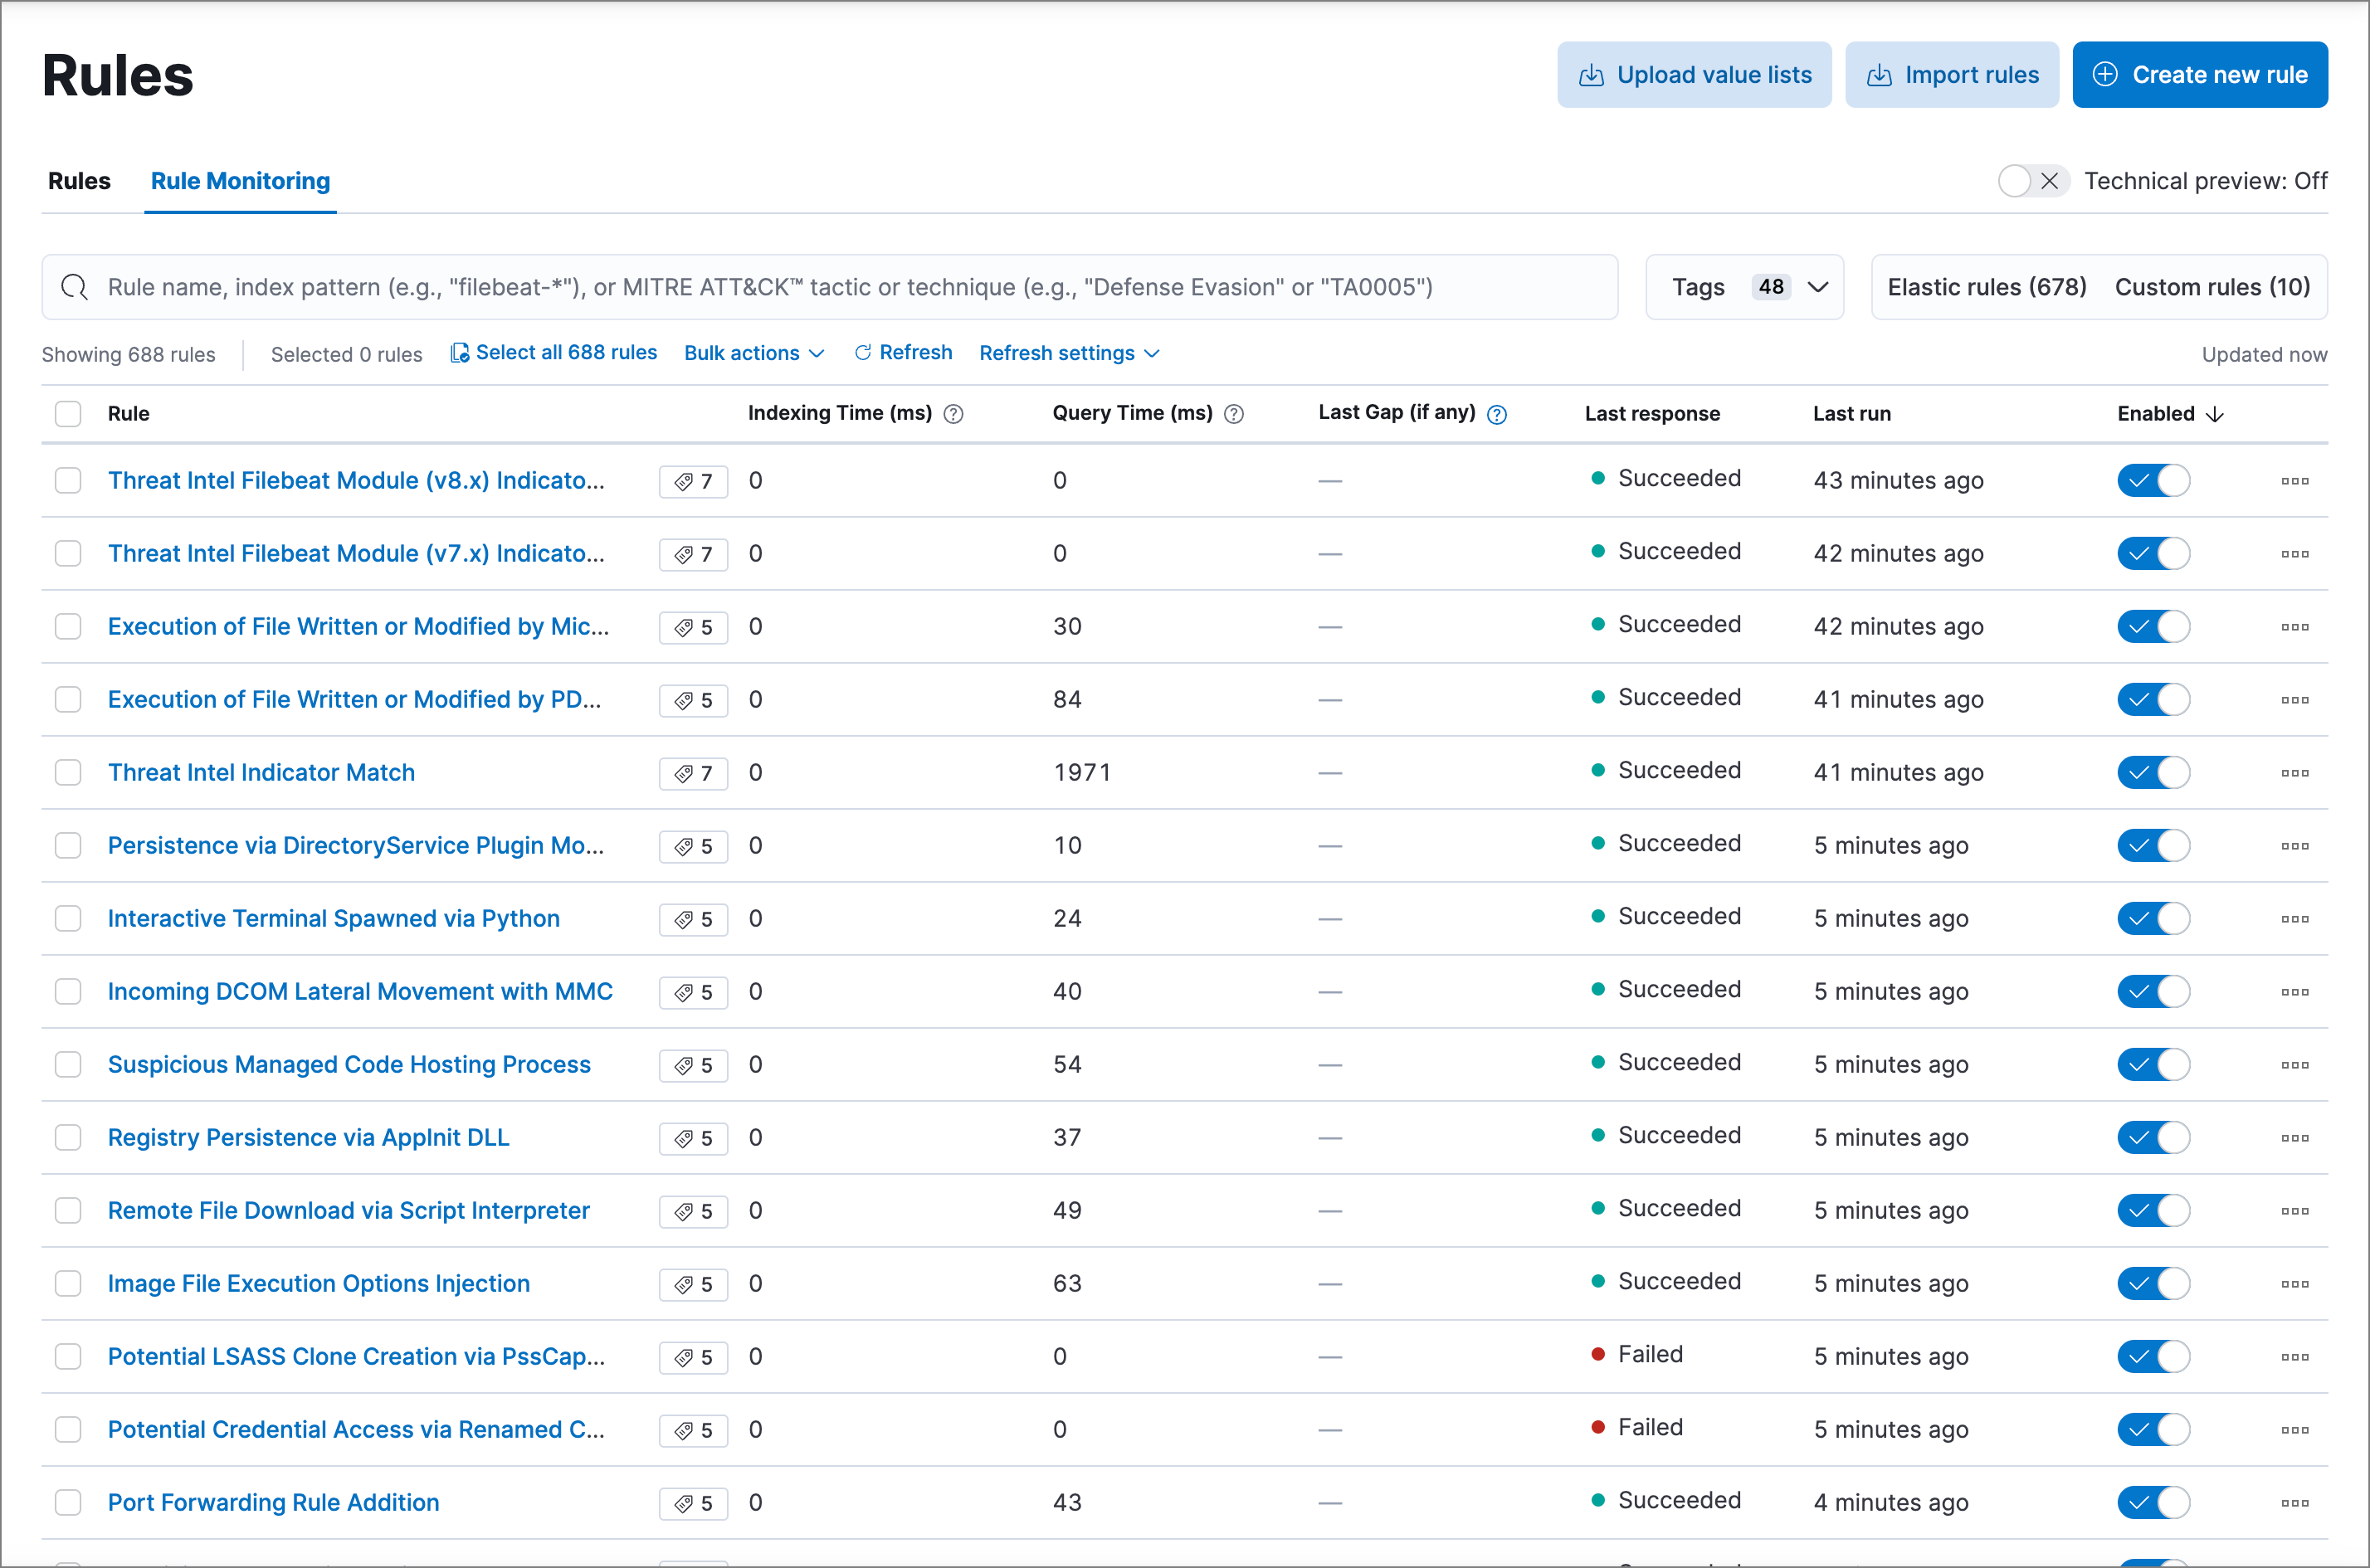
On the Rule Monitoring tab, you can sort and filter rules just like you can on the Rules tab.
By default, you can only sort by the Rule and Enabled columns on this tab. To sort by any other column, switch on the Technical preview toggle above the table. This experimental table view allows advanced sorting capabilities. If you experience performance issues when working with the table, you can turn this setting off.
For detailed information on a rule, the alerts it generated, and associated errors, click on its name in the table. This also allows you to perform the same actions that are available on the Rules tab, such as modifying or deleting rules, activating or deactivating rules, exporting or importing rules, and duplicating prebuilt rules.
Rule execution logs
editEach detection rule execution is logged, including its success or failure, any warning or error messages, and how long it took to search for data, create alerts, and complete. This can help you troubleshoot a particular rule if it isn’t behaving as expected (for example, if it isn’t creating alerts or takes a long time to run).
To access a rule’s execution log, go to Detect → Rules, click the rule’s name to open its details, then scroll down and select the Rule execution logs tab.
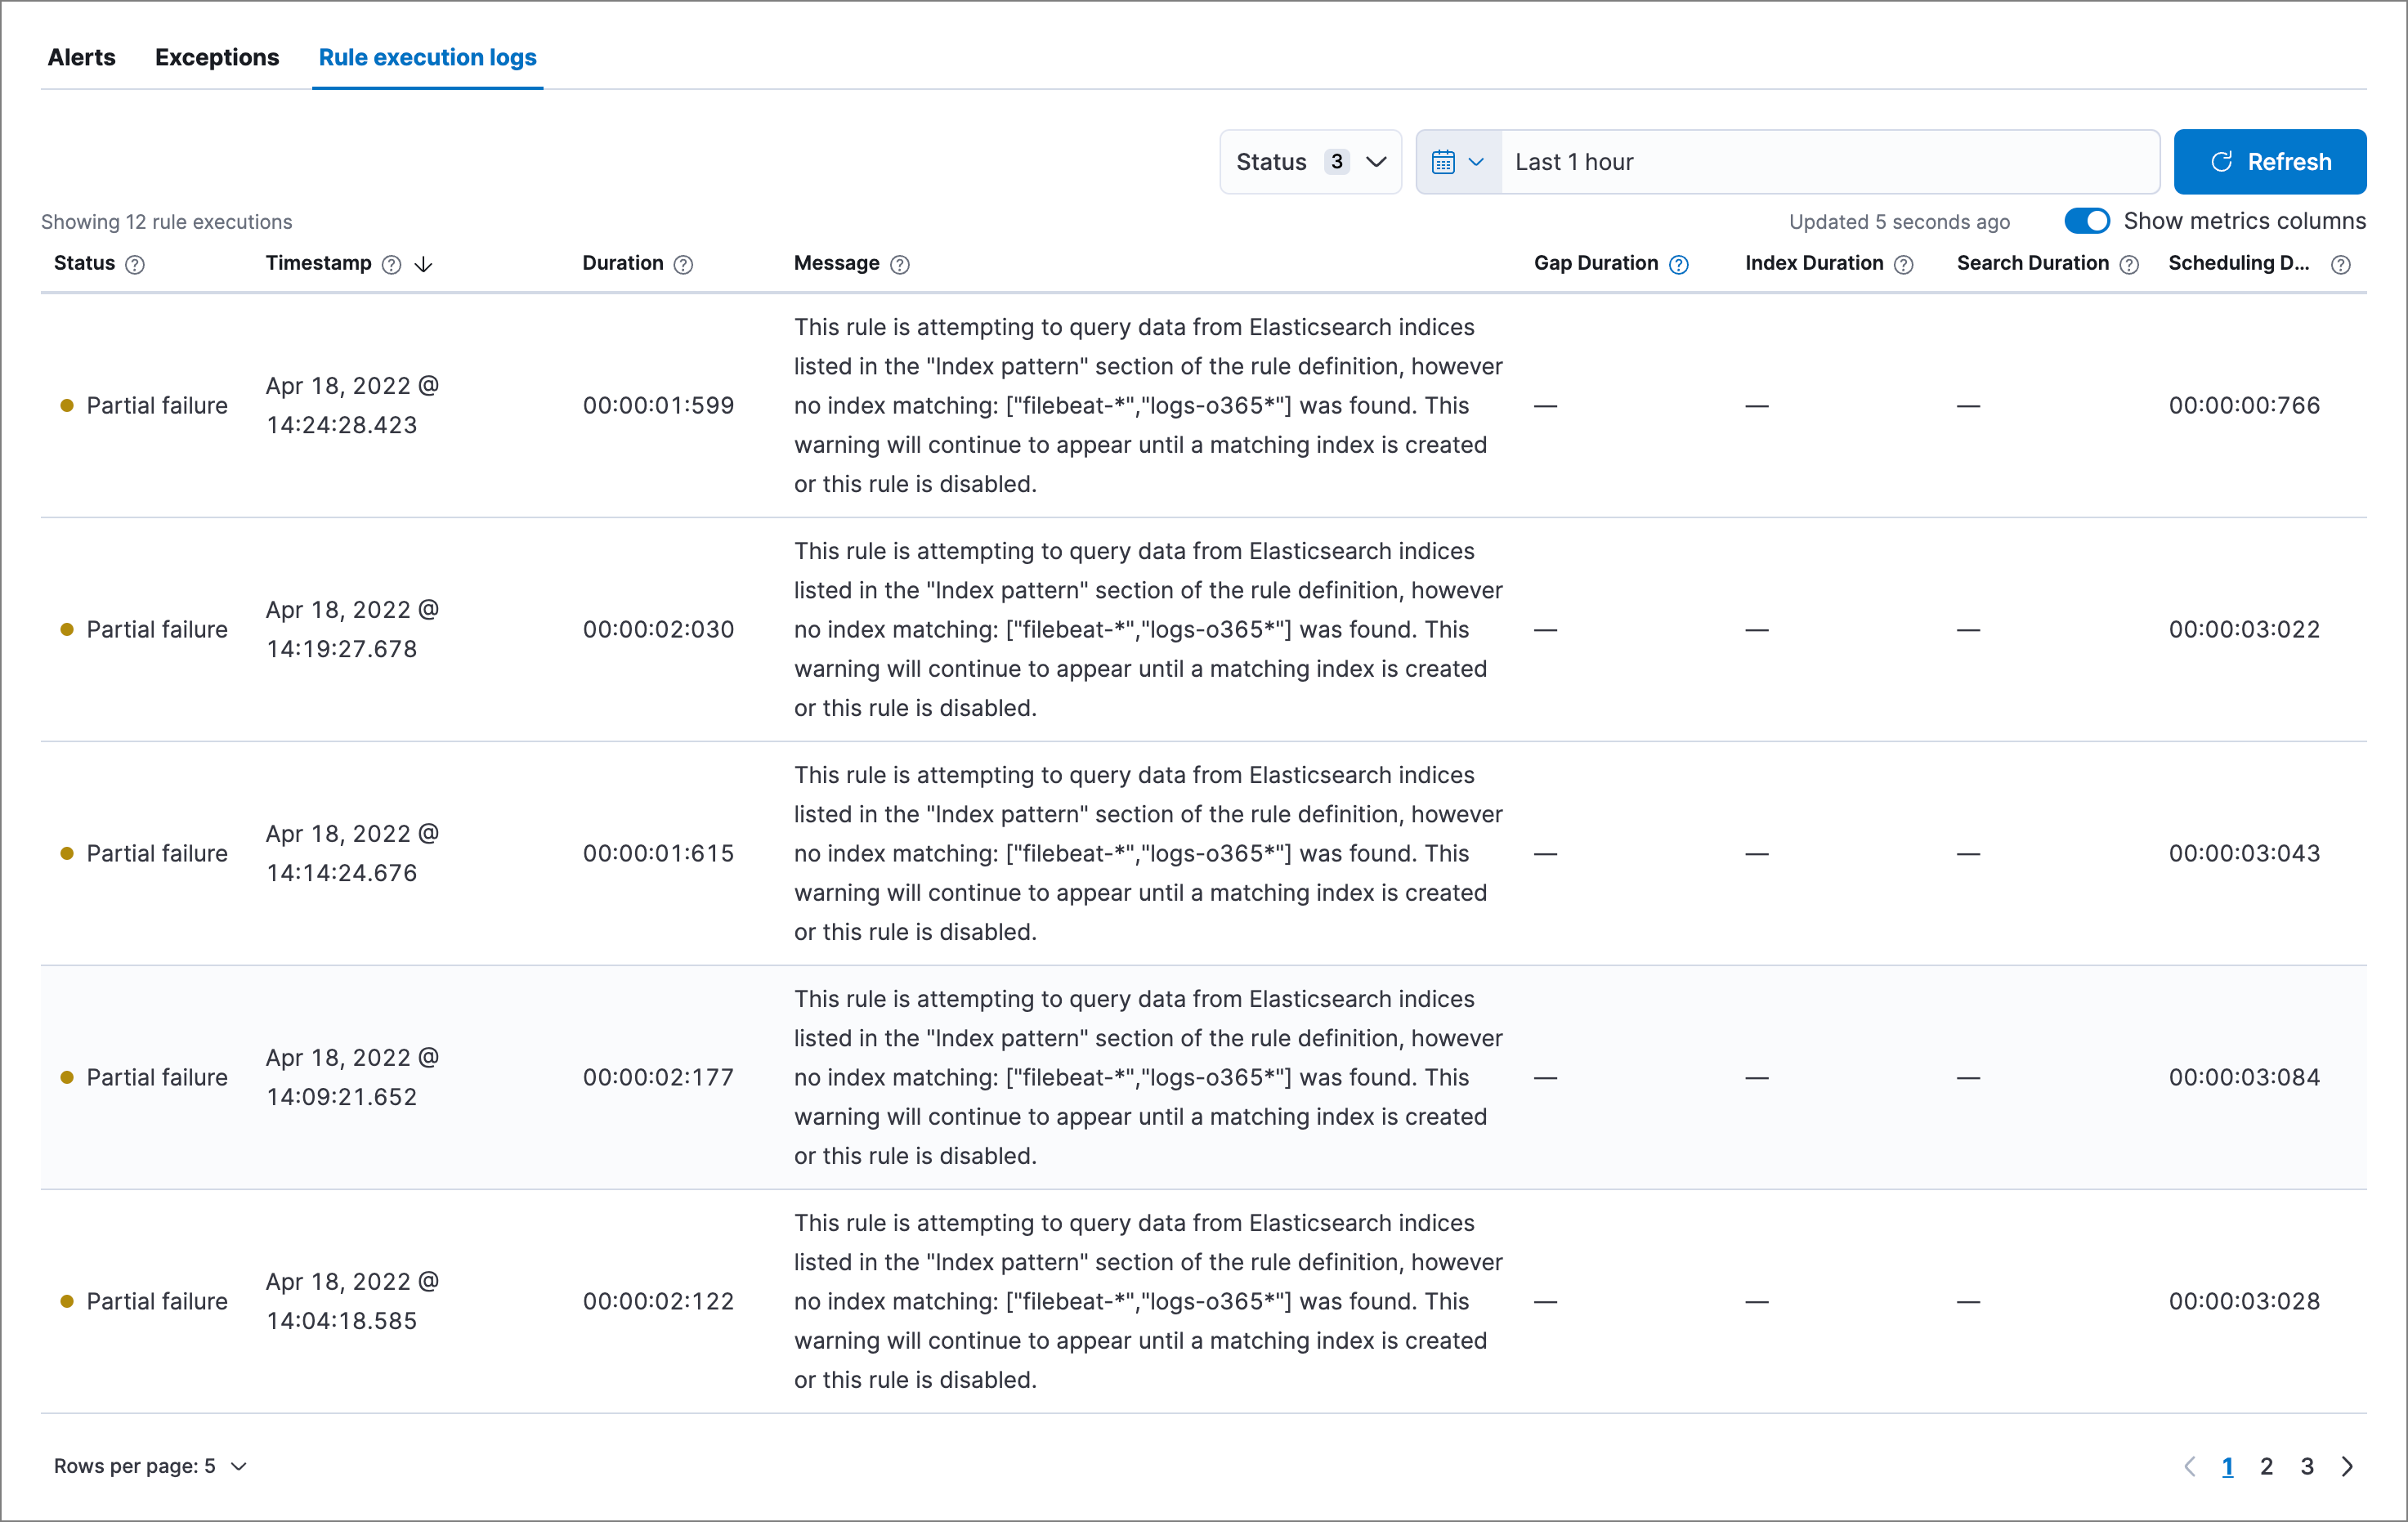
You can hover over each column heading to display a tooltip about that column’s data. Click a column heading to sort the table by that column.
Use these controls to filter what’s included in the logs table:
-
The Status drop-down filters the table by rule execution status:
- Succeeded: The rule was able to complete its defined search. This doesn’t necessarily mean it generated an alert, just that it ran without error.
- Failed: The rule encountered an error that prevented it from running. For example, a machine learning rule whose corresponding machine learning job wasn’t running.
- Partial failure: Nothing prevented the rule from running, but it still might not have returned the expected results. For example, a custom query rule tried to search an index pattern that couldn’t be found in Elasticsearch.
- The date and time picker sets the time range of rule executions included in the table. This is separate from the global date and time picker at the top of the rule details page.
- The Show metrics columns toggle includes more or less data in the table, pertaining to the timing of each rule execution.
Troubleshoot missing alerts
editWhen a rule fails to run close to its scheduled time, some alerts may be missing. There are a number of ways to try to resolve this issue:
You can also use Task Manager in Kibana to troubleshoot background tasks and processes that may be related to missing alerts:
Troubleshoot gaps
editIf you see values in the Gaps column in the Rule Monitoring table or on the Rule details page for a small number of rules, you can increase those rules' Additional look-back time (Detect → Rules → the rule’s All actions menu (…) → Edit rule settings → Schedule → Additional look-back time).
It’s recommended to set the Additional look-back time to at
least 1 minute. This ensures there are no missing alerts when a rule doesn’t
run exactly at its scheduled time.
Elastic Security prevents duplication. Any duplicate alerts that are discovered during the
Additional look-back time are not created.
If the rule that experiences gaps is an indicator match rule, see how to tune indicator match rules. Also please note that Elastic Security provides limited support for indicator match rules.
If you see gaps for numerous rules:
- If you restarted Kibana when many rules were activated, try deactivating them and then reactivating them in small batches at staggered intervals. This ensures Kibana does not attempt to run all the rules at the same time.
- Consider adding another Kibana instance to your environment.
Troubleshoot ingestion pipeline delay
editEven if your rule runs at its scheduled time, there might still be missing alerts if your ingestion pipeline delay is greater than your rule interval + additional look-back time. Prebuilt rules have a minimum interval + additional look-back time of 6 minutes in Elastic Stack version >=7.11.0. To avoid missed alerts for prebuilt rules, use caution to ensure that ingestion pipeline delays remain below 6 minutes.
In addition, use caution when creating custom rule schedules to ensure that the specified interval + additional look-back time is greater than your deployment’s ingestion pipeline delay.
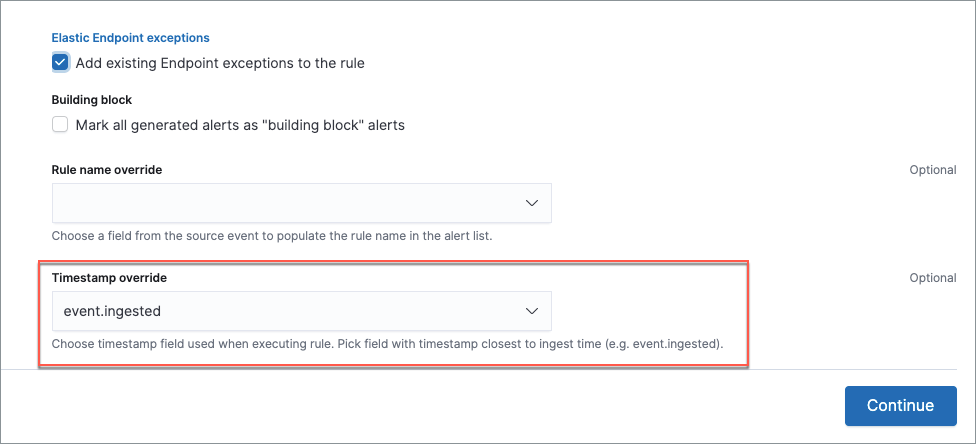
You can reduce the number of missed alerts due to ingestion pipeline delay by specifying the Timestamp override field value to event.ingested in advanced settings during rule creation or editing. The detection engine uses the value from the event.ingested field as the timestamp when executing the rule.
For example, say an event occurred at 10:00 but wasn’t ingested into Elasticsearch until 10:10 due to an ingestion pipeline delay. If you created a rule to detect that event with an interval + additional look-back time of 6 minutes, and the rule executes at 10:12, it would still detect the event because the event.ingested timestamp was from 10:10, only 2 minutes before the rule executed and well within the rule’s 6-minute interval + additional look-back time.
Troubleshoot missing alerts for machine learning jobs
editThe prebuilt machine learning jobs have dependencies on data fields that are populated by Beats and Elastic Agent integrations. In version 7.11, new machine learning jobs (Security: Linux and Security: Windows) were provided, which operate on newer ECS fields than the previous Security: Winlogbeat and Security: Auditbeat jobs. However, the prebuilt rules were not updated to use the new machine learning jobs.
Therefore:
- If you have only 7.10 or earlier versions of Beats, you can continue using the Security:Auditbeat and Security:Winlogbeat machine learning jobs and the prebuilt machine learning rules that have been in the Elastic Security app since version 7.5.
- If you have only 7.11 or later versions of Beats, use the Security:Linux and Security:Windows machine learning jobs. If you want to generate alerts for anomalies in these jobs, make clones of the existing machine learning rules and update them to use the new jobs.
- If you have a mix of old and new versions of Beats or you have a mix of Beats and Elastic Endpoint integrations, use both the old and new machine learning jobs. If you want alerts for anomalies in the new jobs, make clones of the existing machine learning rules and update them to use the new jobs.
- If you have a non-Elastic data shipper that gathers ECS-compatible Windows events, use the Security:Windows machine learning jobs. If you want alerts for anomalies in these jobs, make clones of the existing machine learning rules and update them to use these jobs.
If you are cloning prebuilt machine learning rules to generate alerts for the new machine learning jobs, the following rules are affected:
-
Unusual Linux Network Port Activity: Use
v2_linux_anomalous_network_port_activity_ecsinstead oflinux_anomalous_network_port_activity_ecs. -
Anomalous Process For a Linux Population: Use
v2_linux_anomalous_process_all_hosts_ecsinstead oflinux_anomalous_process_all_hosts_ecs. -
Unusual Linux Username: Use
v2_linux_anomalous_user_name_ecsinstead oflinux_anomalous_user_name_ecs. -
Unusual Linux Process Calling the Metadata Service: Use
v2_linux_rare_metadata_processinstead oflinux_rare_metadata_process. -
Unusual Linux User Calling the Metadata Service: Use
v2_linux_rare_metadata_userinstead oflinux_rare_metadata_user. -
Unusual Process For a Linux Host: Use
v2_rare_process_by_host_linux_ecsinstead ofrare_process_by_host_linux_ecs. -
Unusual Process For a Windows Host: Use
v2_rare_process_by_host_windows_ecsinstead ofrare_process_by_host_windows_ecs. -
Unusual Windows Network Activity: Use
v2_windows_anomalous_network_activity_ecsinstead ofwindows_anomalous_network_activity_ecs. -
Unusual Windows Path Activity: Use
v2_windows_anomalous_path_activity_ecsinstead ofwindows_anomalous_path_activity_ecs. -
Anomalous Windows Process Creation: Use
v2_windows_anomalous_process_creationinstead ofwindows_anomalous_process_creation. -
Anomalous Process For a Windows Population: Use
v2_windows_anomalous_process_all_hosts_ecsinstead ofwindows_anomalous_process_all_hosts_ecs. -
Unusual Windows Username: Use
v2_windows_anomalous_user_name_ecsinstead ofwindows_anomalous_user_name_ecs. -
Unusual Windows Process Calling the Metadata Service: Use
v2_windows_rare_metadata_processinstead ofwindows_rare_metadata_process. -
Unusual Windows User Calling the Metadata Service: Use
v2_windows_rare_metadata_userinstead ofwindows_rare_metadata_user.