Influencers
editInfluencers
editWhen anomalous events occur, we want to know why. To determine the cause, however, you often need a broader knowledge of the domain. If you have suspicions about which entities in your dataset are likely causing irregularities, you can identify them as influencers in your anomaly detection jobs. That is to say, influencers are fields that you suspect contain information about someone or something that influences or contributes to anomalies in your data.
Influencers can be any field in your data. If you use datafeeds, however, the field must exist in your datafeed query or aggregation; otherwise it is not included in the job analysis. If you use a query in your datafeed, there is an additional requirement: influencer fields must exist in the query results in the same hit as the detector fields. Datafeeds process data by paging through the query results; since search hits cannot span multiple indices or documents, datafeeds have the same limitation.
Influencers do not need to be fields that are specified in your anomaly detection job
detectors, though they often are. If you use aggregations in your datafeed, it is
possible to use influencers that come from different indices than the detector
fields. However, both indices must have a date field with the same name, which you
specify in the data_description.time_field property for the datafeed.
Picking an influencer is strongly recommended for the following reasons:
- It allows you to more easily assign blame for anomalies
- It simplifies and aggregates the results
If you use Kibana, the job creation wizards can suggest which fields to use as influencers. The best influencer is the person or thing that you want to blame for the anomaly. In many cases, users or client IP addresses make excellent influencers.
As a best practice, do not pick too many influencers. For example, you generally do not need more than three. If you pick many influencers, the results can be overwhelming and there is a small overhead to the analysis.
Influencer results
editThe influencer results show which entities were anomalous and when. One influencer result is written per bucket for each influencer that affects the anomalousness of the bucket. The machine learning analytics determine the impact of an influencer by performing a series of experiments that remove all data points with a specific influencer value and check whether the bucket is still anomalous. For jobs with more than one detector, influencer scores provide a powerful view of the most anomalous entities.
For example, the high_sum_total_sales anomaly detection job for the eCommerce orders
sample data uses customer_full_name.keyword and category.keyword as
influencers. You can examine the influencer results with the
get influencers API. Alternatively, you can use
the Anomaly Explorer in Kibana:
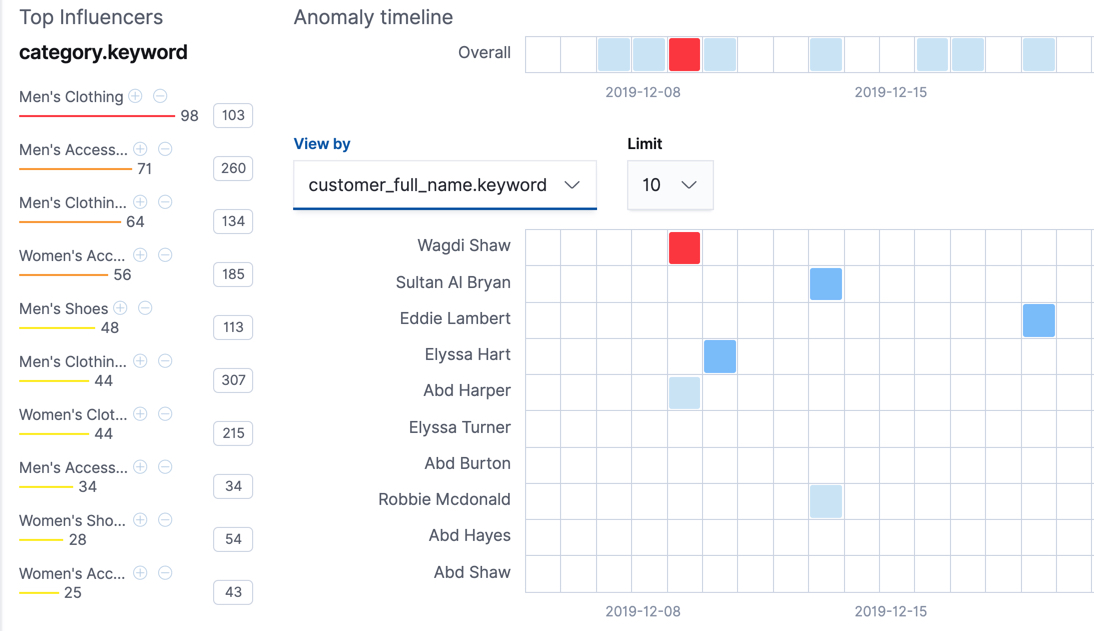
On the left is a list of the top influencers for all of the detected anomalies in that same time period. The list includes maximum anomaly scores, which in this case are aggregated for each influencer, for each bucket, across all detectors. There is also a total sum of the anomaly scores for each influencer. You can use this list to help you narrow down the contributing factors and focus on the most anomalous entities.
You can also explore swim lanes that correspond to the values of an influencer.
In this example, the swim lanes correspond to the values for the
customer_full_name.keyword. By default, the swim lanes are sorted according to
which entity has the maximum anomaly score values. You can click on the sections
in the swim lane to see details about the anomalies that occurred in that time
interval.
The anomaly scores that you see in each section of the Anomaly Explorer might differ slightly. This disparity occurs because for each anomaly detection job, there are bucket results, influencer results, and record results. Anomaly scores are generated for each type of result. The anomaly timeline in Kibana uses the bucket-level anomaly scores. If you view swim lanes by influencer, it uses the influencer-level anomaly scores, as does the list of top influencers. The list of anomalies uses the record-level anomaly scores.