Buckets
editBuckets
editThe machine learning features use the concept of a bucket to divide the time series into batches for processing.
The bucket span is part of the configuration information for an anomaly detection job. It defines the time interval that is used to summarize and model the data. This is typically between 5 minutes to 1 hour and it depends on your data characteristics. When you set the bucket span, take into account the granularity at which you want to analyze, the frequency of the input data, the typical duration of the anomalies, and the frequency at which alerting is required.
Bucket results
editWhen you view your machine learning results, each bucket has an anomaly score. This score is a statistically aggregated and normalized view of the combined anomalousness of all the record results in the bucket.
The machine learning analytics enhance the anomaly score for each bucket by considering
contiguous buckets. This extra multi-bucket analysis effectively uses a
sliding window to evaluate the events in each bucket relative to the larger
context of recent events. When you review your machine learning results, there is a
multi_bucket_impact property that indicates how strongly the final anomaly
score is influenced by multi-bucket analysis. In Kibana, anomalies with medium or
high multi-bucket impact are depicted in the Anomaly Explorer and the
Single Metric Viewer with a cross symbol instead of a dot. For example:
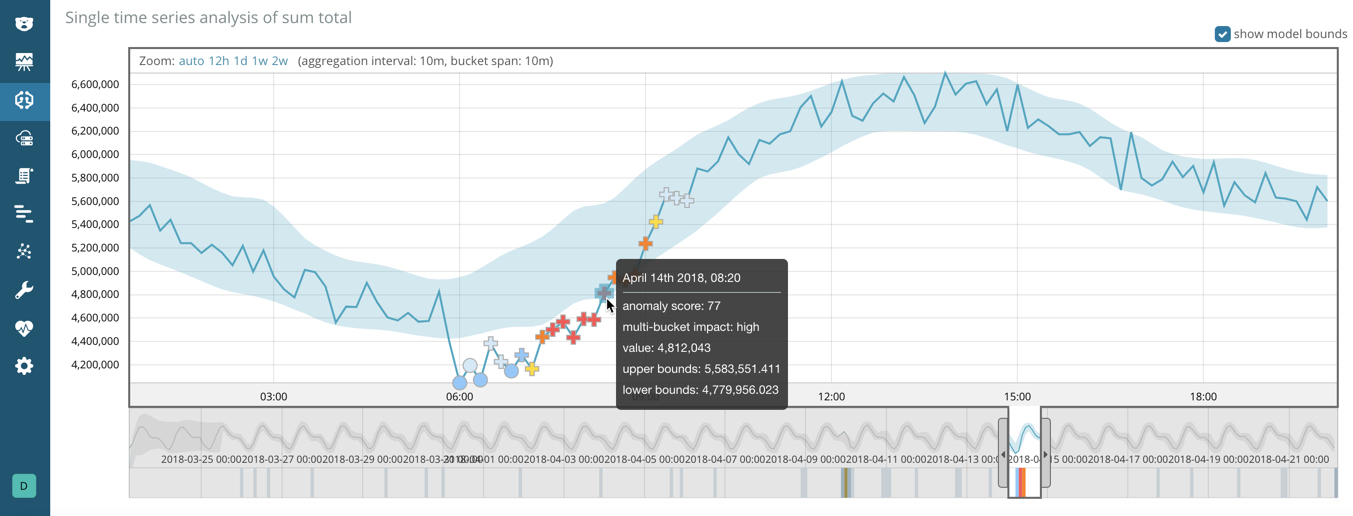
In this example, you can see that some of the anomalies fall within the shaded blue area, which represents the bounds for the expected values. The bounds are calculated per bucket, but multi-bucket analysis is not limited by that scope.
If you have more than one anomaly detection job, you can also obtain overall bucket results, which combine and correlate anomalies from multiple jobs into an overall score. When you view the results for job groups in Kibana, it provides the overall bucket scores. For more information, see Get overall buckets API.
Bucket results provide the top level, overall view of the anomaly detection job and are ideal for alerts. For example, the bucket results might indicate that at 16:05 the system was unusual. This information is a summary of all the anomalies, pinpointing when they occurred. When you identify an anomalous bucket, you can investigate further by examining the pertinent records.