Alerts
editAlerts
editThis functionality is in beta and is subject to change. The design and code is less mature than official GA features and is being provided as-is with no warranties. Beta features are not subject to the support SLA of official GA features.
The APM app integrates with Kibana’s alerting and actions feature. It provides a set of built-in actions and APM specific threshold alerts for you to use and enables central management of all alerts from Kibana Management.
For a walkthrough of the alert flyout panel, including detailed information on each configurable property, see Kibana’s defining alerts.
The APM app supports two different types of threshold alerts: transaction duration, and error rate. Below, we’ll create one of each.
Create a transaction duration alert
editTransaction duration alerts trigger when the duration of a specific transaction type in a service exceeds a defined threshold.
This guide will create an alert for the opbeans-java service based on the following criteria:
- Environment: Production
-
Transaction type:
transaction.type:request -
Average request is above
1500msfor the last 5 minutes - Check every 10 minutes, and repeat the alert every 30 minutes
- Send the alert via Slack
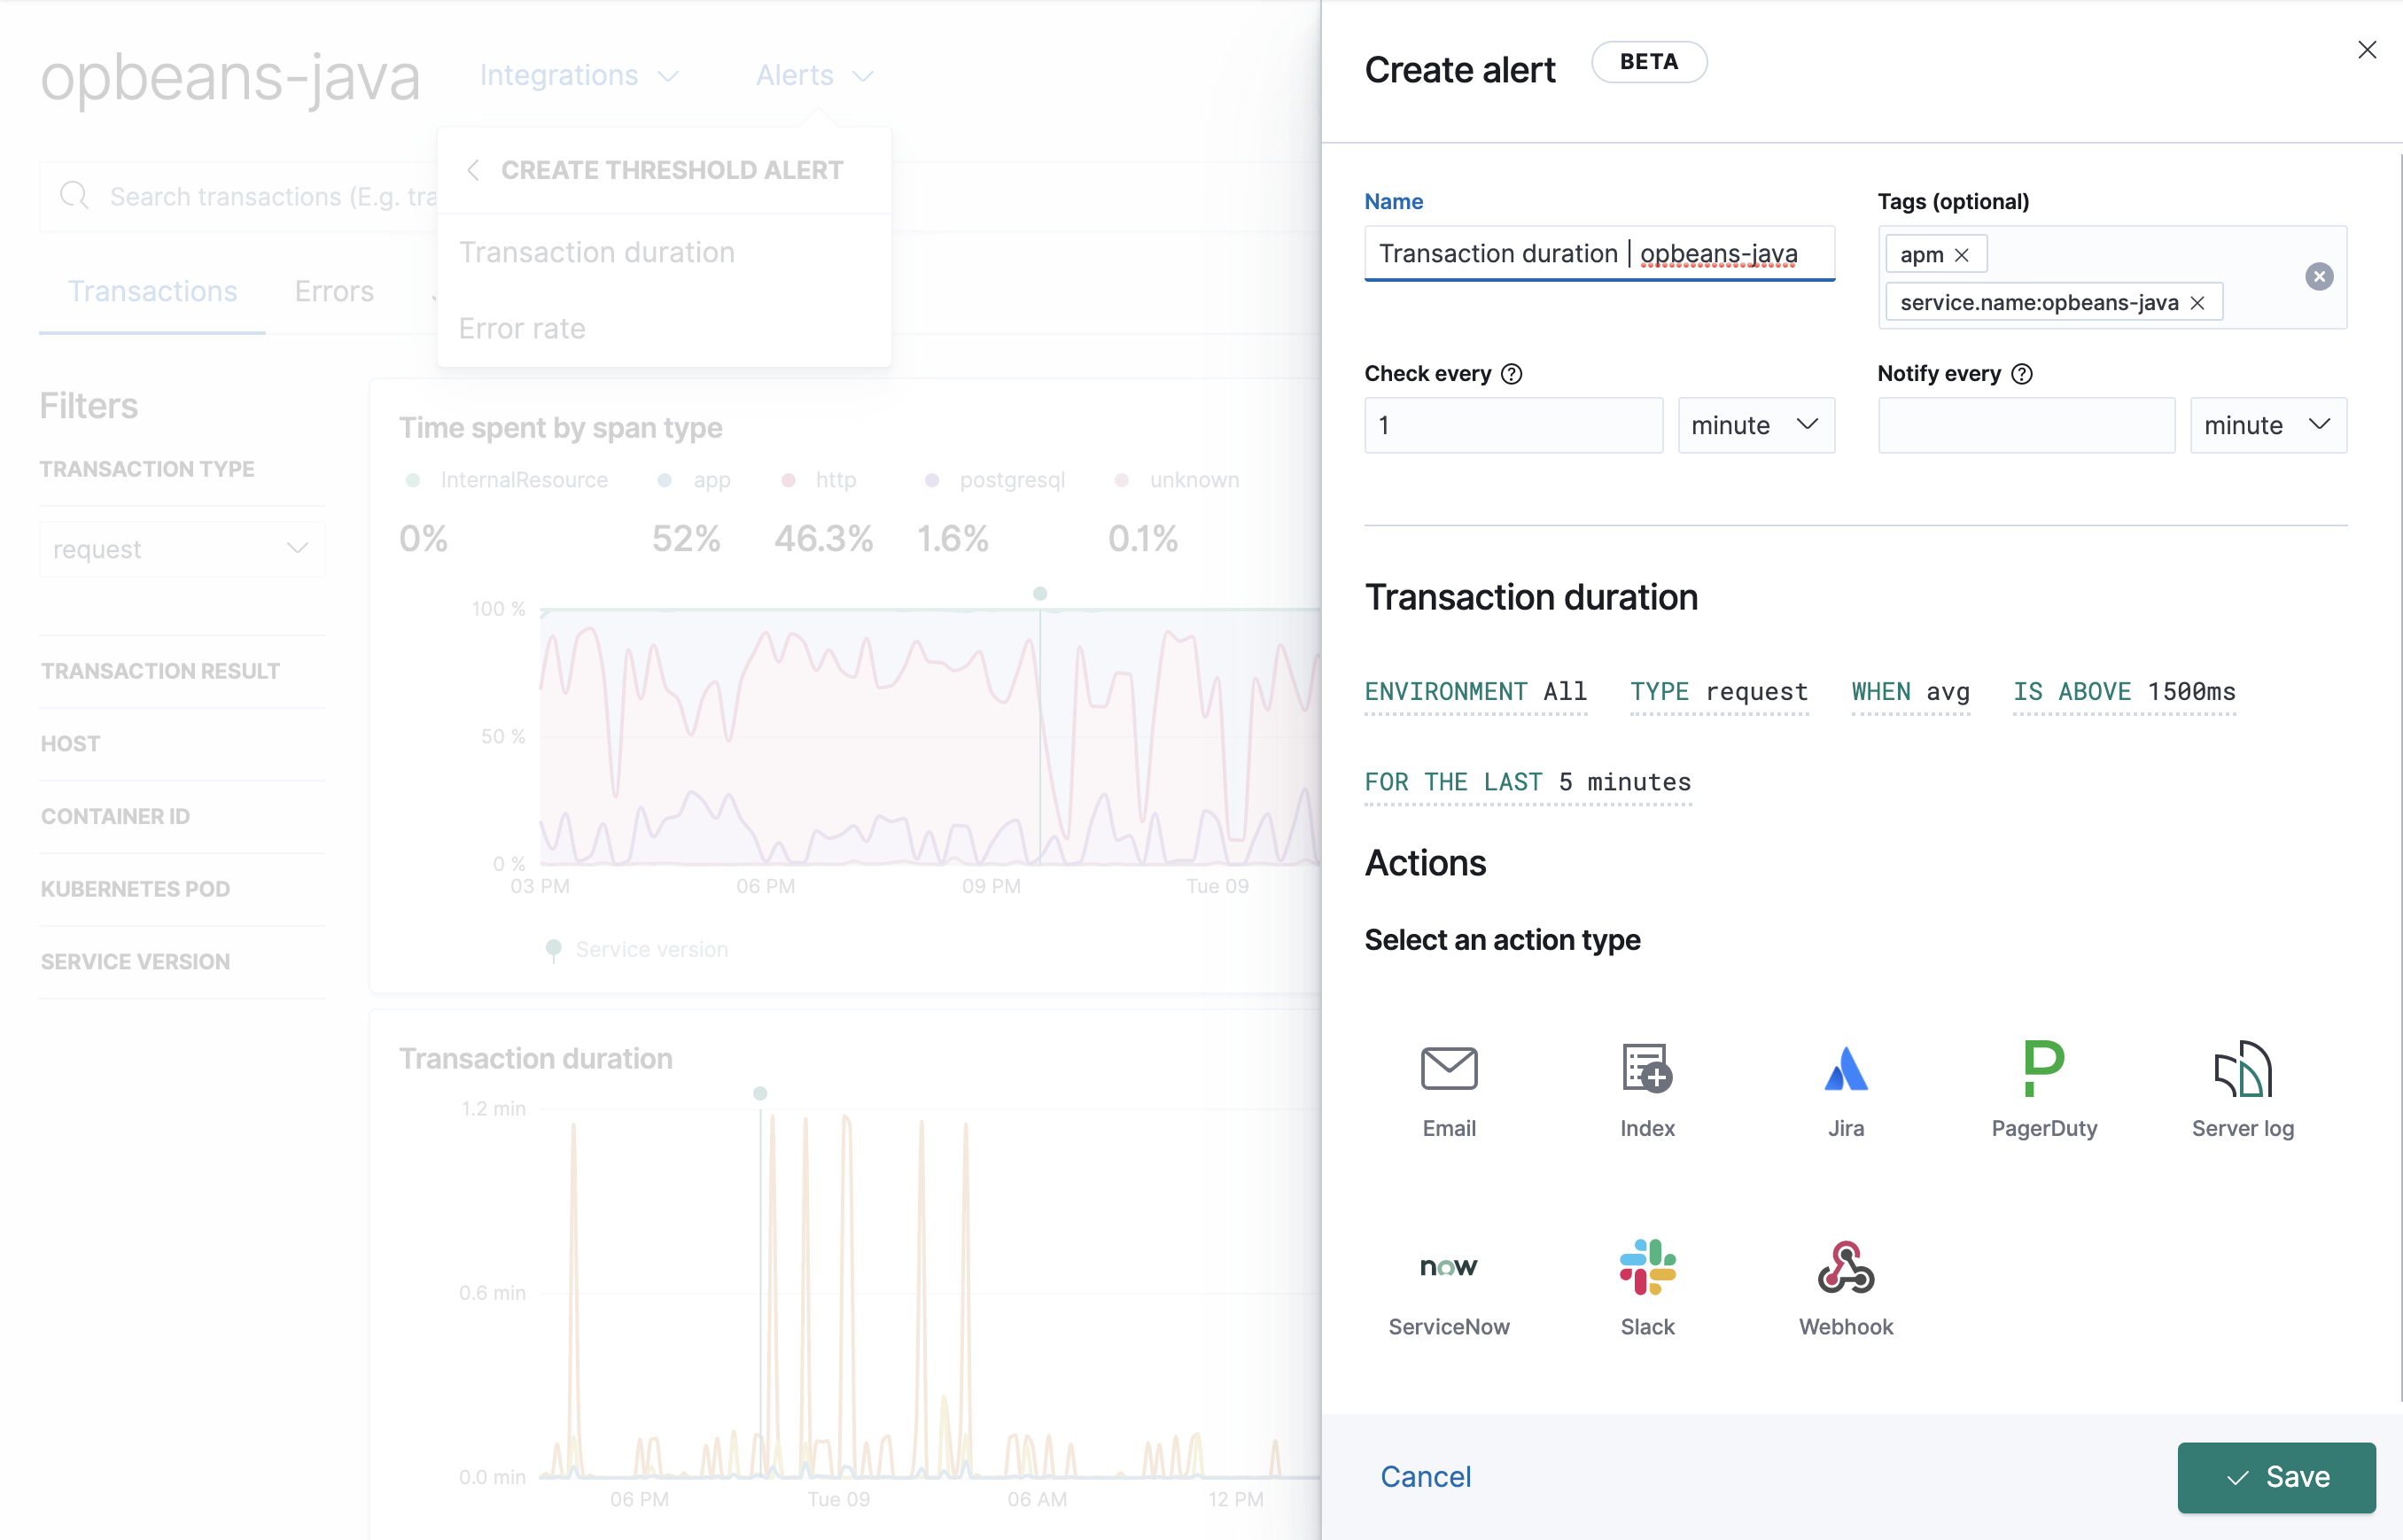
From the APM app, navigate to the opbeans-java service and select
Alerts > Create threshold alert > Transaction duration.
Transaction duration | opbeans-java is automatically set as the name of the alert,
and apm and service.name:opbeans-java are added as tags.
It’s fine to change the name of the alert, but do not edit the tags.
Based on the alert criteria, define the following alert details:
-
Check every -
10 minutes -
Notify every -
30 minutes -
TYPE -
request -
WHEN -
avg -
IS ABOVE -
1500ms -
FOR THE LAST -
5 minutes
Select an action type. Multiple action types can be selected, but in this example, we want to post to a Slack channel. Select Slack > Create a connector. Enter a name for the connector, and paste the webhook URL. See Slack’s webhook documentation if you need to create one.
Add a message body in markdown format.
You can use the Mustache template syntax, i.e., {{variable}}
to pass alert values at the time a condition is detected to an action.
A list of available variables can be accessed by selecting the
add variable button  .
.
Select Save. The alert has been created and is now active!
Create an error rate alert
editError rate alerts trigger when the number of errors in a service exceeds a defined threshold.
This guide creates an alert for the opbeans-python service based on the following criteria:
- Environment: Production
- Error rate is above 25 for the last minute
- Check every 1 minute, and repeat the alert every 10 minutes
-
Send the alert via email to the
opbeans-pythonteam
From the APM app, navigate to the opbeans-python service and select
Alerts > Create threshold alert > Error rate.
Error rate | opbeans-python is automatically set as the name of the alert,
and apm and service.name:opbeans-python are added as tags.
It’s fine to change the name of the alert, but do not edit the tags.
Based on the alert criteria, define the following alert details:
-
Check every -
1 minute -
Notify every -
10 minutes -
IS ABOVE -
25 errors -
FOR THE LAST -
1 minute
Select the Email action type and click Create a connector. Fill out the required details: sender, host, port, etc., and click save.
Add a message body in markdown format.
You can use the Mustache template syntax, i.e., {{variable}}
to pass alert values at the time a condition is detected to an action.
A list of available variables can be accessed by selecting the
add variable button .
Select Save. The alert has been created and is now active!
Manage alerts and actions
editFrom the APM app, select Alerts > View active alerts to be taken to the Kibana alerts and actions management page. From this page, you can create, edit, disable, mute, and delete alerts, and create, edit, and disable connectors.
More information
editSee alerting and actions for more information.
If you are using an on-premise Elastic Stack deployment with security, communication between Elasticsearch and Kibana must have TLS configured. More information is in the alerting prerequisites.