7.3.0 release highlights
edit7.3.0 release highlights
editEach release of Kibana brings new features and product improvements. Here are the highlights of the feature and user experience changes in 7.3.0.
Refer to the Kibana breaking changes and release notes for a list of bug fixes and other changes.
- Maps app is now production ready
- Kerberos authentication provider
- Snapshot phase 2: restore and delete
- CSV export from a saved search
- Canvas templates, experiences, and documentation
- KQL + autocomplete in filter aggregations
- Values inside bar charts
- Visual Builder: even better under a new name
- Observability enhancements
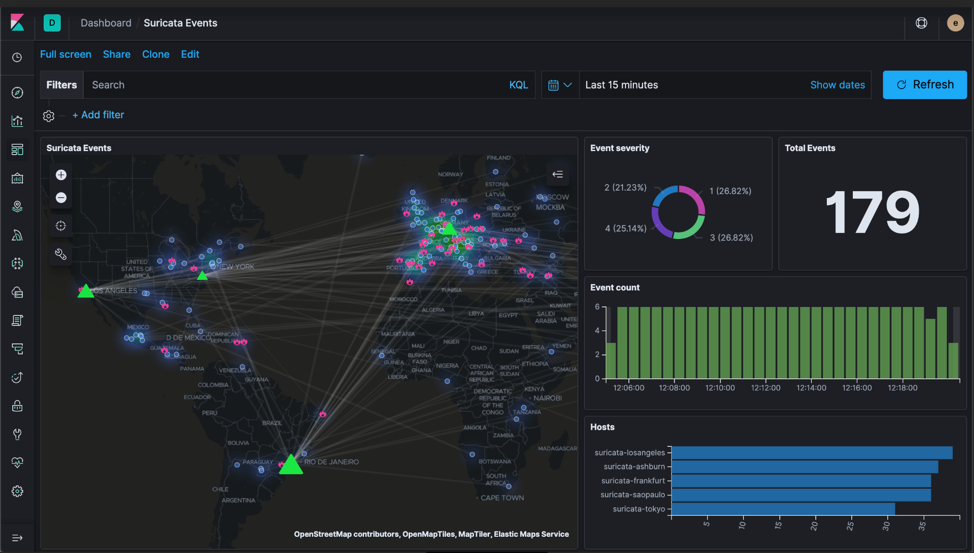
Maps app is now production ready
editMaps is production ready for 7.3, and includes many improvements, including a new GeoJson upload and improved layer styling, aggregations, and tooltips. To find out more about what’s in Maps and how to use it, check out the Maps 7.3.0 release blog and documentation.
Upload GeoJSON data (beta)
editMaps now makes it easier for you to get your geospatial data into the Elastic Stack. Use the new GeoJSON upload feature to drag and drop your point, shape files, and features directly into Elasticsearch, so you can use them as layers in the map.
More layer styling
editMaps gives you more options for styling your layers. You can now select the color ramp for heatmap layers. You can also symbolize geo_point features with icons that you can color, size, and rotate based on property values.
New top hits aggregation
editThe new top hits aggregation enables you to plot the most recent entities from your Elasticsearch indices.
Better tooltip content
editMaps now helps you create more in-depth tooltip content. Your tooltips can display information on each feature at the current location. To cycle through the features and view their properties, use the tooltip page controls. You can also include custom labels for Grid aggregation and join metrics.
Kerberos authentication provider
editElasticsearch provides support for Kerberos starting in 6.6, and in 7.3, Kibana introduces Kerberos authentication provider. You now have single sign-on access and can log into Kibana without repeatedly providing your username and password. For details, see SAML single sign-on.
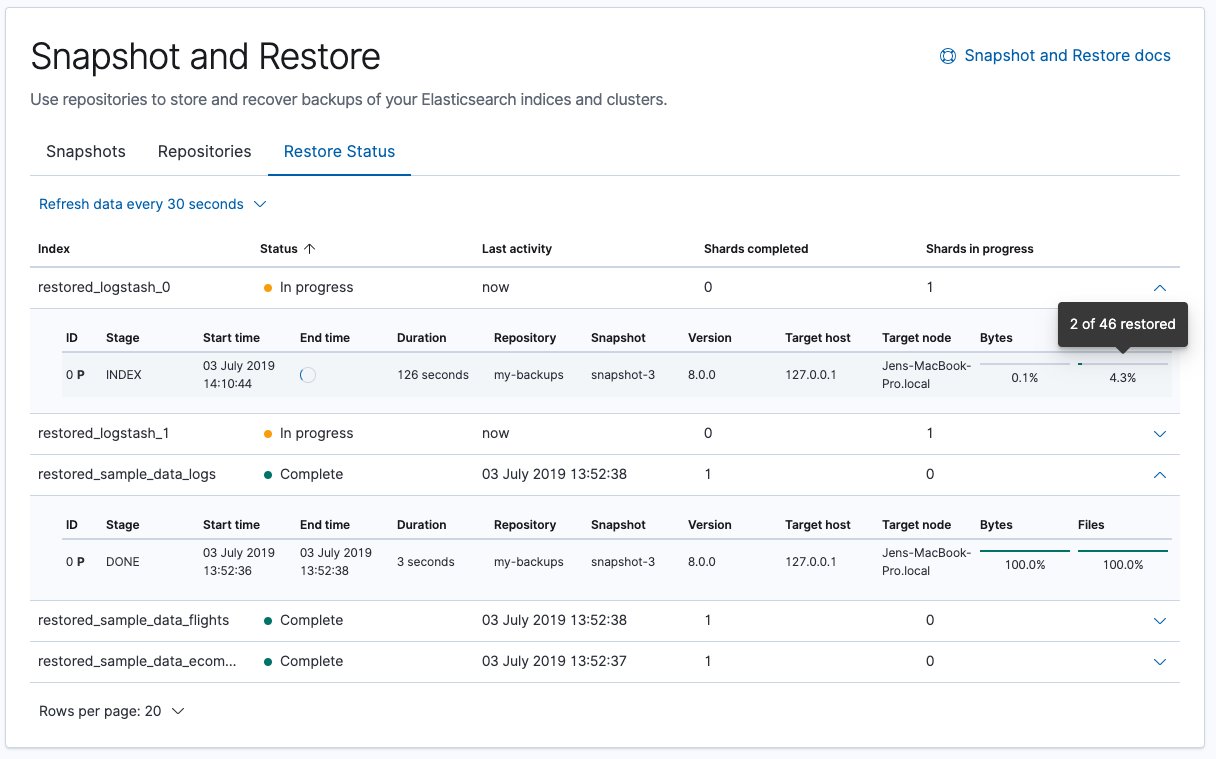
Snapshot phase 2: restore and delete
editThe second phase of the snapshot management UI is out, and includes two notable enhancements: restore and delete. You can recover data and state from a snapshot using the new Restore wizard, and track its progress in the Restore Status view. You can delete snapshots, and free up repository storage space, in the Snapshots view. For more information, see Snapshot and Restore.
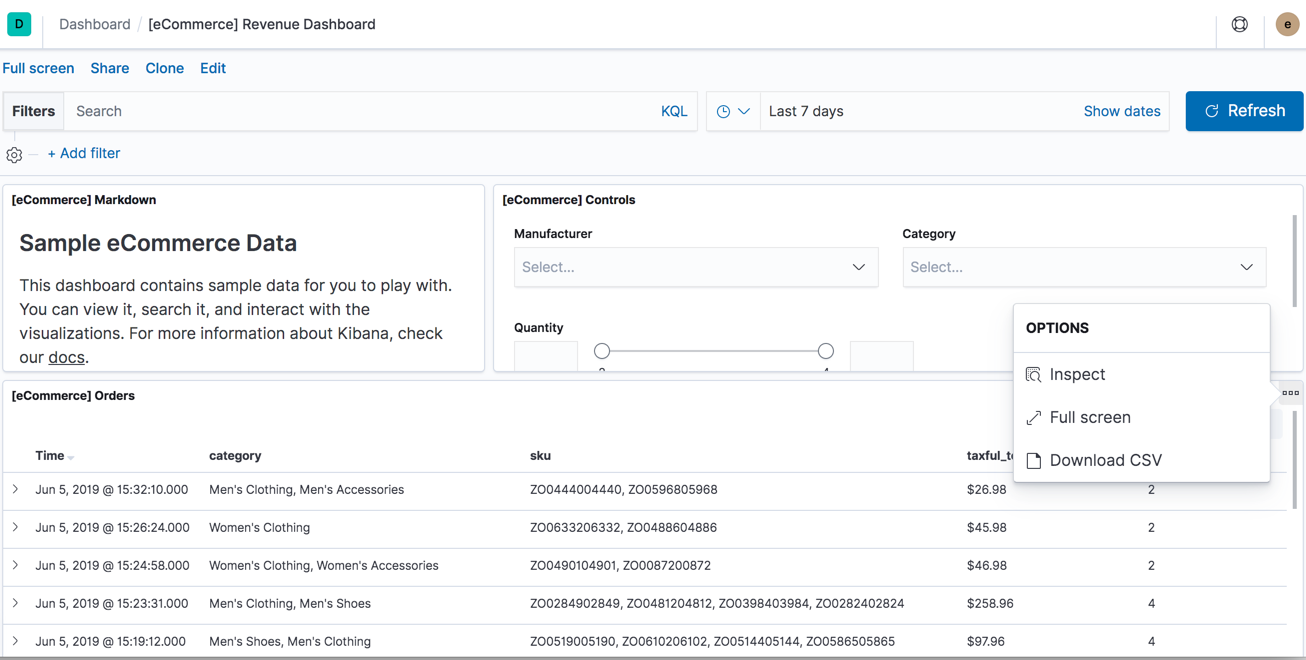
CSV export from a saved search
editKibana now allows you to export a saved search on a dashboard directly to CSV.
This action is available in the dashboard panel menu for the saved search.
To enable this feature, you must set
xpack.reporting.csv.enablePanelActionDownload: true in your kibana.yml file.
Canvas templates, experiences, and documentation
editCanvas improves the user experience with new templates, experiences, and documentation.
Templates
editCanvas is all about creating content and telling a story with your data. The content templates can help you facilitate this vision, and in 7.3, Canvas releases three new templates:
- Pitch is a 14-page template that you can brand and customize for your next board-level presentation.
- The Status template gives you a professional template for status reports and other updates.
-
The Summary template, shown below, can help you create a report with live representations of your data.
Experiences
editCanvas adds a number of experiences in 7.3: nudge, alignment, distribution, zoom, and fit-to-screen. Nudge enables you to more precisely align elements in your workpad. Use the up, down, left, or right arrow key to nudge an element by 10 pixels. To nudge an element by 1 pixel, use Shift + an arrow key.
Documentation
editCheck out the updated Getting started guide, the new introduction to Canvas workpads, and the improved Canvas function reference.
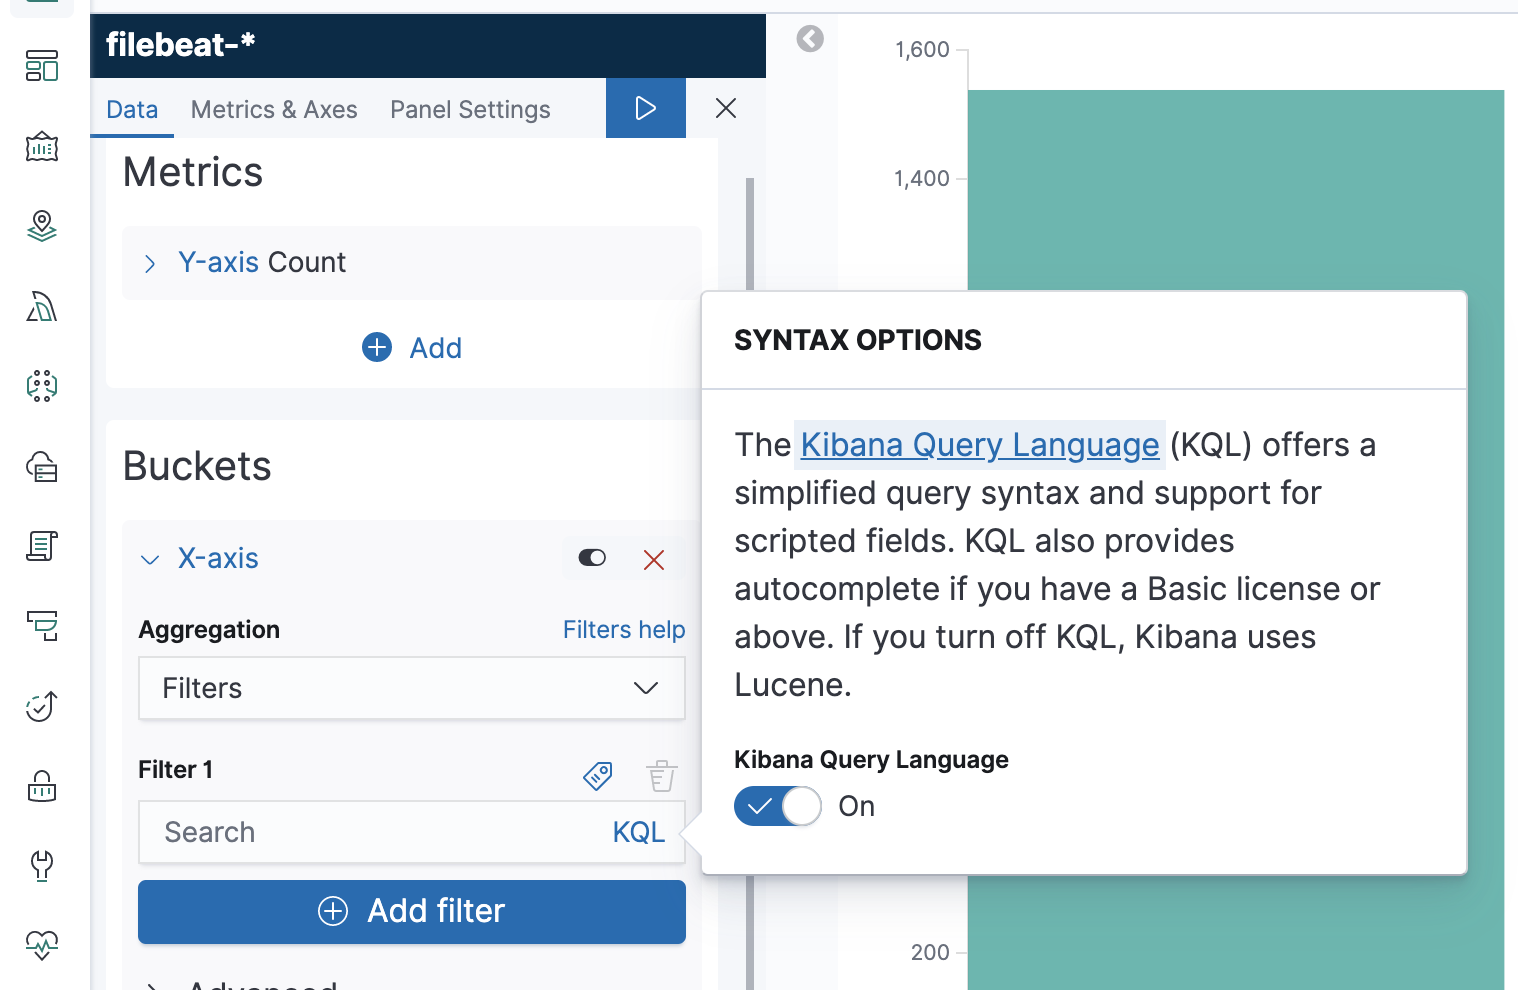
KQL + autocomplete in filter aggregations
editIn 7.0 and later, the Kibana query language (KQL) is enabled by default, making it easier to create queries. If you have a Basic license or above, autocomplete is also enabled. Starting in 7.3, Kibana expands KQL and autocomplete support to include filter aggregations in Visualize and TSVB. Just start typing, and you’ll get suggestions for fields, values for keyword fields, and query operators.
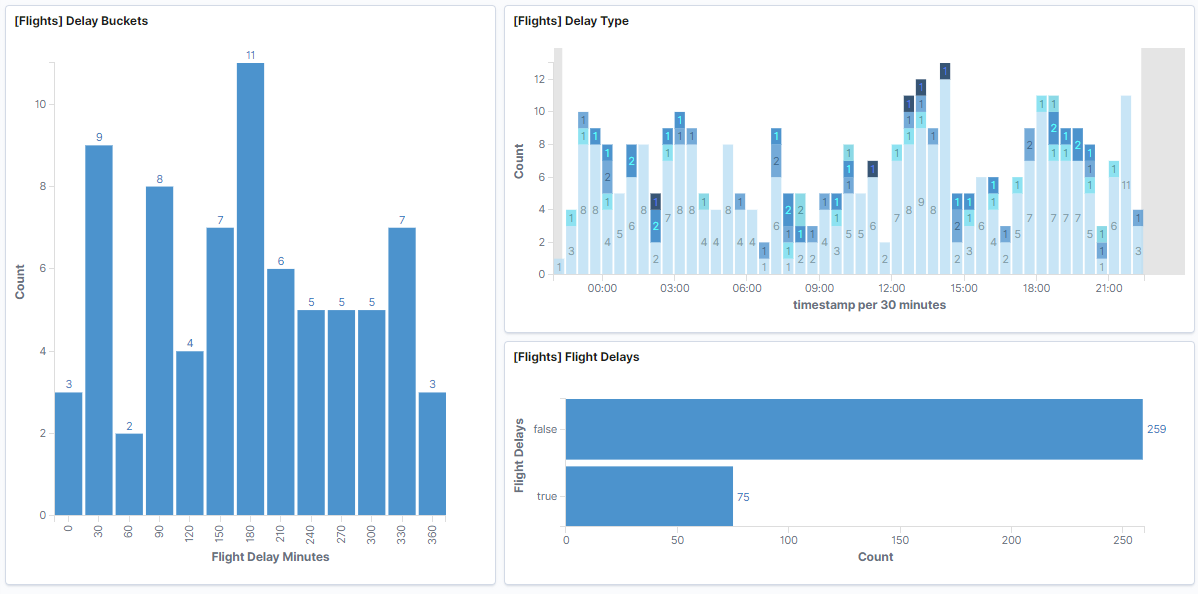
Values inside bar charts
editYou can now show values directly inside a bar chart, if space is available. When you create the bar chart, open Panel Settings and select Show values on chart.
Visual Builder: even better under a new name
editTime Series Visual Builder is now simply referred to as TSVB. When you open TSVB, you’ll also notice several enhancements and bug fixes.
Observability enhancements
editCheck out these release blogs:
Give us your feedback
editEnjoy all the new features and functionality in Kibana 7.3. Play around with them locally or on the Elasticsearch Service and reach out on the Kibana Discuss forum if you have any questions or feedback.