7.2.0 release highlights
edit7.2.0 release highlights
editEach release of Kibana brings new features and product improvements. Here are the highlights of the feature and user experience changes in 7.2.0.
Refer to the Kibana breaking changes and release notes for a list of bug fixes and other changes.
Feature controls
editWant to hide Dev Tools from the left navigation? Show Stack Monitoring only to admins? Or, give certain users access to only Dashboard and Canvas? Feature controls allow you to hide and restrict applications and features in the Kibana UI.
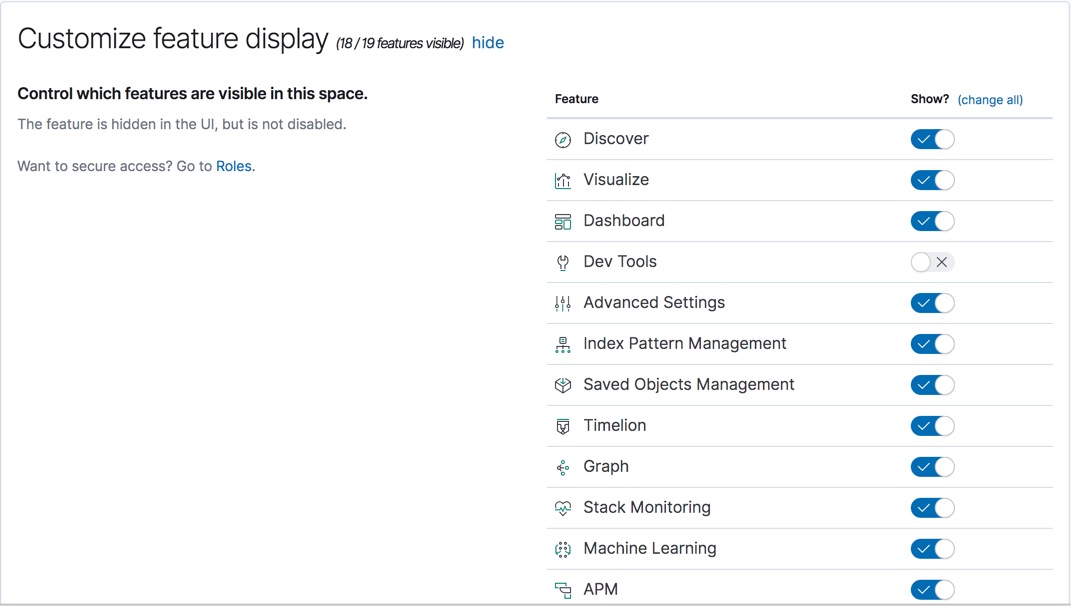
You can configure Kibana applications and features based on your users’ needs, and when used with security, based on their privileges. This means different roles can have access to different features in the same space. Power users might have privileges to create and edit visualizations and dashboards, while analysts or executives might have Dashboard and Canvas with read-only privileges.
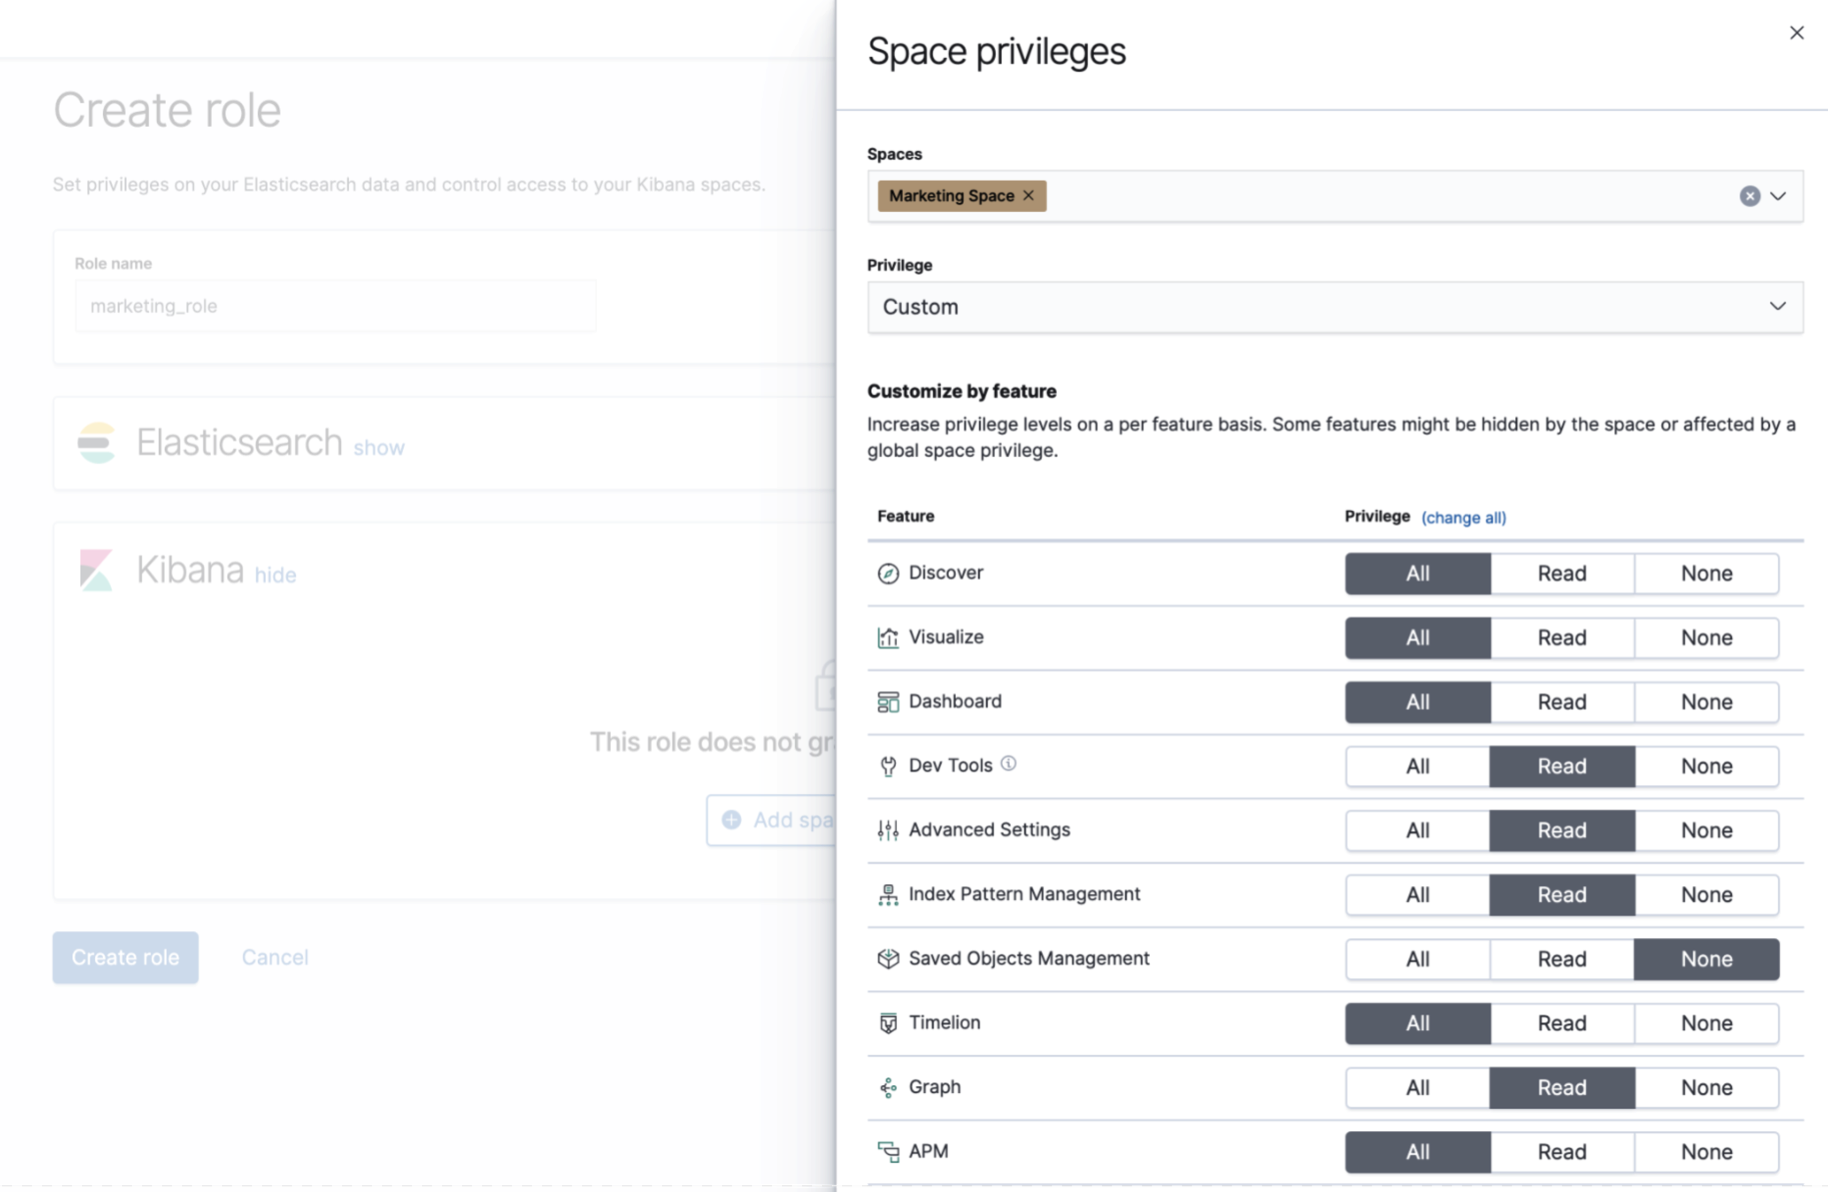
Saved Object Import and Export API
editKibana has new APIs for importing and exporting saved objects, including dashboards, visualizations, index patterns, maps, Canvas workpads, and advanced settings. A benefit of this new API is that it automatically exports the dependencies of the saved object. Just export the dashboard you need and its visualizations and index patterns are exported as well. You can use the new APIs in the Management UI, or call them directly.
Rolled up data in Time Series Visual Builder
editTime Series Visual Builder now has features for visualizing rolled up data. Similar to Visualize, you can create index patterns that use rollup indices or mix rollup and raw indices to visualize all data together. You can also create multiple y-axes with different index patterns or rollup indices in the same chart.
When you specify the index in Visual Builder, you must explicitly state the rollup name. Visual Builder will not include a rollup index if you use a wildcard. See PR #28762 for details.
Canvas enhancements
editCanvas provides enhancements to custom elements, workpad filtering, and autoplay.
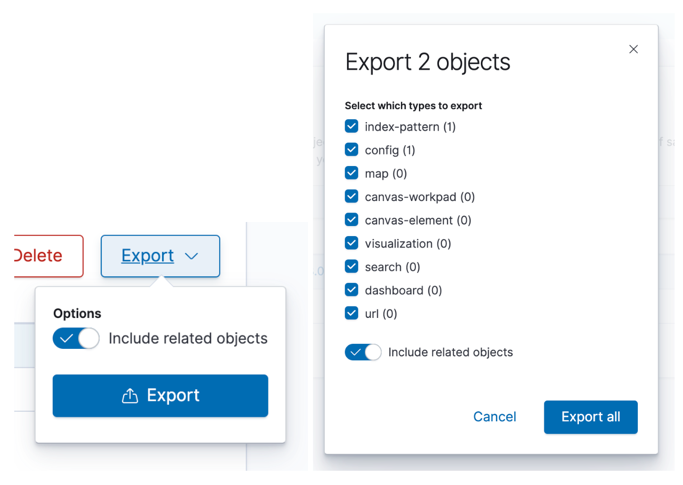
Custom elements
editElements, such as charts, metrics, shapes, and images, are the building blocks of a Canvas workpad. You can combine these elements to create new and interesting presentations of your data. Your custom element might be as simple as a metric on top of a geometric shape. Or, you might create a more complex grouping backed by queries and conditional statements.
With 7.2, you can save custom elements for reuse across your workpads. This reduces the need for copy and paste. It also enables you to share your custom elements with your teammates.
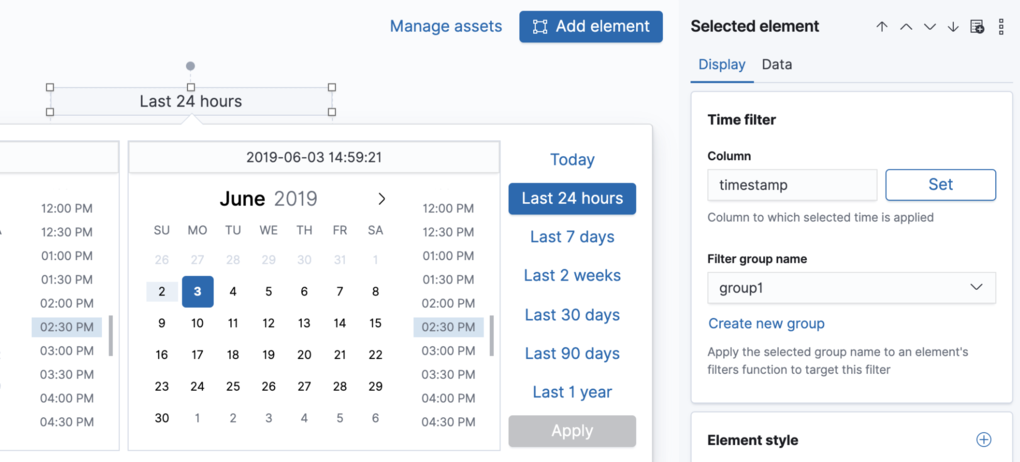
Filter groups
editIf you’ve used the time or dropdown filter elements in Canvas, you know that they apply to the entire workpad (and not just the page they are in). This behavior is still the default, but you can now choose which elements are affected by specific filters. This gives you more options for exploring data visualizations.
Autoplay
editAs part of the ongoing work to provide kiosk mode in Canvas, version 7.2 introduces the ability to autoplay your workpad pages. Once enabled, full screen mode automatically cycles through your workpad pages based on the time interval you define.
Snapshot repositories
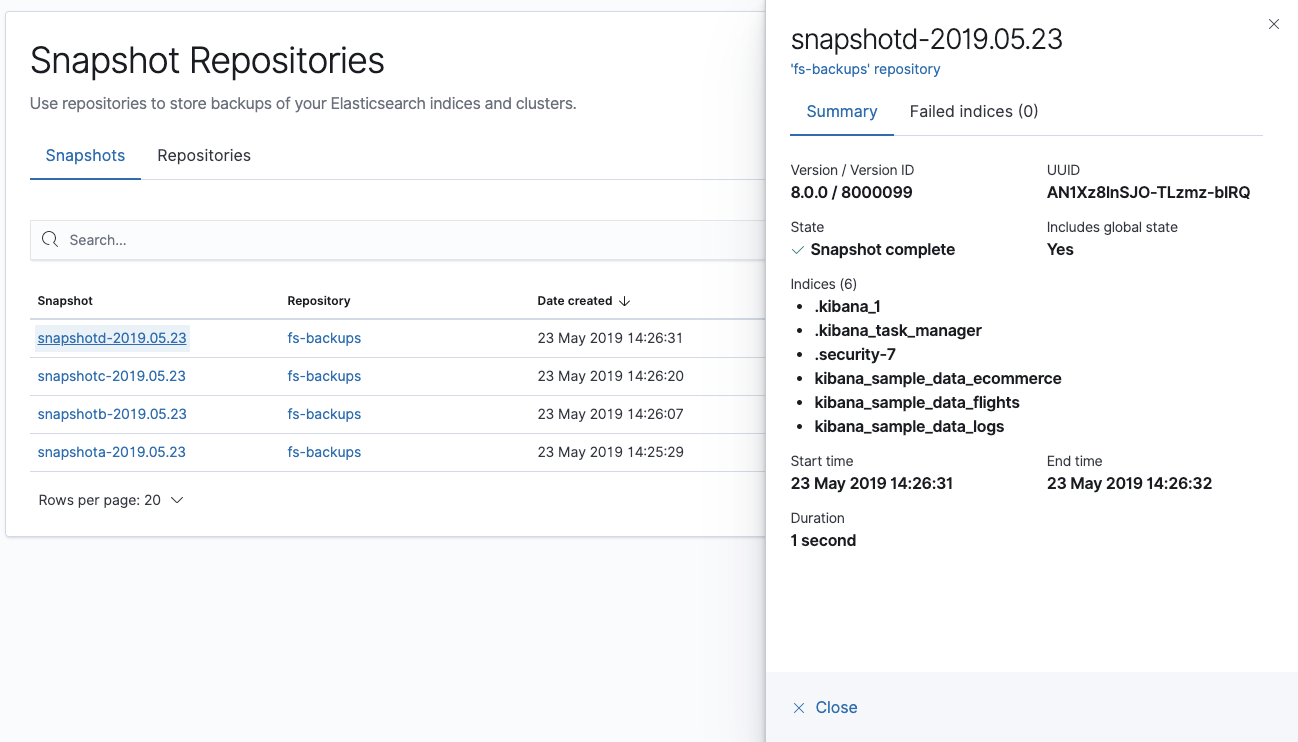
editThis release introduces phase one of the Kibana Snapshot UI for managing backups of your Elasticsearch indices and clusters. Snapshots are important because they provide a copy of your data in case something goes wrong. If you need to roll back to an older version of your data, you can restore a snapshot from the repository.
Use the Snapshot UI to register new repositories, edit existing ones, and drill down into details about your repositories and snapshots. See Snapshot repositories for step-by-step instructions. Additional snapshot and recovery features are planned for upcoming versions.
Maps in dashboards and other improvements
edit[beta] This functionality is in beta and is subject to change. The design and code is less mature than official GA features and is being provided as-is with no warranties. Beta features are not subject to the support SLA of official GA features. The Maps app now adds the ability to include your saved map on a dashboard. You can view and interact with your geospatial data alongside bar charts, pie charts, and other visualizations. Click the map to quickly hone in on the data you desire, and that data is shown across the dashboard, similar to how you interact with other visualization types. See Adding a map to a dashboard for step-by-step instructions.
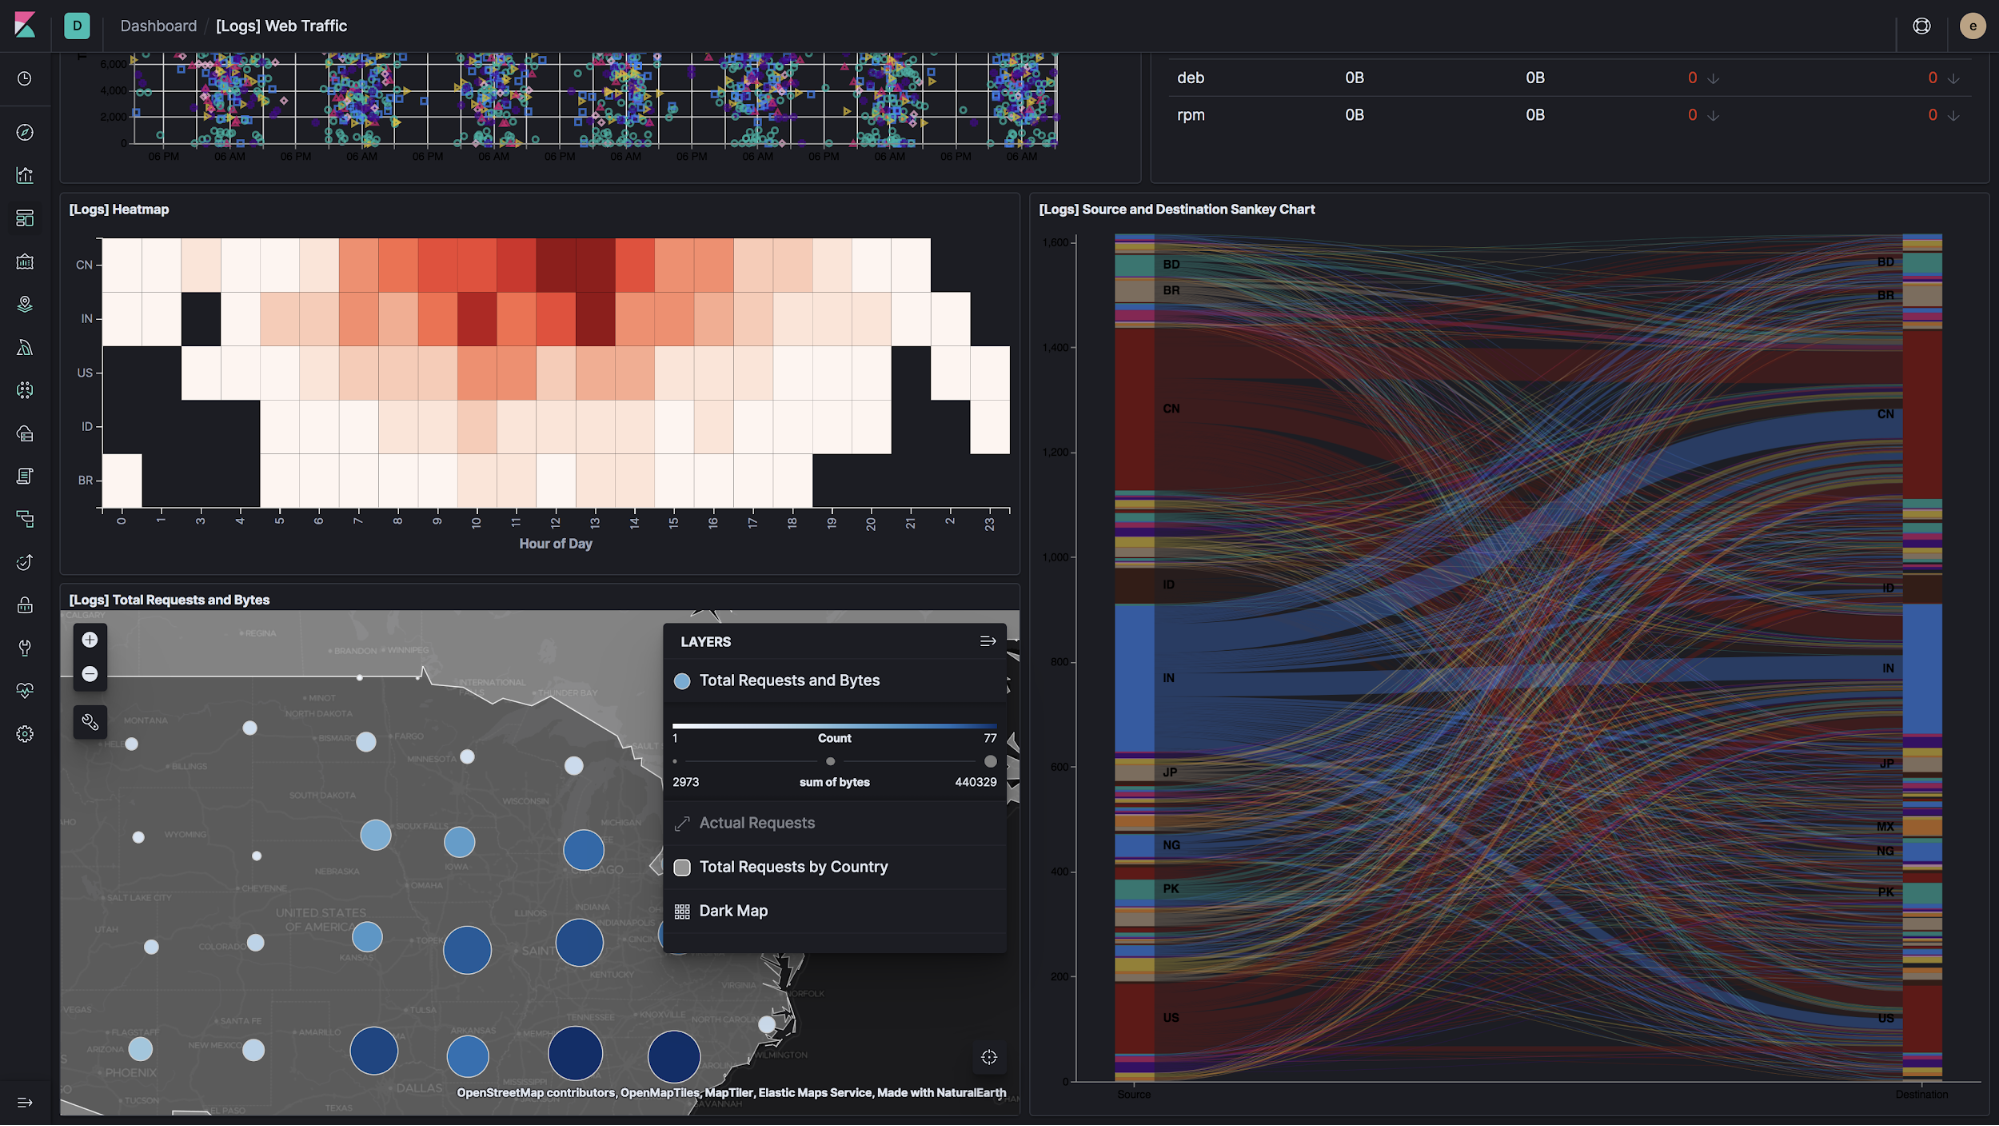
Additional improvements to the new Maps app include:
- Dark mode. Building on the support for dark mode in Kibana 7.0, the Elastic Maps Service now publishes dark themed tiles. This means that the Maps app now fully respects dark mode.
- Collapsible map legends. Use this feature to get an unobstructed view of a map in a dashboard.
- Class styling. With this style, you can symbolize map features by class. Use layer filtering to define the class for each layer, and static styling to symbolize each class. See Class styling for an example.
Kibana in Japanese
editKibana now supports Japanese, in addition to Simplified Chinese and English.
If you’d like to use Kibana with Japanese, set i18n.locale to ja-JP in your
kibana.yml file. The Japanese localization is a work in progress.
We welcome your feedback in the form of a Github issue.
You can also issue a pull request in GitHub.
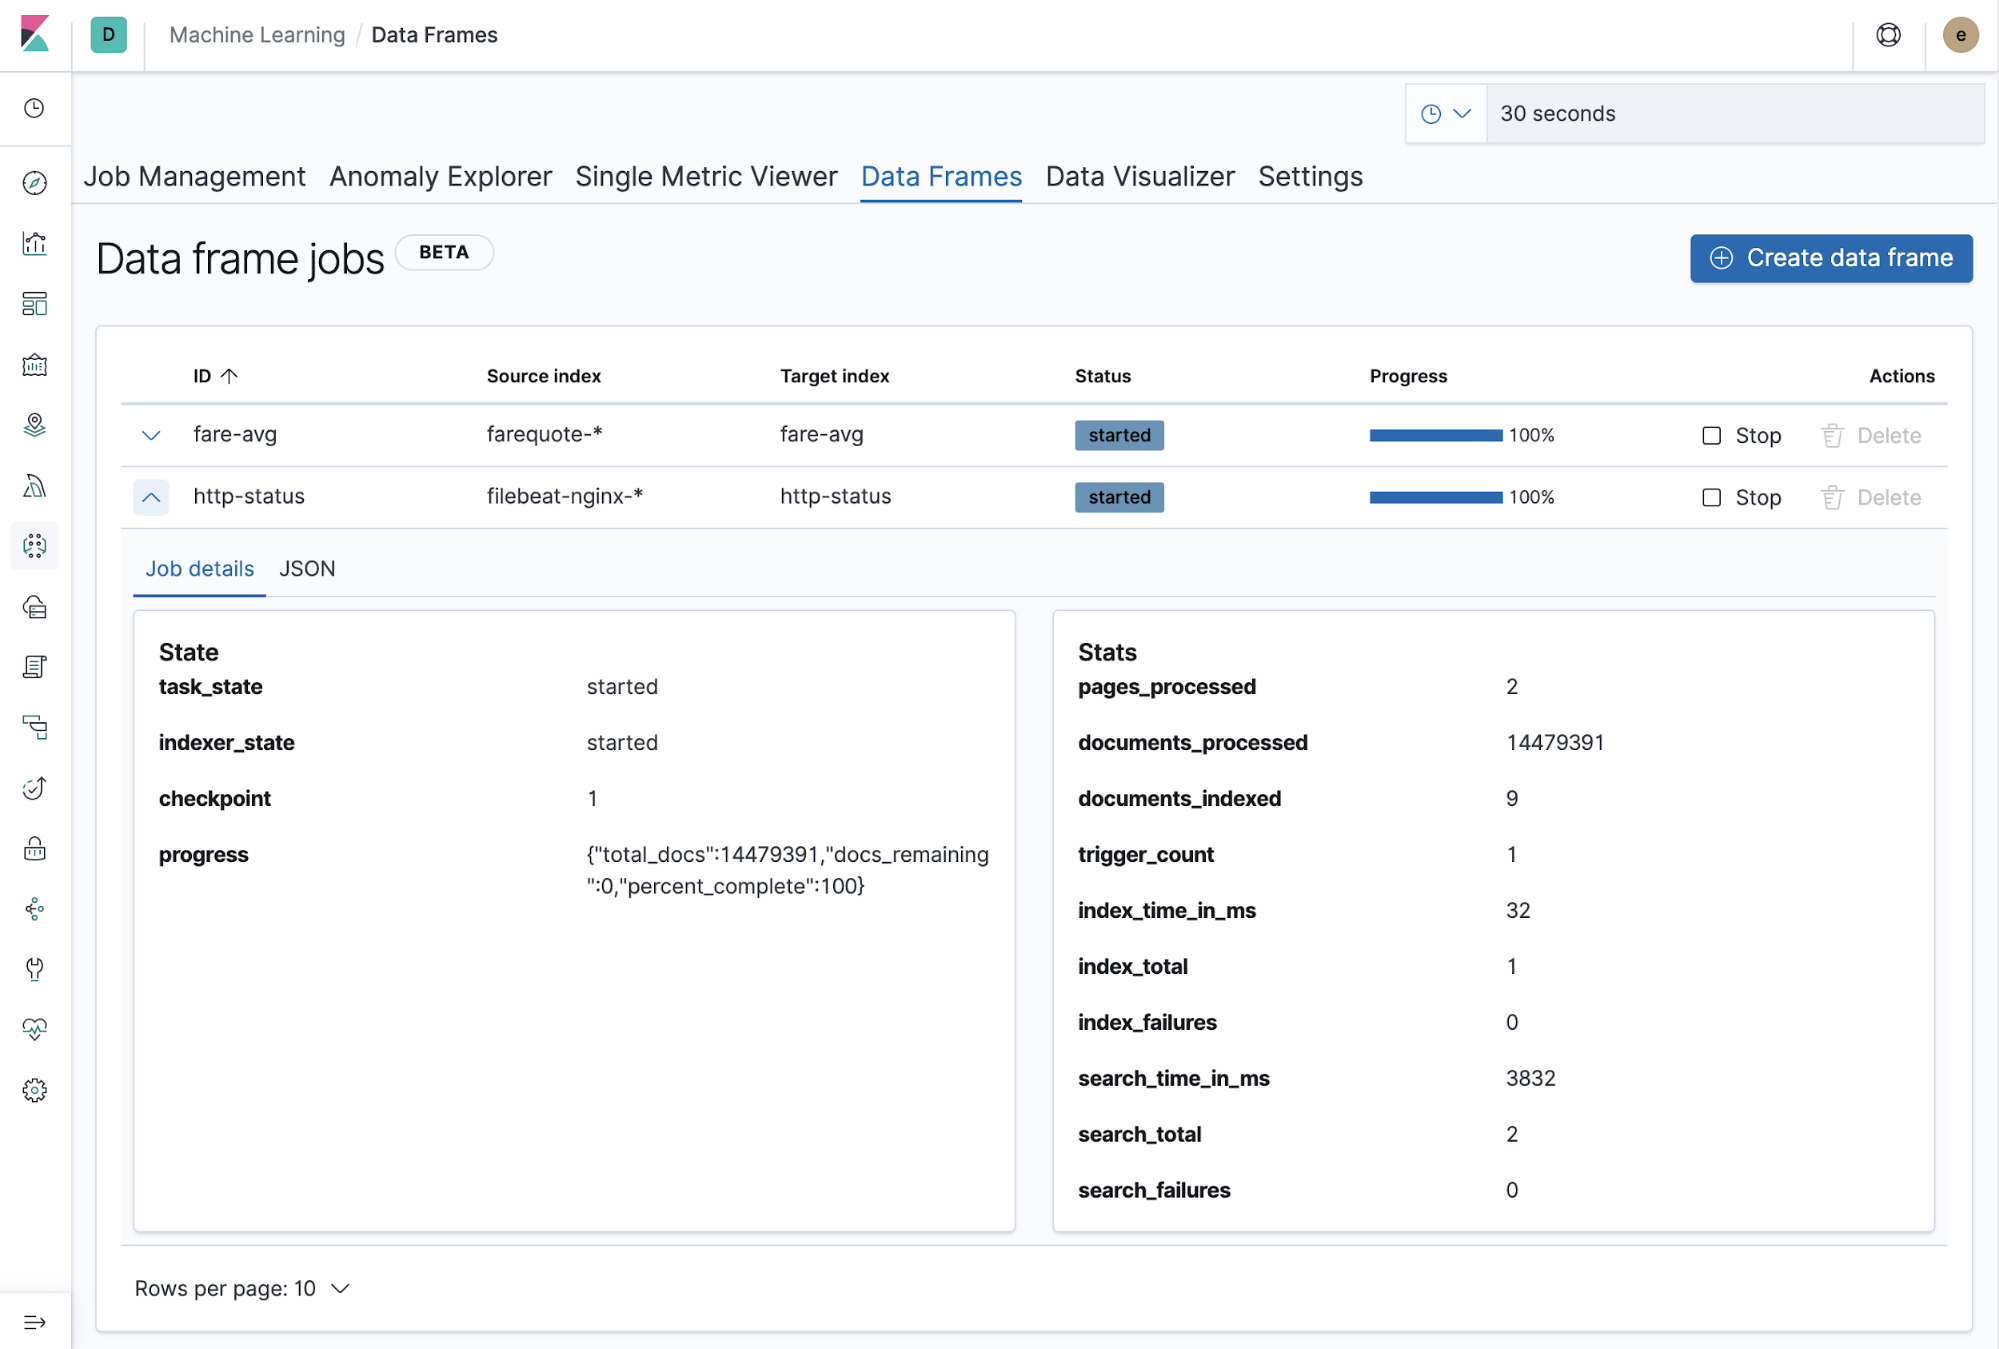
Data frames
edit[beta] This functionality is in beta and is subject to change. The design and code is less mature than official GA features and is being provided as-is with no warranties. Beta features are not subject to the support SLA of official GA features. Machine Learning now enables you to transform your data with data frames. A new wizard guides you through the process of creating a data frame: selecting the source data, the fields you want to group by, and the aggregations for pivoting the data. There is also a preview of the transform for reviewing the configuration.
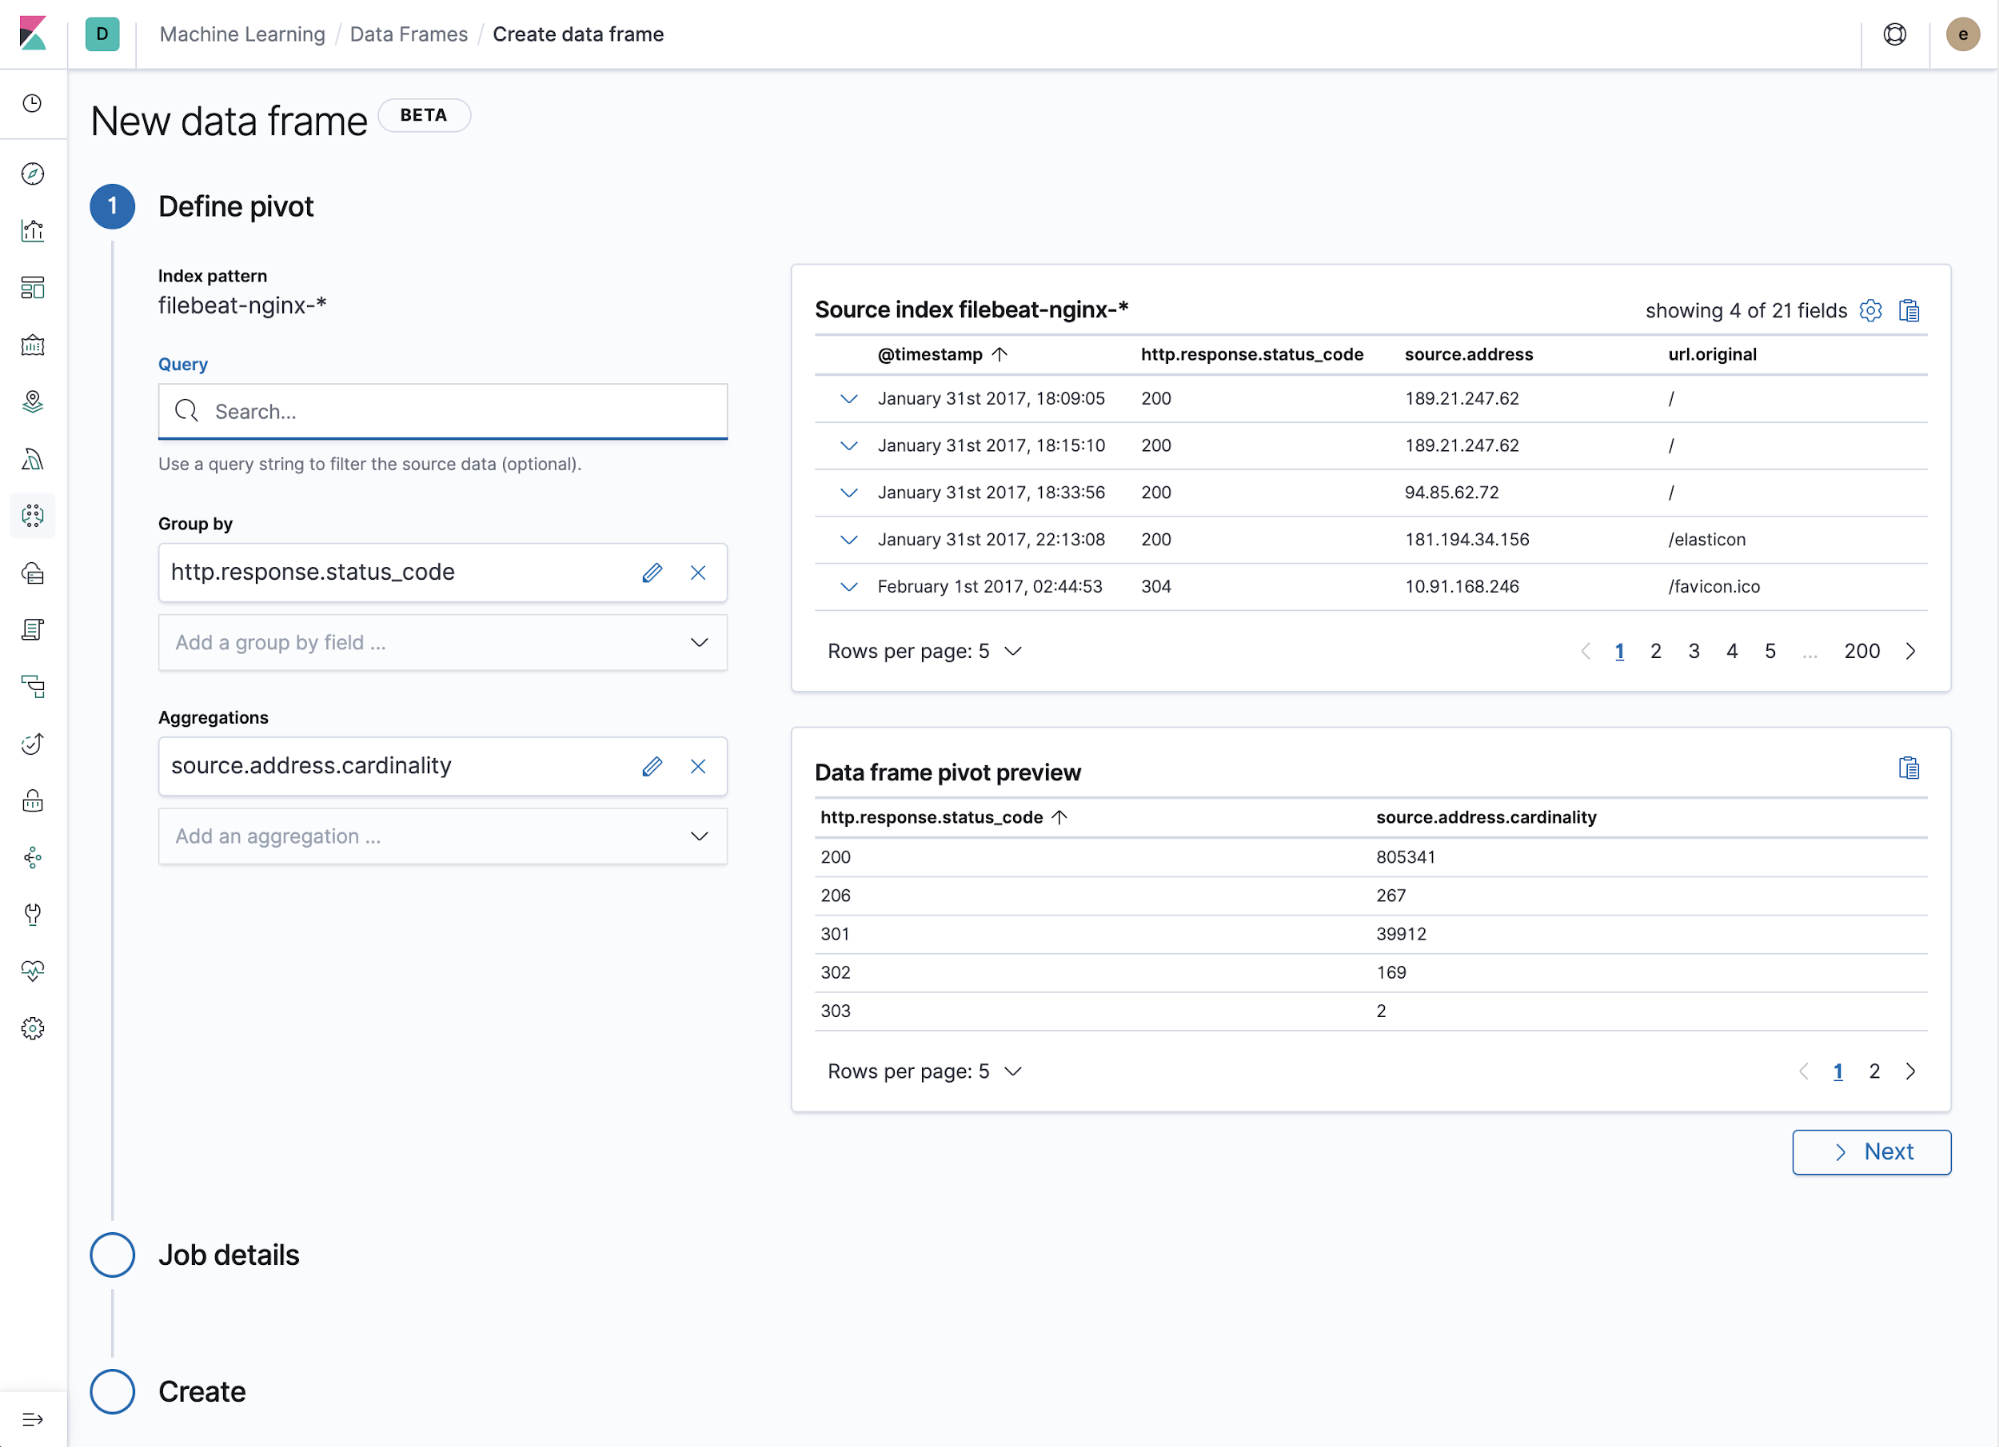
Transforms are managed on a new list page, displaying the details and status of each transform, and controls for starting, stopping, or deleting transforms.
Search for influencers in Anomaly Explorer
editA query bar is now available in the Machine Learning Anomaly Explorer, which enables you to filter anomaly results for one or more selected influencers. The query bar suggests influencer field names and values for the selected jobs as you type.
Simplified creation of machine learning jobs for sample data sets and Metricbeat data
editIf you use the Kibana sample data sets, there are now machine learning jobs for the sample eCommerce orders and the sample web logs. These jobs demonstrate a variety of ways that you can detect anomalous behavior in the sample data. You can add the jobs when you load the sample data or use the supplied configuration when you are creating jobs in the Machine Learning app.
Likewise, if you use the Metricbeat system module to monitor your servers, there is a machine learning wizard that recognizes this type of data. For example, with the supplied configuration you can detect unusual increases in disk utilization:
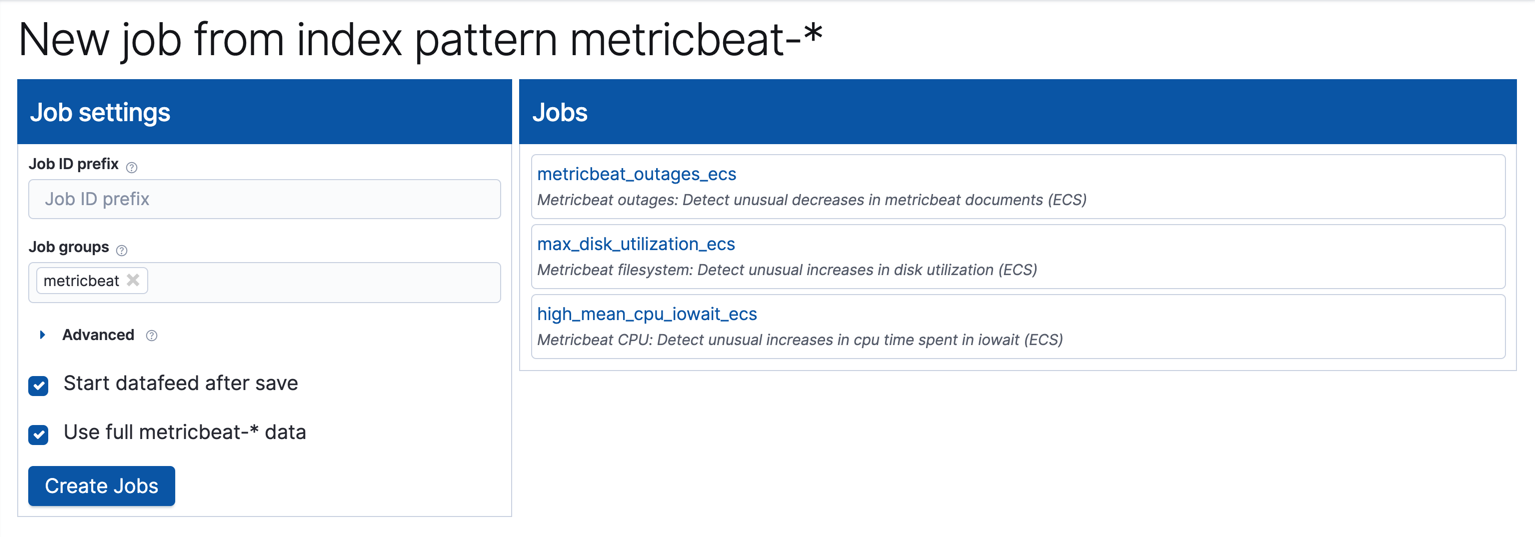
These wizards expedite the creation of pre-configured jobs, dashboards, searches, and visualizations. For more information, see Creating anomaly detection jobs.
View recent log entries alongside your monitoring data
editYou can now see your cluster’s recent log entries within the Stack Monitoring application:
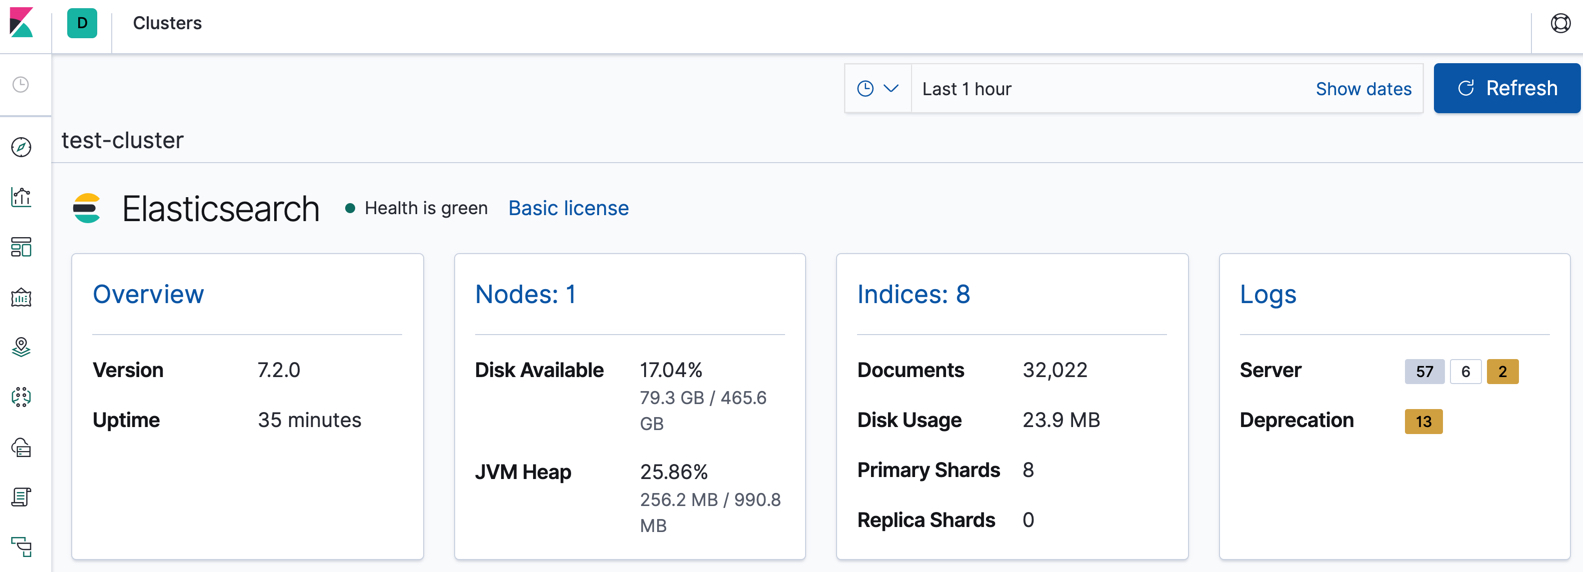
See Elasticsearch Metrics. If you want to see earlier log entries, you can follow a link to the Logs UI and continue your investigation there.
You must use Filebeat to collect the logs.
Observability
editObservability has two new notable features.
- Metrics Explorer is a new view in the Infrastructure app. Metrics Explorer enhances how you interact with infrastructure metrics in an ad hoc way.
- APM agents now collect language-specific metrics, in addition to the common key performance indicators. These new metrics are automatically displayed in the APM UI.
For more information, visit the Observability blog.
Give us your feedback
editEnjoy all the new features and functionality in Kibana 7.2. Play around with them locally or on the Elasticsearch Service and reach out on the Kibana Discuss forum if you have any questions or feedback.