Viewing infrastructure metrics
editViewing infrastructure metrics
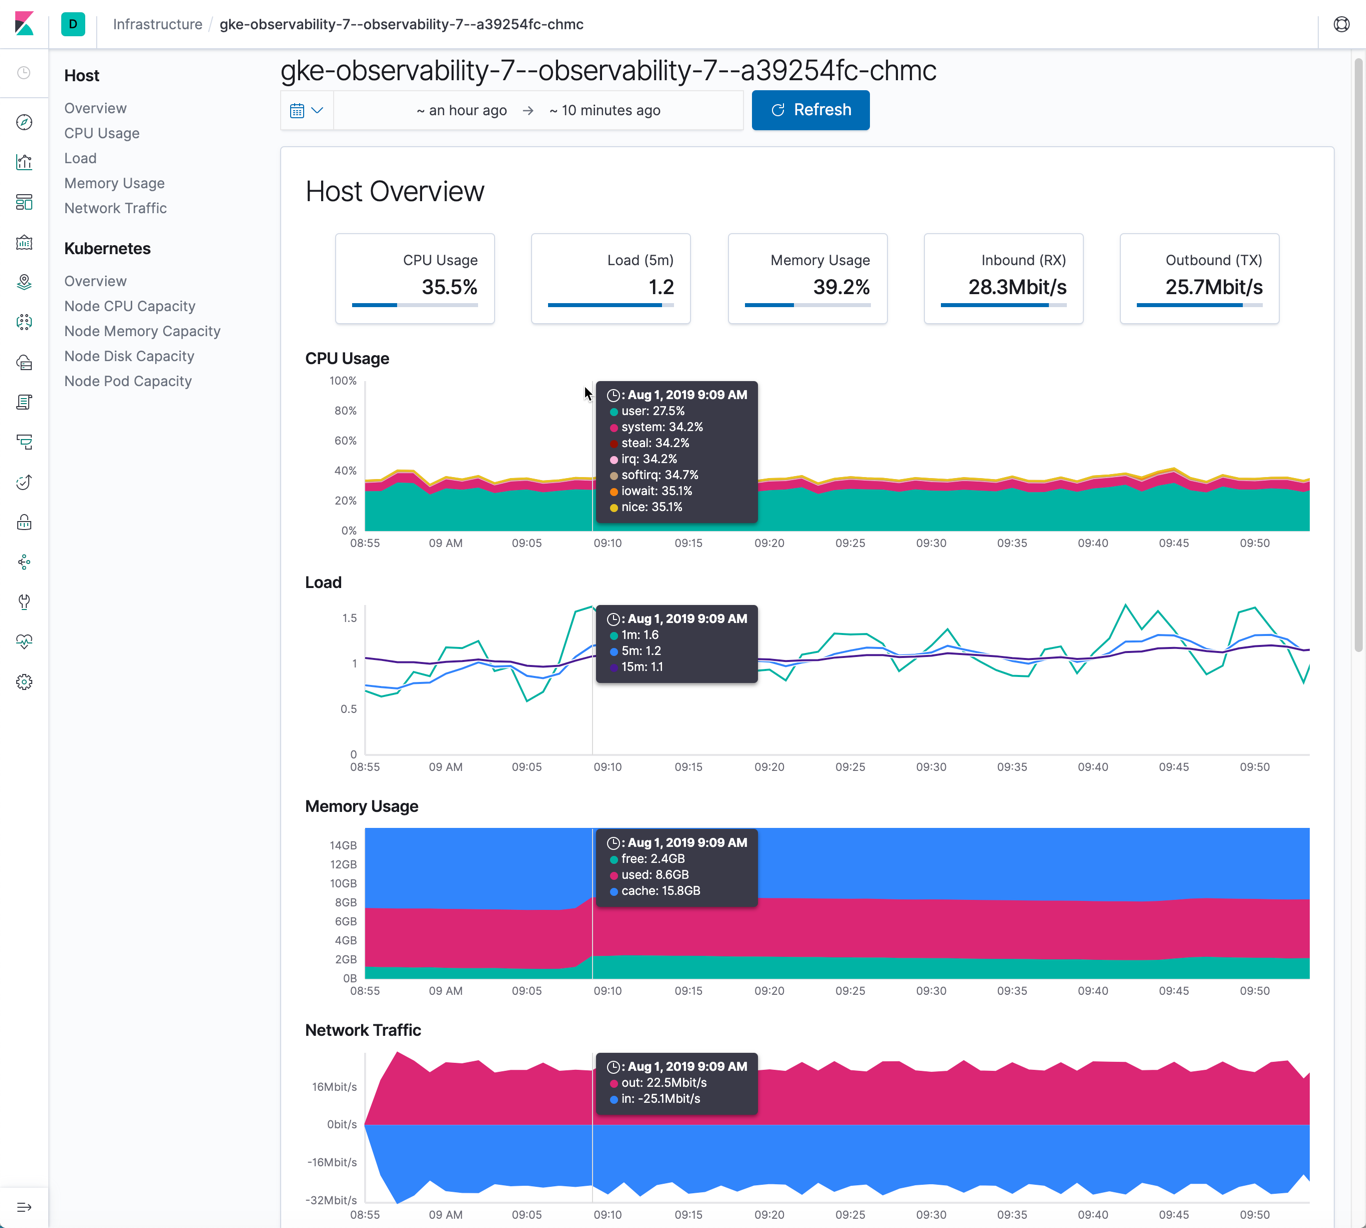
editWhen you select View Metrics for a component in your infrastructure from the Infrastructure app in Kibana, you can view detailed metrics for that component, and for any related components.
Specify the time and date range
editUse the time filter to select the time and date range for the metrics.
To quickly select some popular time range options, click the calendar dropdown  . In this popup you can choose from:
- Quick select to choose a recent time range, and use the back and forward arrows to move through the time ranges
- Commonly used to choose a time range from some commonly used options such as Last 15 minutes, Today, or Week to date
- Refresh every to specify an auto-refresh rate
When you start auto-refresh from within this dialog, the calendar dropdown changes to a clock  .
.
For complete control over the start and end times, click the start time or end time shown in the bar beside the calendar dropdown. In this popup, you can choose from the Absolute, Relative or Now tabs, then specify the required options.
Refresh the metrics
editYou can click Refresh to manually refresh the metrics.
Go to a specific chart
editThe charts available for this component are shown in a list on the left of the page. Click a chart in the list to quickly go to that chart.