IMPORTANT: No additional bug fixes or documentation updates
will be released for this version. For the latest information, see the
current release documentation.
Infrastructure
edit
IMPORTANT: This documentation is no longer updated. Refer to Elastic's version policy and the latest documentation.
Infrastructure
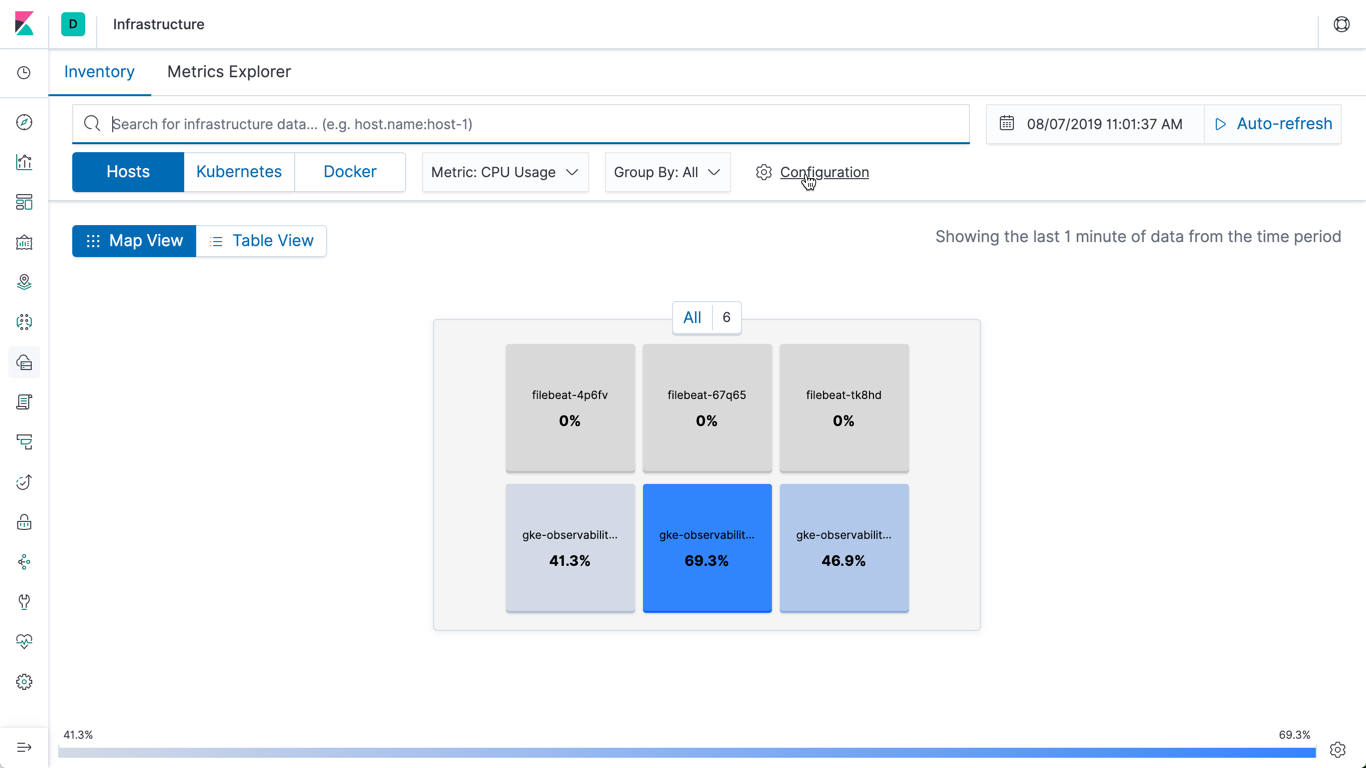
editThe Infrastructure app enables you to monitor your infrastructure and identify problems in real time. You start with a visual summary of your infrastructure where you can view basic metrics for common servers, containers, and services. Then you can drill down to view more detailed metrics or other information for that component.
You can:
- View an inventory of your infrastructure by hosts, Kubernetes pod or Docker containers. You can group and filter the data in various ways to help you identify the items that interest you.
- View current and historic values for metrics such as CPU usage, memory usage, and network traffic for each component. The available metrics depend on the kind of component being inspected.
- Use Metrics Explorer to group and visualize multiple customizable metrics for one or more components in a graphical format. You can optionally save these views and add them to dashboards.
- Seamlessly switch to view the corresponding logs, application traces or uptime information for a component.
To get started, you need to start collecting metrics data from your infrastructure. Then you can use the Infrastructure application to inspect and analyze your data.