IMPORTANT: No additional bug fixes or documentation updates
will be released for this version. For the latest information, see the
current release documentation.
Metrics Explorer
edit
IMPORTANT: This documentation is no longer updated. Refer to Elastic's version policy and the latest documentation.
Metrics Explorer
editMetrics Explorer in the Infrastructure app in Kibana allows you to group and visualise multiple customisable metrics for one or more components in a graphical format. This can be a starting point for further investigations. You can also save your views and add them to dashboards.
Metrics Explorer requirements and considerations
edit- Metrics Explorer uses data collected from Metricbeat.
-
You need read permissions on
metricbeat-*or the metric index specified in the Infrastructure configuration. -
Metrics Explorer uses the timestamp field set in the Infrastructure configuration.
By default that is set to
@timestamp. -
The interval for the X Axis is set to
auto. The bucket size is determined by the time range. - To use Open in Visualize you need access to the Visualize app.
Metrics Explorer tutorial
editIn this tutorial we’ll use Metrics Explorer to view the system load metrics for each host we’re monitoring with Metricbeat. After that, we’ll filter down to a specific host and explore the outbound traffic for each network interface. Before we start, if you don’t have any Metricbeat data, you’ll need to head over to our Metricbeat documentation to install Metricbeat and start collecting data.
- When you have Metricbeat running and collecting data, open Kibana and navigate to Infrastructure. The Inventory tab shows the host or hosts you are monitoring.
-
Select the Metrics Explorer tab.
The initial configuration has the Average aggregation selected, the of field populated with some default metrics, and the graph per dropdown set to
Everything. -
To select the metrics to view, firstly delete all the metrics currently shown in the of field by clicking the X by each metric name.
Then, in this field, start typing
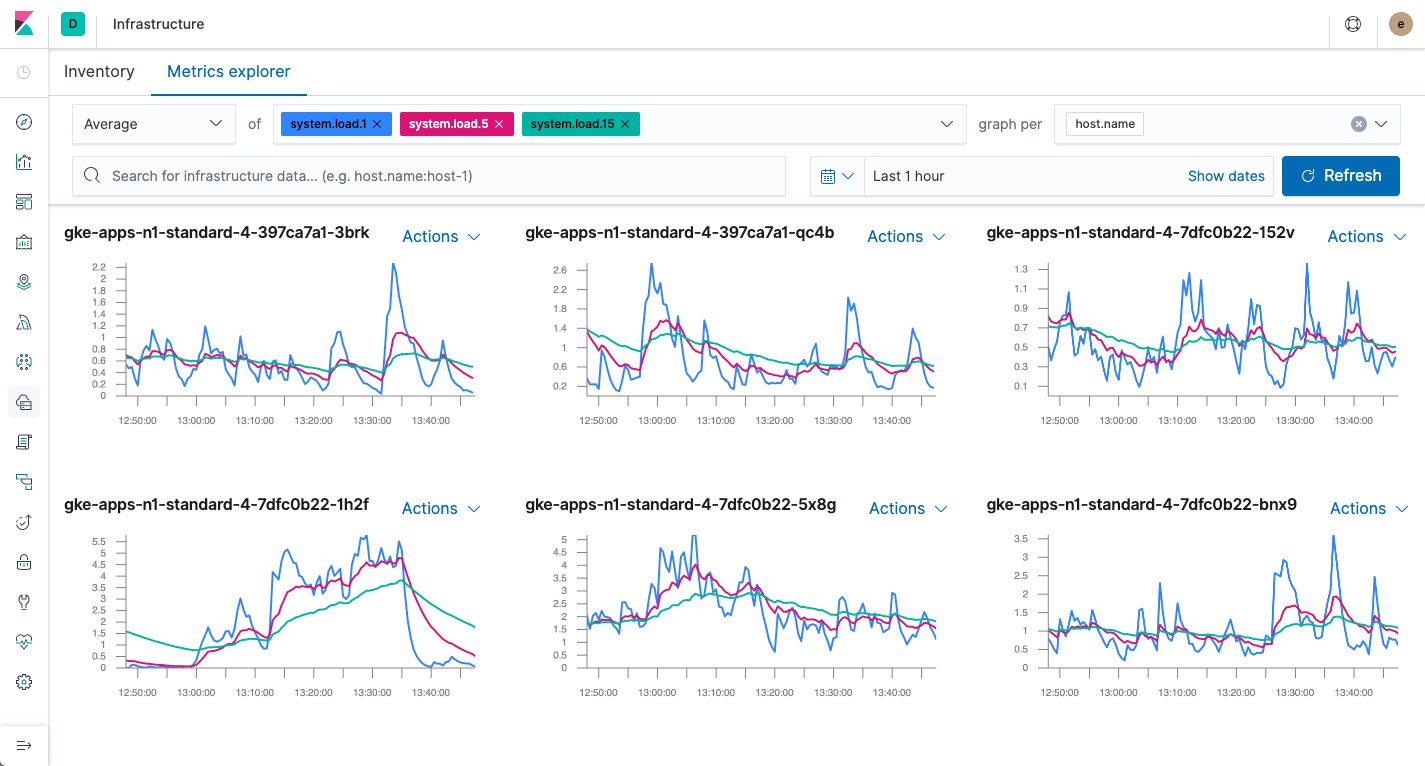
system.load.1and select this metric. Also add metrics forsystem.load.5andsystem.load.15. You will see a graph showing the average values of the metrics you selected. In this step we’ll leave the aggregation dropdown set to Average but you can try different values later if you like. -
In the graph per dropdown, enter
host.nameand select this field. You will see a separate graph for each host you are monitoring. If you are collecting metrics for multiple hosts, you will see something like the screenshot above. If you only have metrics for a single host, you will see a single graph. Congratulations! Either way, you’ve explored your first metric. -
Let’s explore a bit further.
In the upper right hand corner of the graph for one of the hosts, select the Actions dropdown and click Add Filter to show only the metrics for that host.
This adds a Kibana Query Language filter for
host.namein the second row of the Metrics Explorer configuration. If you only have one host, the graph will not change as you are already exploring metrics for a single host. -
Now you can start exploring some host-specific metrics.
First, delete each of the system load metrics in the of field by clicking the X by the metric name.
Then enter the metric
system.network.out.bytesto explore the outbound network traffic. This is a monotonically increasing value, so change the aggregation dropdown toRate. -
Since hosts have multiple network interfaces, it is more meaningful to display one graph for each network interface.
To do this, select the graph per dropdown, start typing
system.network.nameand select this field. You will now see a separate graph for each network interface. - If you like, you can put one of these graphs in a dashboard. Choose a graph, click the Actions dropdown and select Open In Visualize. This opens the graph in TSVB. From here you can save the graph and add it to a dashboard as usual.
Who’s the Metrics Explorer now? You are!