Create panels with editors
editCreate panels with editors
editKibana provides several editors that you can use to create panels of your data.
Create visualizations with the drag and drop editor. |
|
Create visualizations with your geographical data. |
|
Create visualizations with your time series data. |
|
Create custom visualizations with the Vega and Vega-Lite grammars. |
|
Build most visualization types using Elasticsearch aggregations. |
|
Create visualizations with your time series data using a simple expression language. |
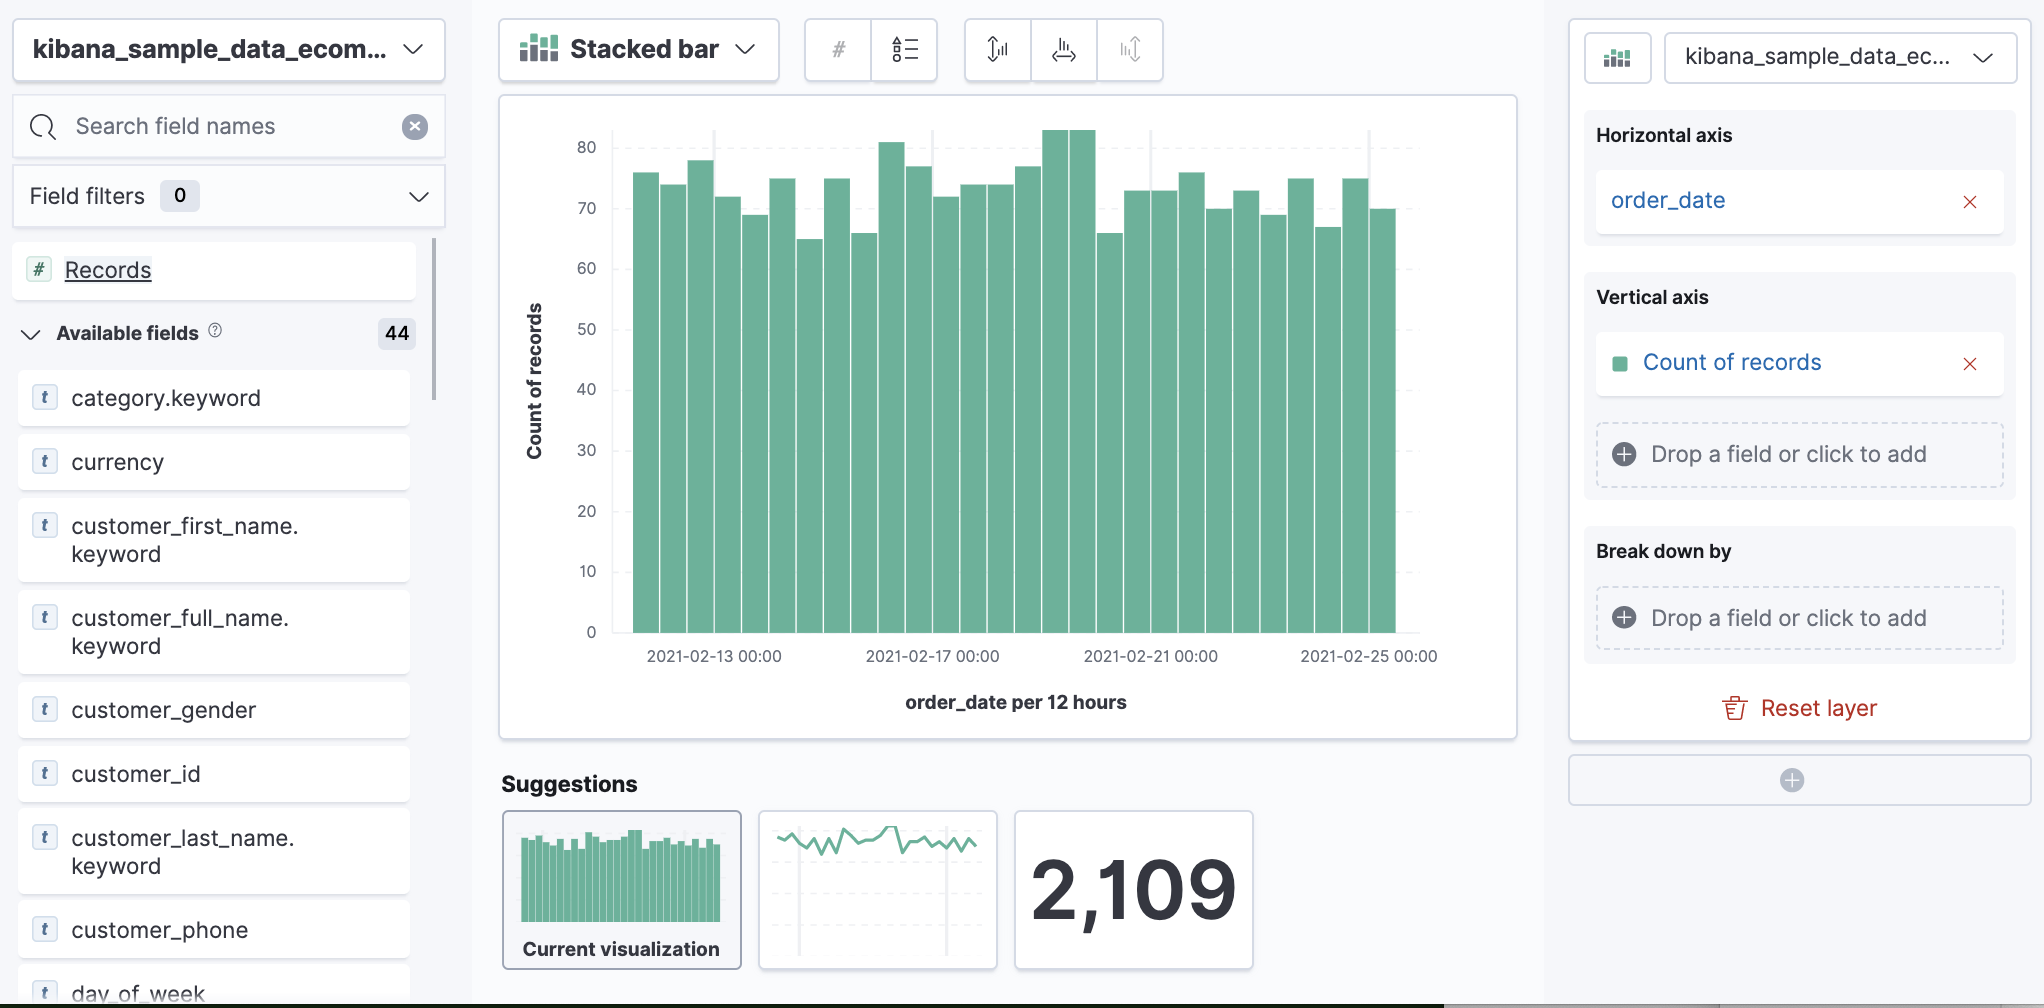
Lens
editLens is the drag and drop editor that creates visualizations of your data.
With Lens, you can:
- Use the automatically generated suggestions to change the visualization type.
- Create visualizations with multiple layers and indices.
- Change the aggregation and labels to customize the data.
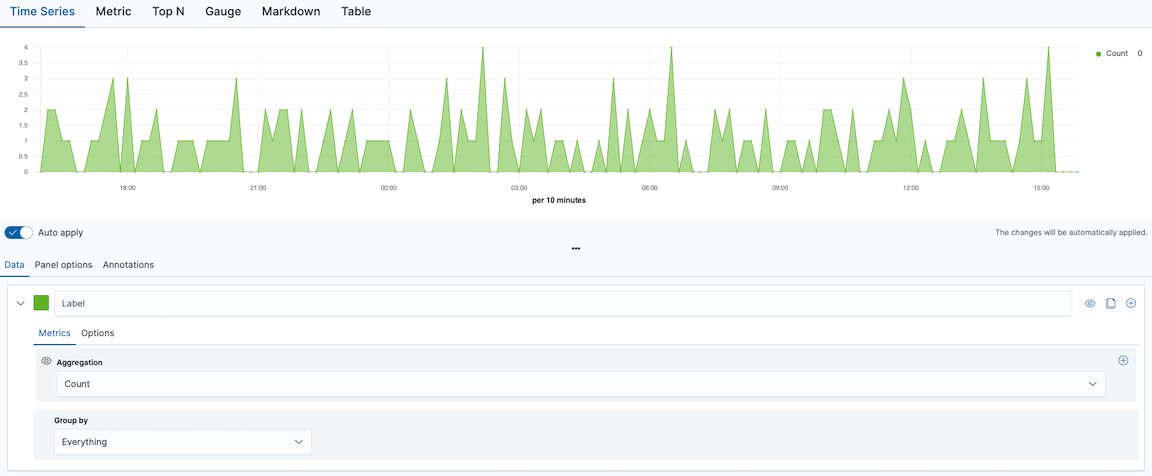
TSVB
editTSVB is a time series data visualization editor that allows you to use the full power of the Elasticsearch aggregation framework.
With TSVB, you can:
- Combine an infinite number of aggregations to display your data.
- Annotate time series data with timestamped events from an Elasticsearch index.
- View the data in several types of visualizations, including charts, data tables, and markdown panels.
- Display multiple index patterns in each visualization.
- Customize the data with labels and colors.
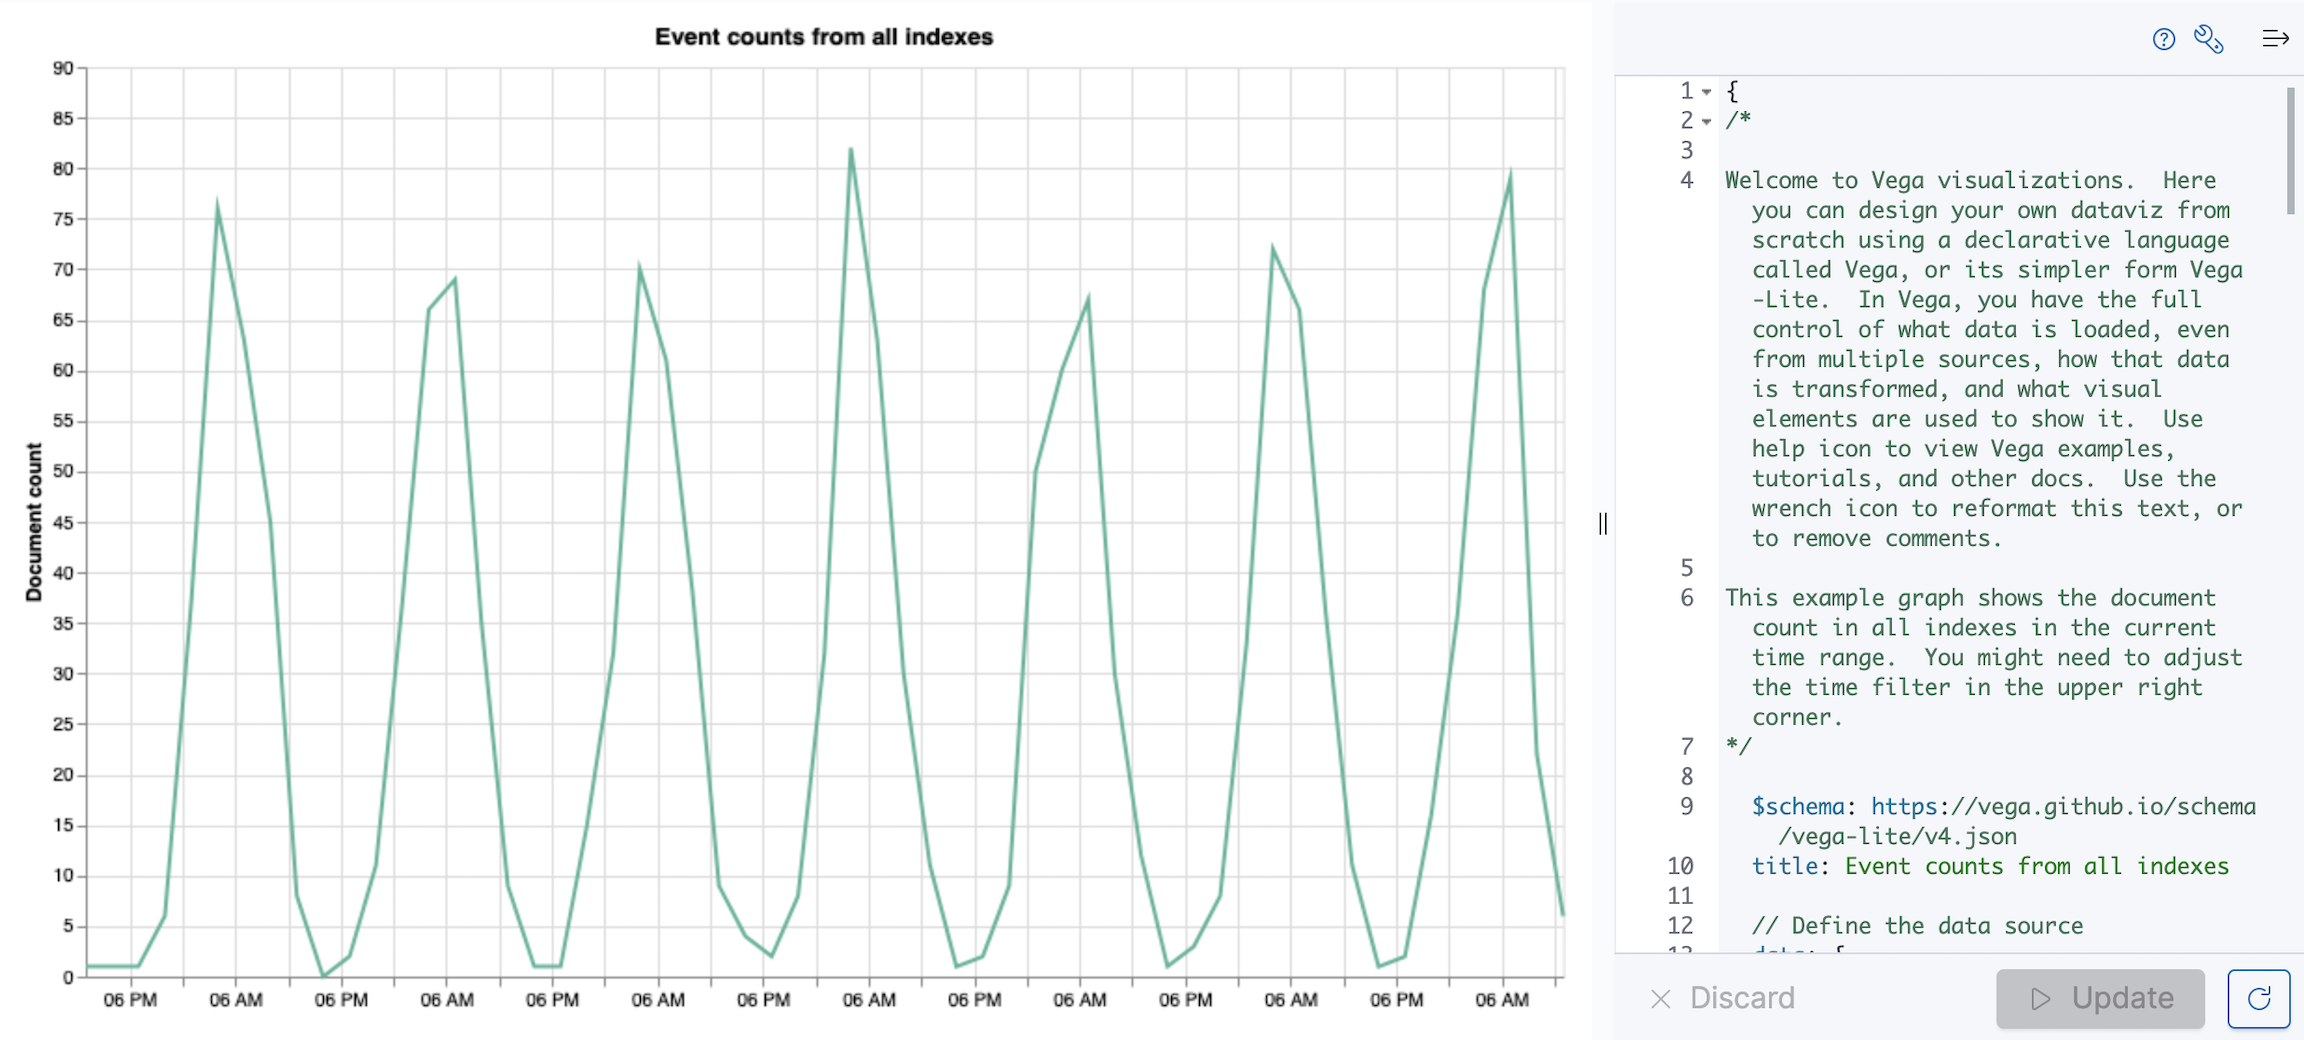
Custom visualizations
editVega and Vega-Lite are visualization grammars that are integrated into Kibana for custom visualizations.
- Vega-Lite — A high-level grammar for rapid analysis.
- Vega — A declarative language with support for interactivity.
Vega and Vega-Lite panels can display one or more data sources, including Elasticsearch, Elastic Map Service, URL, or static data, and support Kibana extensions that allow you to embed the panels on your dashboard and add interactive tools.
Use Vega or Vega-Lite when you want to create visualizations with:
-
Aggregations that use
nestedorparent/childmapping - Aggregations without an index pattern
- Queries that use custom time filters
- Complex calculations
- Extracted data from _source instead of aggregations
- Scatter charts, sankey charts, and custom maps
- An unsupported visual theme
These grammars have some limitations: they do not support tables, and can’t run queries conditionally.
For detailed Vega and Vega-Lite information and examples, refer to Resources and examples.
Aggregation-based
editWith aggregation-based visualizations, you can:
- Create heat map, tag cloud, gauge, and goal visualizations
- Split charts up to three aggregation levels, which is more than Lens and TSVB
- Time series data is not required
- Use a saved search as an input
- Sort data tables and use the summary row and percentage column features
- Assign colors to series
- Extend features with plugins
Aggregation-based visualizations include the following limitations:
- Limited styling options
- Math is unsupported
- Multiple indices is unsupported
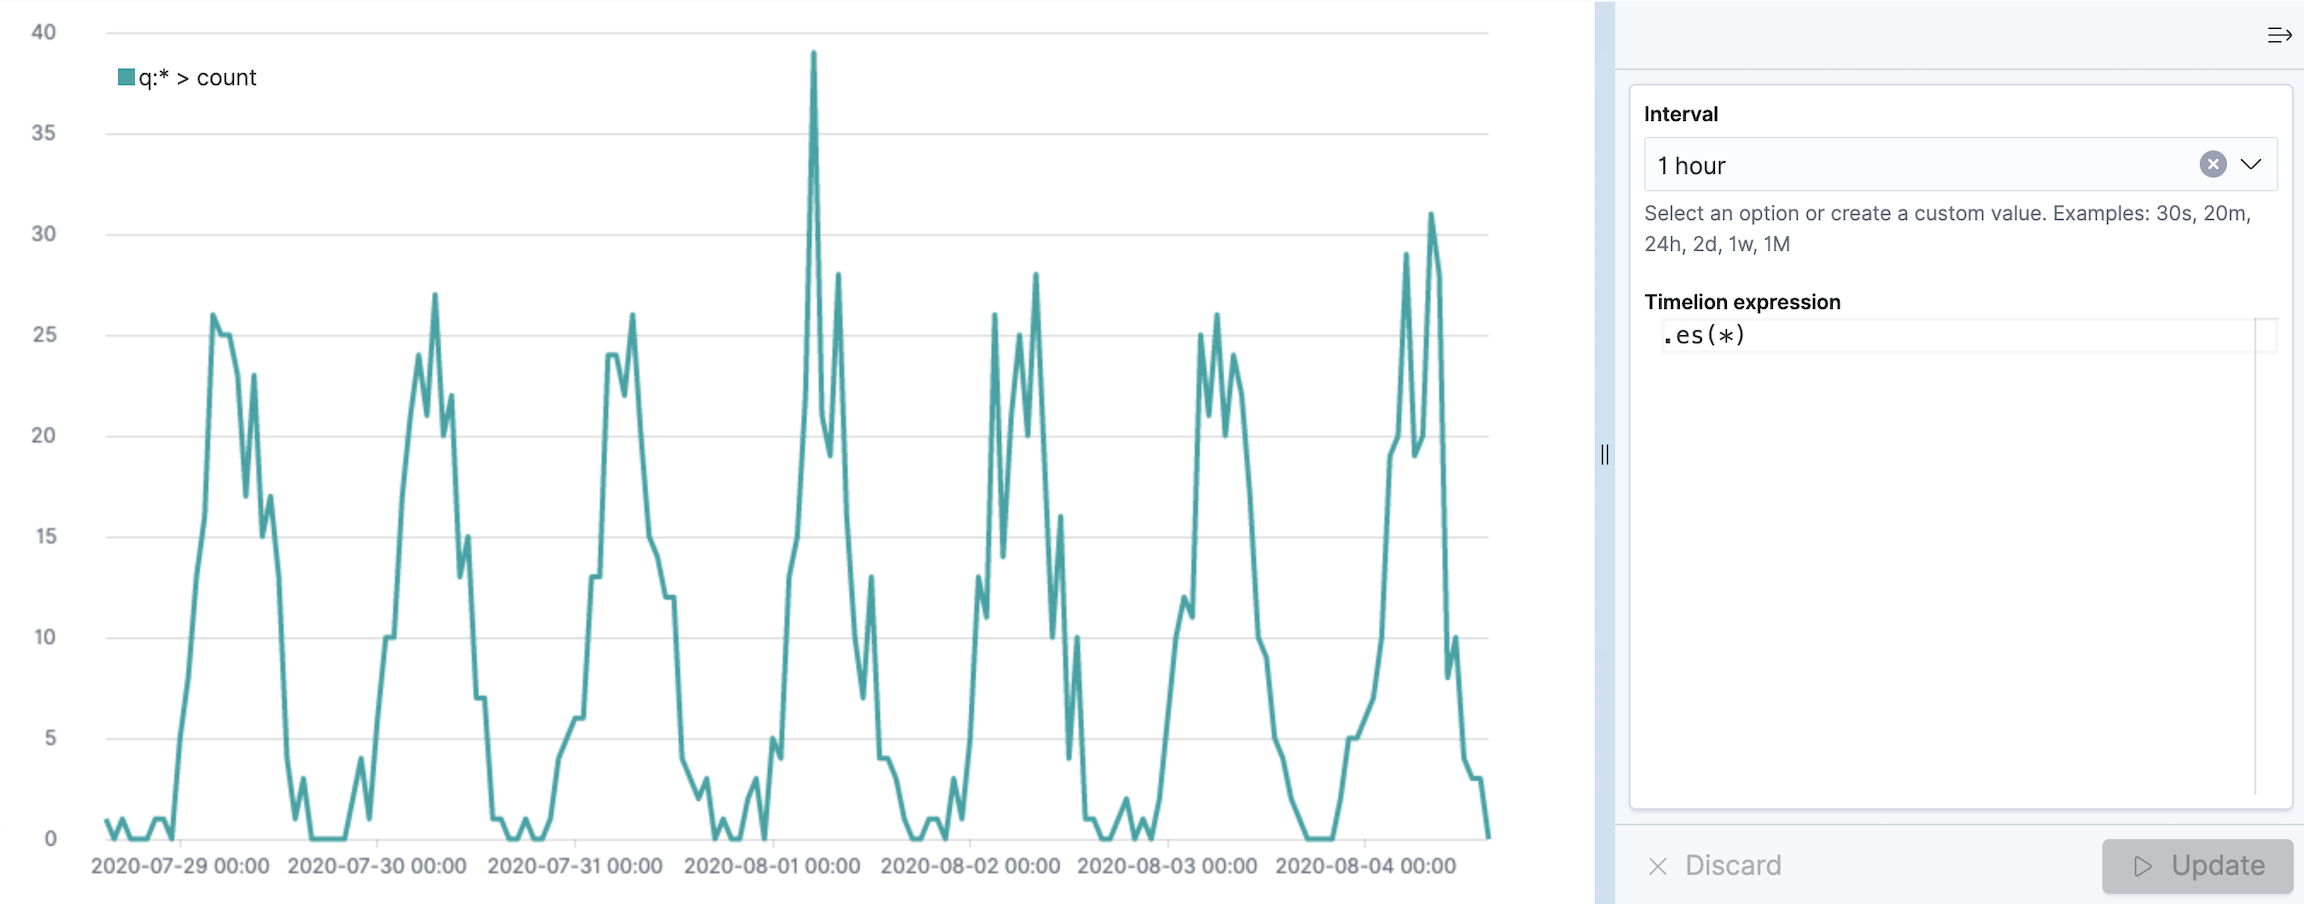
Timelion
editTimelion is driven by a simple expression language that you use to:
- Retrieve time series data from one or more indices
- Perform math across two or more time series
- Visualize the results