Create your first visualization with Vega-Lite
editCreate your first visualization with Vega-Lite
editThis functionality is in technical preview and may be changed or removed in a future release. Elastic will work to fix any issues, but features in technical preview are not subject to the support SLA of official GA features.
In this tutorial, you will learn about how to edit Vega-Lite in Kibana to create a stacked area chart from an Elasticsearch search query. It will give you a starting point for a more comprehensive introduction to Vega-Lite, while only covering the basics.
In this tutorial, you will build a stacked area chart from one of the Kibana sample data sets.
Before beginning this tutorial, install the eCommerce sample data set.
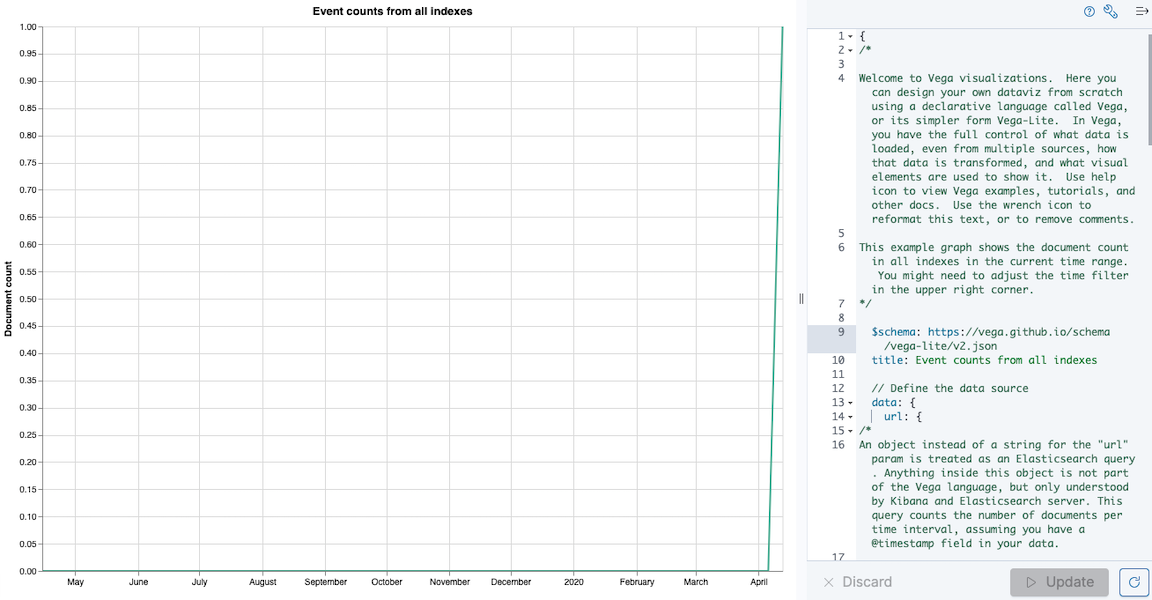
When you first open the Vega editor in Kibana, you will see a pre-populated line chart which shows the total number of documents across all your indices within the time range.
The text editor contains a Vega-Lite spec written in HJSON, which is similar to JSON but optimized for human editing. HJSON supports:
- Comments using // or /* syntax
- Object keys without quotes
- String values without quotes
- Optional commas
- Double or single quotes
- Multiline strings
Small steps
editAlways work on Vega in the smallest steps possible, and save your work frequently. Small changes will cause unexpected results. Click the "Save" button now.
The first step is to change the index to one of the sample data sets. Change
index: _all
to:
index: kibana_sample_data_ecommerce
Click "Update". The result is probably not what you expect. You should see a flat line with 0 results.
You’ve only changed the index, so the difference must be the query is returning no results. You can try the Vega debugging process, but intuition may be faster for this particular problem.
In this case, the problem is that you are querying the field @timestamp,
which does not exist in the kibana_sample_data_ecommerce data. Find and replace
@timestamp with order_date. This fixes the problem, leaving you with this spec:
Expand Vega-Lite spec
{
  $schema: https://vega.github.io/schema/vega-lite/v4.json
  title: Event counts from ecommerce
  data: {
    url: {
      %context%: true
      %timefield%: order_date
      index: kibana_sample_data_ecommerce
      body: {
        aggs: {
          time_buckets: {
            date_histogram: {
              field: order_date
              interval: {%autointerval%: true}
              extended_bounds: {
                min: {%timefilter%: "min"}
                max: {%timefilter%: "max"}
              }
              min_doc_count: 0
            }
          }
        }
        size: 0
      }
    }
    format: {property: "aggregations.time_buckets.buckets" }
  }

  mark: line

  encoding: {
    x: {
      field: key
      type: temporal
      axis: { title: null }
    }
    y: {
      field: doc_count
      type: quantitative
      axis: { title: "Document count" }
    }
  }
}
Now, let’s make the visualization more interesting by adding another aggregation to create a stacked area chart. To verify that you have constructed the right query, it is easiest to use the Kibana Dev Tools in a separate tab from the Vega editor. Open the Dev Tools from the Management section of the navigation.
This query is roughly equivalent to the one that is used in the default Vega-Lite spec. Copy it into the Dev Tools:
POST kibana_sample_data_ecommerce/_search
{
  "query": {
    "range": {
      "order_date": {
        "gte": "now-7d"
      }
    }
  },
  "aggs": {
    "time_buckets": {
      "date_histogram": {
        "field": "order_date",
        "fixed_interval": "1d",
        "extended_bounds": {
          "min": "now-7d"
        },
        "min_doc_count": 0
      }
    }
  },
  "size": 0
}
There’s not enough data to create a stacked bar in the original query, so we will add a new terms aggregation:
POST kibana_sample_data_ecommerce/_search
{
  "query": {
    "range": {
      "order_date": {
        "gte": "now-7d"
      }
    }
  },
  "aggs": {
    "categories": {
      "terms": { "field": "category.keyword" },
      "aggs": {
        "time_buckets": {
          "date_histogram": {
            "field": "order_date",
            "fixed_interval": "1d",
            "extended_bounds": {
              "min": "now-7d"
            },
            "min_doc_count": 0
          }
        }
      }
    }
  },
  "size": 0
}
You’ll see that the response format looks different from the previous query:
{
  "aggregations" : {
    "categories" : {
      "doc_count_error_upper_bound" : 0,
      "sum_other_doc_count" : 0,
      "buckets" : [{
        "key" : "Men's Clothing",
        "doc_count" : 1661,
        "time_buckets" : {
          "buckets" : [{
            "key_as_string" : "2020-06-30T00:00:00.000Z",
            "key" : 1593475200000,
            "doc_count" : 19
          }, {
            "key_as_string" : "2020-07-01T00:00:00.000Z",
            "key" : 1593561600000,
            "doc_count" : 71
          }]
        }
      }]
    }
  }
}
Now that we have data that we’re happy with, it’s time to convert from an
isolated Elasticsearch query into a query with Kibana integration. Looking at the
reference for writing Elasticsearch queries in Vega, you will
see the full list of special tokens that are used in this query, such
as %context: true. This query has also replaced "fixed_interval": "1d"
with interval: {%autointerval%: true}. Copy the final query into
your spec:
  data: {
    url: {
      %context%: true
      %timefield%: order_date
      index: kibana_sample_data_ecommerce
      body: {
        aggs: {
          categories: {
            terms: { field: "category.keyword" }
            aggs: {
              time_buckets: {
                date_histogram: {
                  field: order_date
                  interval: {%autointerval%: true}
                  extended_bounds: {
                    min: {%timefilter%: "min"}
                    max: {%timefilter%: "max"}
                  }
                  min_doc_count: 0
                }
              }
            }
          }
        }
        size: 0
      }
    }
    format: {property: "aggregations.categories.buckets" }
  }
If you copy and paste that into your Vega-Lite spec, and click "Update",
you will see a warning saying Infinite extent for field "key": [Infinity, -Infinity].
Let’s use our Vega debugging skills to understand why.
Vega-Lite generates data using the names source_0 and data_0. source_0 contains
the results from the Elasticsearch query, and data_0 contains the visually encoded results
which are shown in the chart. To debug this problem, you need to compare both.
To look at the source, open the browser dev tools console and type
VEGA_DEBUG.view.data('source_0'). You will see:
[{
  doc_count: 454
  key: "Men's Clothing"
  time_buckets: {buckets: Array(57)}
  Symbol(vega_id): 12822
}, ...]
To compare to the visually encoded data, open the browser dev tools console and type
VEGA_DEBUG.view.data('data_0'). You will see:
[{
  doc_count: 454
  key: NaN
  time_buckets: {buckets: Array(57)}
  Symbol(vega_id): 13879
}]
The issue seems to be that the key property is not being converted the right way,
which makes sense because the key is now Men's Clothing instead of a timestamp.
To fix this, try updating the encoding of your Vega-Lite spec to:
  encoding: {
    x: {
      field: time_buckets.buckets.key
      type: temporal
      axis: { title: null }
    }
    y: {
      field: time_buckets.buckets.doc_count
      type: quantitative
      axis: { title: "Document count" }
    }
  }
This will show more errors, and you can inspect VEGA_DEBUG.view.data('data_0') to
understand why. This now shows:
[{
  doc_count: 454
  key: "Men's Clothing"
  time_buckets: {buckets: Array(57)}
  time_buckets.buckets.doc_count: undefined
  time_buckets.buckets.key: null
  Symbol(vega_id): 14094
}]
It looks like the problem is that the time_buckets inner array is not being
extracted by Vega. The solution is to use a Vega-lite
flatten transformation, available in Kibana 7.9 and later.
If using an older version of Kibana, the flatten transformation is available in Vega
but not Vega-Lite.
Add this section in between the data and encoding section:
  transform: [{
    flatten: ["time_buckets.buckets"]
  }]
This does not yet produce the results you expect. Inspect the transformed data
by typing VEGA_DEBUG.view.data('data_0') into the console again:
[{
  doc_count: 453
  key: "Men's Clothing"
  time_bucket.buckets.doc_count: undefined
  time_buckets: {buckets: Array(57)}
  time_buckets.buckets: {
    key_as_string: "2020-06-30T15:00:00.000Z",
    key: 1593529200000,
    doc_count: 2
  }
  time_buckets.buckets.key: null
  Symbol(vega_id): 21564
}]
The debug view shows undefined values where you would expect to see numbers, and
the cause is that there are duplicate names which are confusing Vega-Lite. This can
be fixed by making this change to the transform and encoding blocks:
  transform: [{
    flatten: ["time_buckets.buckets"],
    as: ["buckets"]
  }]

  mark: area

  encoding: {
    x: {
      field: buckets.key
      type: temporal
      axis: { title: null }
    }
    y: {
      field: buckets.doc_count
      type: quantitative
      axis: { title: "Document count" }
    }
    color: {
      field: key
      type: nominal
    }
  }
At this point, you have a stacked area chart that shows the top categories, but the chart is still missing some common features that we expect from a Kibana visualization. Let’s add hover states and tooltips next.
Hover states are handled differently in Vega-Lite and Vega. In Vega-Lite this is
done using a concept called selection, which has many permutations that are not
covered in this tutorial. We will be adding a simple tooltip and hover state.
Because Kibana has enabled the Vega tooltip plugin, tooltips can be defined in several ways:
-
Automatic tooltip based on the data, via
{ content: "data" } -
Array of fields, like
[{ field: "key", type: "nominal" }] -
Defining a custom Javascript object using the
calculatetransform
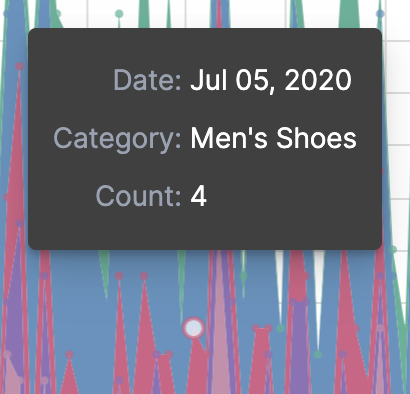
For the simple tooltip, add this to your encoding:
  encoding: {
    tooltip: [{
      field: buckets.key
      type: temporal
      title: "Date"
    }, {
      field: key
      type: nominal
      title: "Category"
    }, {
      field: buckets.doc_count
      type: quantitative
      title: "Count"
    }]
  }
As you hover over the area series in your chart, a multi-line tooltip will appear, but it won’t indicate the nearest point that it’s pointing to. To indicate the nearest point, we need to add a second layer.
The first step is to remove the mark: area from your visualization.
Once you’ve removed the previous mark, add a composite mark at the end of
the Vega-Lite spec:
  layer: [{
    mark: area
  }, {
    mark: point
  }]
You’ll see that the points are not appearing to line up with the area chart, and the reason is that the points are not being stacked. Change your Y encoding to this:
    y: {
      field: buckets.doc_count
      type: quantitative
      axis: { title: "Document count" }
      stack: true
    }
Now, we will add a selection block inside the point mark:
  layer: [{
    mark: area
  }, {
    mark: point

    selection: {
      pointhover: {
        type: single
        on: mouseover
        clear: mouseout
        empty: none
        fields: ["buckets.key", "key"]
        nearest: true
      }
    }

    encoding: {
      size: {
        condition: {
          selection: pointhover
          value: 100
        }
        value: 5
      }
      fill: {
        condition: {
          selection: pointhover
          value: white
        }
      }
    }
  }]
Now that you’ve enabled a selection, try moving the mouse around the visualization and seeing the points respond to the nearest position:
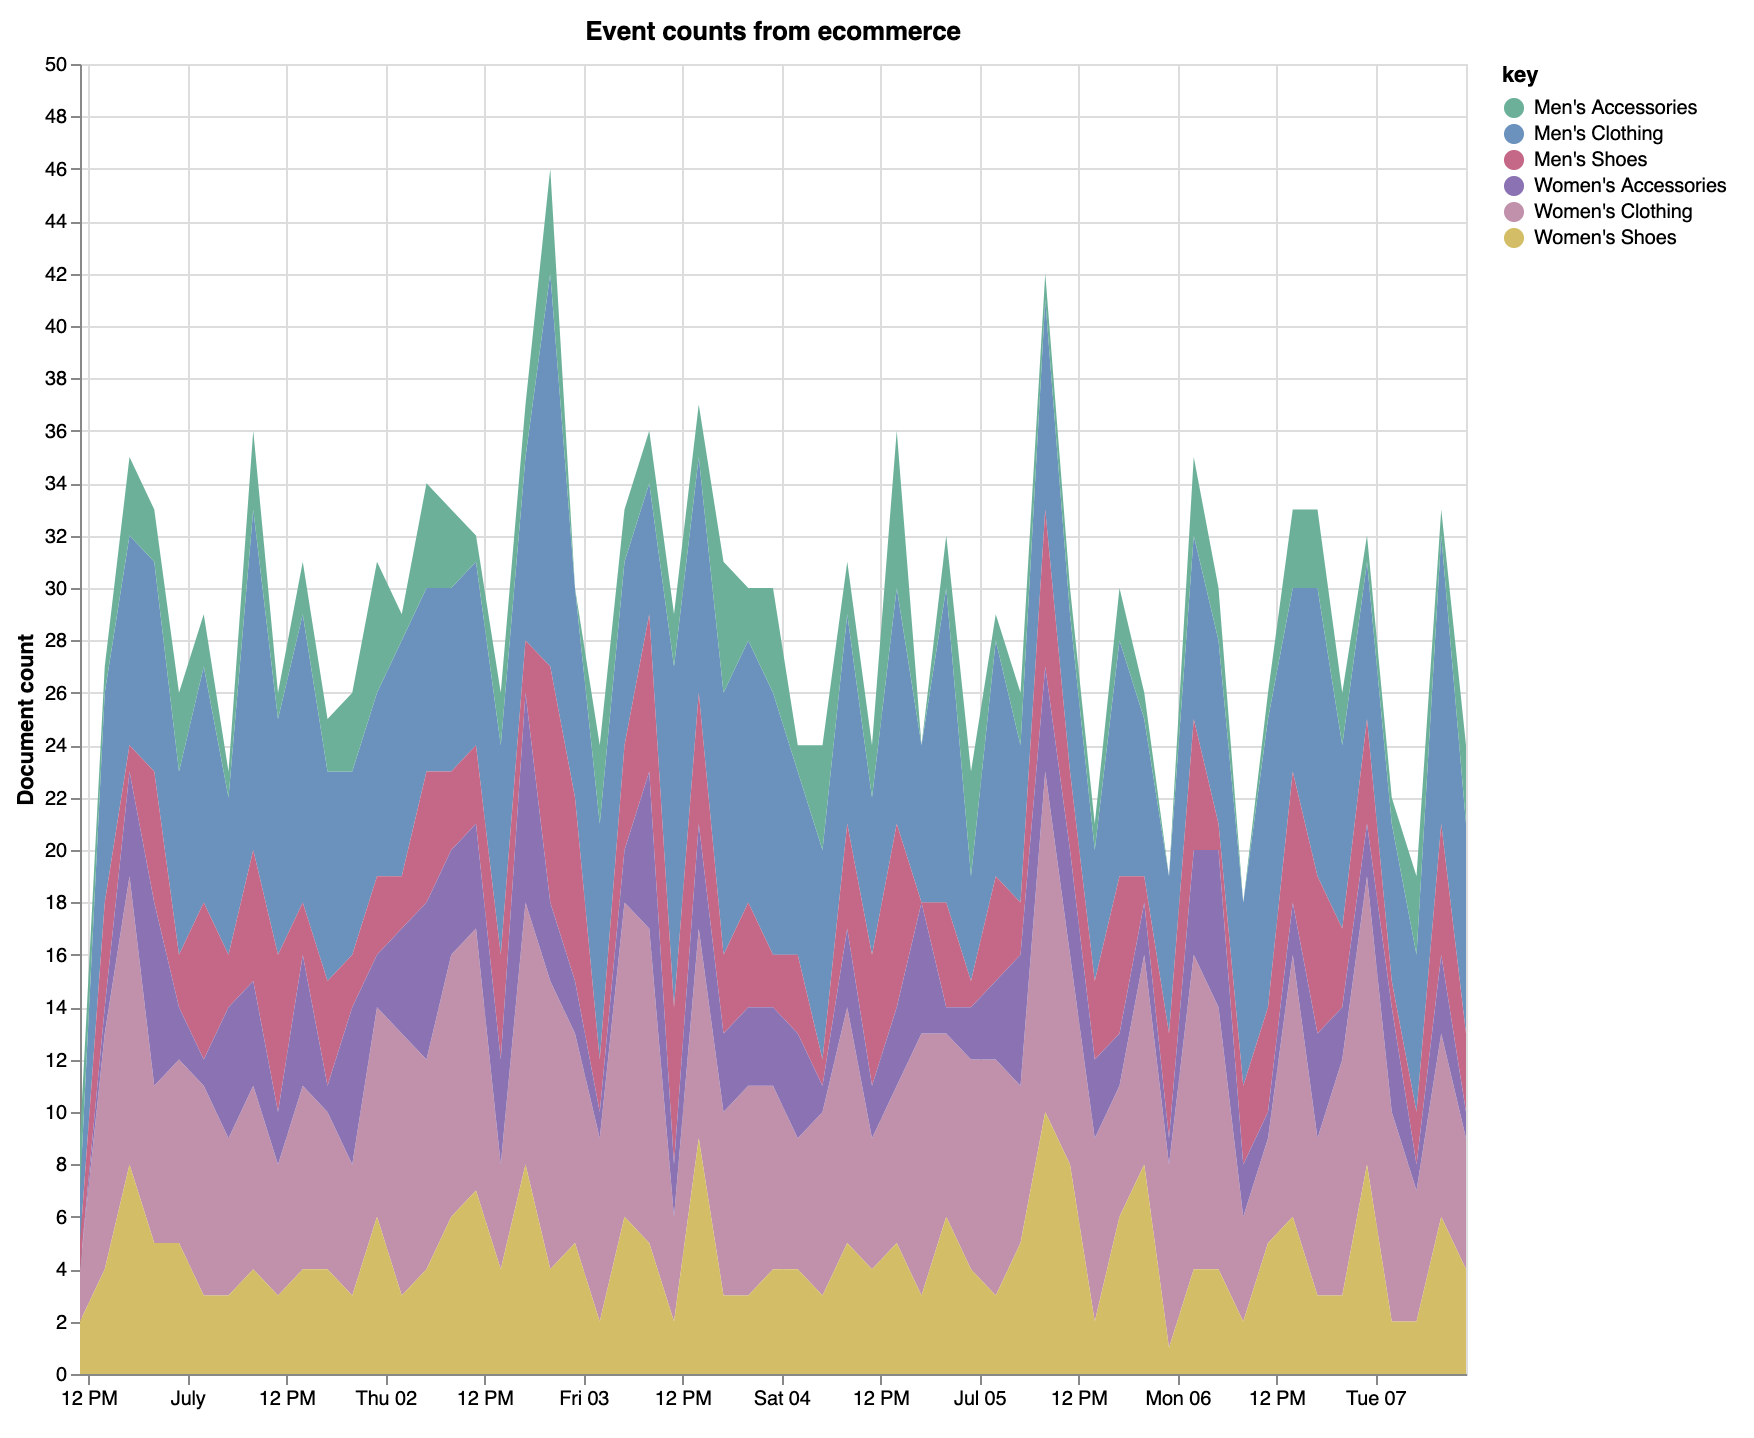
The final result of this tutorial is this spec:
Expand final Vega-Lite spec
{
  $schema: https://vega.github.io/schema/vega-lite/v4.json
  title: Event counts from ecommerce
  data: {
    url: {
      %context%: true
      %timefield%: order_date
      index: kibana_sample_data_ecommerce
      body: {
        aggs: {
          categories: {
            terms: { field: "category.keyword" }
            aggs: {
              time_buckets: {
                date_histogram: {
                  field: order_date
                  interval: {%autointerval%: true}
                  extended_bounds: {
                    min: {%timefilter%: "min"}
                    max: {%timefilter%: "max"}
                  }
                  min_doc_count: 0
                }
              }
            }
          }
        }
        size: 0
      }
    }
    format: {property: "aggregations.categories.buckets" }
  }

  transform: [{
    flatten: ["time_buckets.buckets"]
    as: ["buckets"]
  }]

  encoding: {
    x: {
      field: buckets.key
      type: temporal
      axis: { title: null }
    }
    y: {
      field: buckets.doc_count
      type: quantitative
      axis: { title: "Document count" }
      stack: true
    }
    color: {
      field: key
      type: nominal
      title: "Category"
    }
    tooltip: [{
      field: buckets.key
      type: temporal
      title: "Date"
    }, {
      field: key
      type: nominal
      title: "Category"
    }, {
      field: buckets.doc_count
      type: quantitative
      title: "Count"
    }]
  }

  layer: [{
    mark: area
  }, {
    mark: point

    selection: {
      pointhover: {
        type: single
        on: mouseover
        clear: mouseout
        empty: none
        fields: ["buckets.key", "key"]
        nearest: true
      }
    }

    encoding: {
      size: {
        condition: {
          selection: pointhover
          value: 100
        }
        value: 5
      }
      fill: {
        condition: {
          selection: pointhover
          value: white
        }
      }
    }
  }]
}