Vega reference
editVega reference
editFor additional Vega and Vega-Lite information, refer to the reference sections.
Reference for Kibana extensions
editKibana has extended Vega and Vega-Lite with extensions that support:
- Automatic sizing
- Default theme to match Kibana
- Writing Elasticsearch queries using the time range and filters from dashboards
- [preview] This functionality is in technical preview and may be changed or removed in a future release. Elastic will work to fix any issues, but features in technical preview are not subject to the support SLA of official GA features. Using the Elastic Map Service in Vega maps
- Additional tooltip styling
- Advanced setting to enable URL loading from any domain
- Limited debugging support using the browser dev tools
- (Vega only) Expression functions which can update the time range and dashboard filters
Automatic sizing
editMost users will want their Vega visualizations to take the full available space, so unlike
Vega examples, width and height are not required parameters in Kibana. To set the width
or height manually, set autosize: none. For example, to set the height to a specific pixel value:
autosize: none
width: container
height: 200
The default Kibana settings which are inherited by your visualizations are:
autosize: {
  type: fit
  contains: padding
}
width: container
height: container
Kibana is able to merge your custom autosize settings with the defaults. The options fit-x
and fit-y are supported but not recommended over the default fit setting.
To learn more, read about autosize in the Vega documentation.
Autosize in Vega-Lite has several limitations
that can result in a warning like Autosize "fit" only works for single views and layered views.
The recommended fix for this warning is to convert your spec to Vega using the browser console
VEGA_DEBUG.vega_spec output.
Default theme to match Kibana
editKibana registers a default Vega color scheme
with the id elastic, and sets a default color for each mark type.
Override it by providing a different stroke, fill, or color (Vega-Lite) value.
Writing Elasticsearch queries in Vega
editKibana extends the Vega data elements
with support for direct Elasticsearch queries specified as url.
Kibana is unable to support dynamically loaded data, which would otherwise work in Vega. All data is fetched before it’s passed to the Vega renderer.
To define an Elasticsearch query in Vega, set the url to an object. Kibana parses
the object looking for special tokens that allow your query to integrate with Kibana.
Tokens include the following:
-
%context%: true: Set at the top level, and replaces thequerysection with filters from dashboard -
%timefield%: <name>: Set at the top level, integrates the query with the dashboard time filter -
{%timefilter%: true}: Replaced by an Elasticsearch range query with upper and lower bounds -
{%timefilter%: "min" | "max"}: Replaced only by the upper or lower bounds -
{%timefilter: true, shift: -1, unit: 'hour'}: Generates a time range query one hour in the past -
{%autointerval%: true}: Replaced by the string which contains the automatic Kibana time interval, such as1h -
{%autointerval%: 10}: Replaced by a string which is approximately dividing the time into 10 ranges, allowing you to influence the automatic interval -
"%dashboard_context-must_clause%": String replaced by object containing filters -
"%dashboard_context-filter_clause%": String replaced by an object containing filters -
"%dashboard_context-must_not_clause%": String replaced by an object containing filters
For example, the following query counts the number of documents in a specific index:
// An object instead of a string for the URL value
// is treated as a context-aware Elasticsearch query.
url: {
  // Specify the time filter.
  %timefield%: @timestamp
  // Apply dashboard context filters when set
  %context%: true

  // Which indexes to search
  index: kibana_sample_data_logs
  // The body element may contain "aggs" and "query" keys
  body: {
    aggs: {
      time_buckets: {
        date_histogram: {
          // Use date histogram aggregation on @timestamp field
          field: @timestamp
          // interval value will depend on the time filter
          // Use an integer to set approximate bucket count
          interval: { %autointerval%: true }
          // Make sure we get an entire range, even if it has no data
          extended_bounds: {
            min: { %timefilter%: "min" }
            max: { %timefilter%: "max" }
          }
          // Use this for linear (e.g. line, area) graphs
          // Without it, empty buckets will not show up
          min_doc_count: 0
        }
      }
    }
    // Speed up the response by only including aggregation results
    size: 0
  }
}
The full result includes the following structure:
{
  "aggregations": {
    "time_buckets": {
      "buckets": [{
          "key_as_string": "2015-11-30T22:00:00.000Z",
          "key": 1448920800000,
          "doc_count": 28
        }, {
          "key_as_string": "2015-11-30T23:00:00.000Z",
          "key": 1448924400000,
          "doc_count": 330
        }, ...
For most visualizations, you only need the list of bucket values. To focus on
only the data you need, use format: {property: "aggregations.time_buckets.buckets"}.
Specify a query with individual range and dashboard context. The query is
equivalent to "%context%": true, "%timefield%": "@timestamp",
except that the time range is shifted back by 10 minutes:
{
  body: {
    query: {
      bool: {
        must: [
          // This string will be replaced
          // with the auto-generated "MUST" clause
          "%dashboard_context-must_clause%"
          {
            range: {
              // apply timefilter (upper right corner)
              // to the @timestamp variable
              @timestamp: {
                // "%timefilter%" will be replaced with
                // the current values of the time filter
                // (from the upper right corner)
                "%timefilter%": true
                // Only work with %timefilter%
                // Shift current timefilter by 10 units back
                shift: 10
                // week, day (default), hour, minute, second
                unit: minute
              }
            }
          }
        ]
        must_not: [
          // This string will be replaced with
          // the auto-generated "MUST-NOT" clause
          "%dashboard_context-must_not_clause%"
        ]
        filter: [
          // This string will be replaced
          // with the auto-generated "FILTER" clause
          "%dashboard_context-filter_clause%"
        ]
      }
    }
  }
}
When using "%context%": true or defining a value for "%timefield%" the body cannot contain a query. To customize the query within the VEGA specification (e.g. add an additional filter, or shift the timefilter), define your query and use the placeholders as in the example above. The placeholders will be replaced by the actual context of the dashboard or visualization once parsed.
The "%timefilter%" can also be used to specify a single min or max
value. The date_histogram’s extended_bounds can be set
with two values - min and max. Instead of hardcoding a value, you may
use "min": {"%timefilter%": "min"}, which will be replaced with the
beginning of the current time range. The shift and unit values are
also supported. The "interval" can also be set dynamically, depending
on the currently picked range: "interval": {"%autointerval%": 10} will
try to get about 10-15 data points (buckets).
Vega with a Map
edit
[preview]
This functionality is in technical preview and may be changed or removed in a future release. Elastic will work to fix any issues, but features in technical preview are not subject to the support SLA of official GA features.
To enable Maps, the graph must specify type=map in the host
configuration:
{
  "config": {
    "kibana": {
      "type": "map",

      // Initial map position
      "latitude": 40.7,   // default 0
      "longitude": -74,   // default 0
      "zoom": 7,          // default 2

      // defaults to "default". Use false to disable base layer.
      "mapStyle": false,

      // default 0
      "minZoom": 5,

      // defaults to the maximum for the given style,
      // or 25 when base is disabled
      "maxZoom": 13,

      // defaults to true, shows +/- buttons to zoom in/out
      "zoomControl": false,

      // Defaults to 'false', disables mouse wheel zoom. If set to
      // 'true', map may zoom unexpectedly while scrolling dashboard
      "scrollWheelZoom": false,

      // When false, repaints on each move frame.
      // Makes the graph slower when moving the map
      "delayRepaint": true, // default true
    }
  },
  /* the rest of Vega JSON */
}
The visualization automatically injects a "projection", which you can use to
calculate the position of all geo-aware marks.
Additionally, you can use latitude, longitude, and zoom signals.
These signals can be used in the graph, or can be updated to modify the
position of the map.
[preview]
This functionality is in technical preview and may be changed or removed in a future release. Elastic will work to fix any issues, but features in technical preview are not subject to the support SLA of official GA features.
You can use Vega’s data element to access Elastic Maps Service (EMS) vector shapes of administrative boundaries in your Vega map by setting url.data to emsFile:
url: {
  // "type" defaults to "elasticsearch" otherwise
  type: emsfile
  // Name of the file, exactly as in the Region map visualization
  name: World Countries
}
// The result is a geojson file, get its features to use
// this data source with the "shape" marks
// https://vega.github.io/vega/docs/marks/shape/
format: {property: "features"}
Additional tooltip styling
editKibana has installed the Vega tooltip plugin, so tooltips can be defined in the ways documented there. Beyond that, Kibana also supports a configuration option for changing the tooltip position and padding:
{
  config: {
    kibana: {
      tooltips: {
        position: 'top',
        padding: 15
      }
    }
  }
}
Advanced setting to enable URL loading from any domain
editVega can load data from any URL, but this is disabled by default in Kibana.
To change this, set vis_type_vega.enableExternalUrls: true in kibana.yml,
then restart Kibana.
Vega Inspector
editUse the contextual Inspect tool to gain insights into different elements. For Vega visualizations, there are two different views: Request and Vega debug.
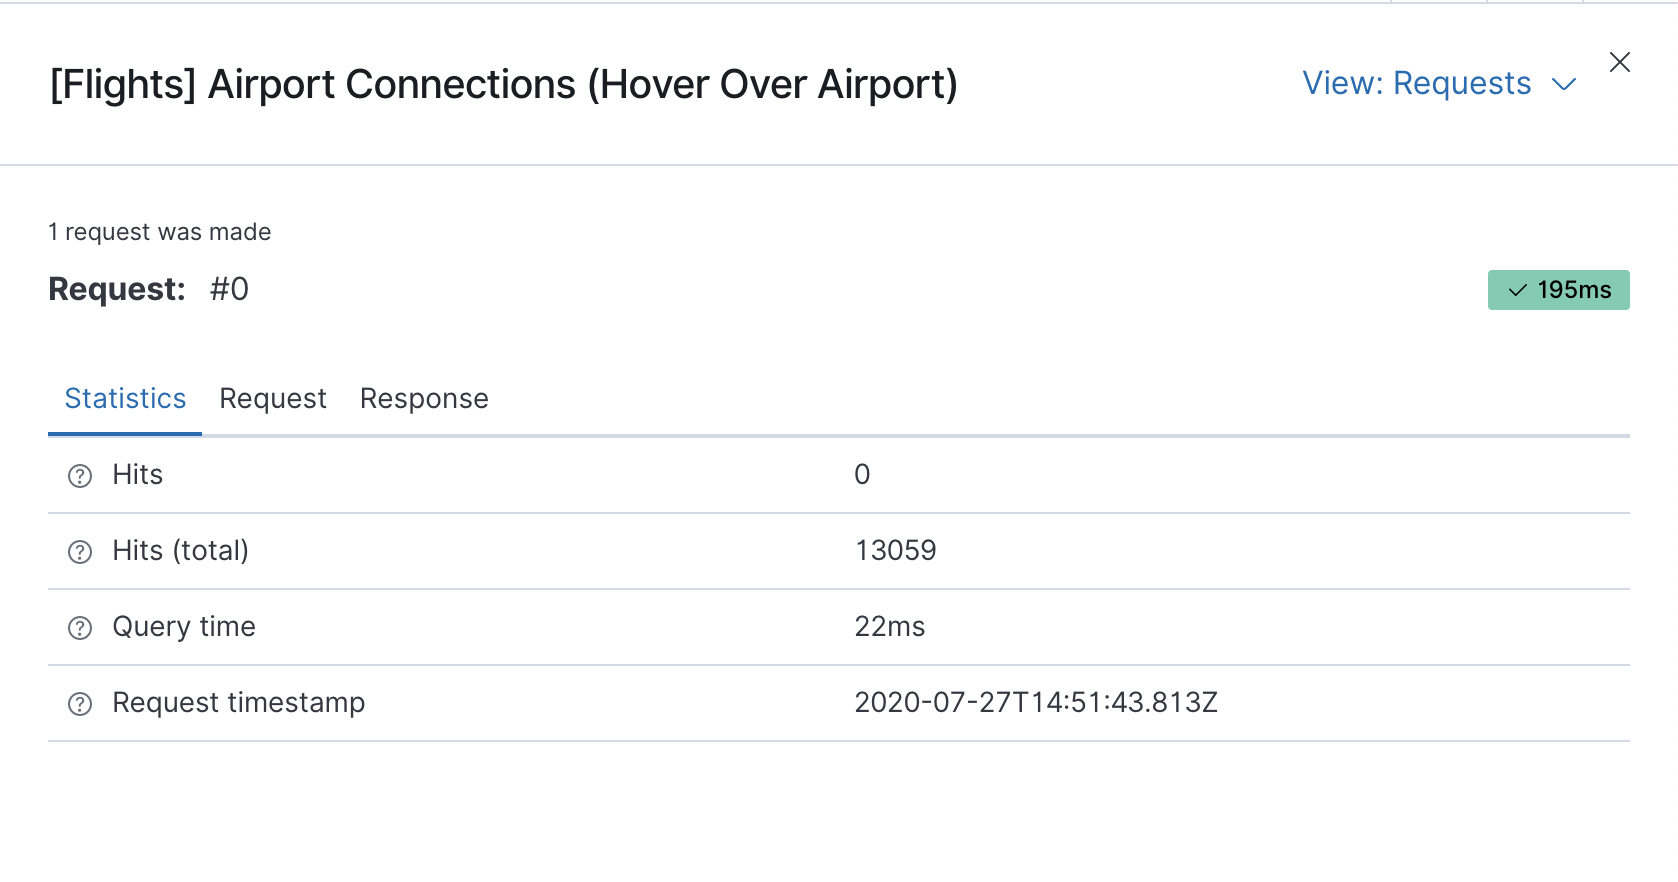
Inspect Elasticsearch requests
editVega uses the Elasticsearch search API to get documents and aggregation results from Elasticsearch. To troubleshoot these requests, click Inspect, which shows the most recent requests. In case your specification has more than one request, you can switch between the views using the View dropdown.
Vega debugging
editWith the Vega debug view, you can inspect the Data sets and Signal Values runtime data.
The runtime data is read from the runtime scope.
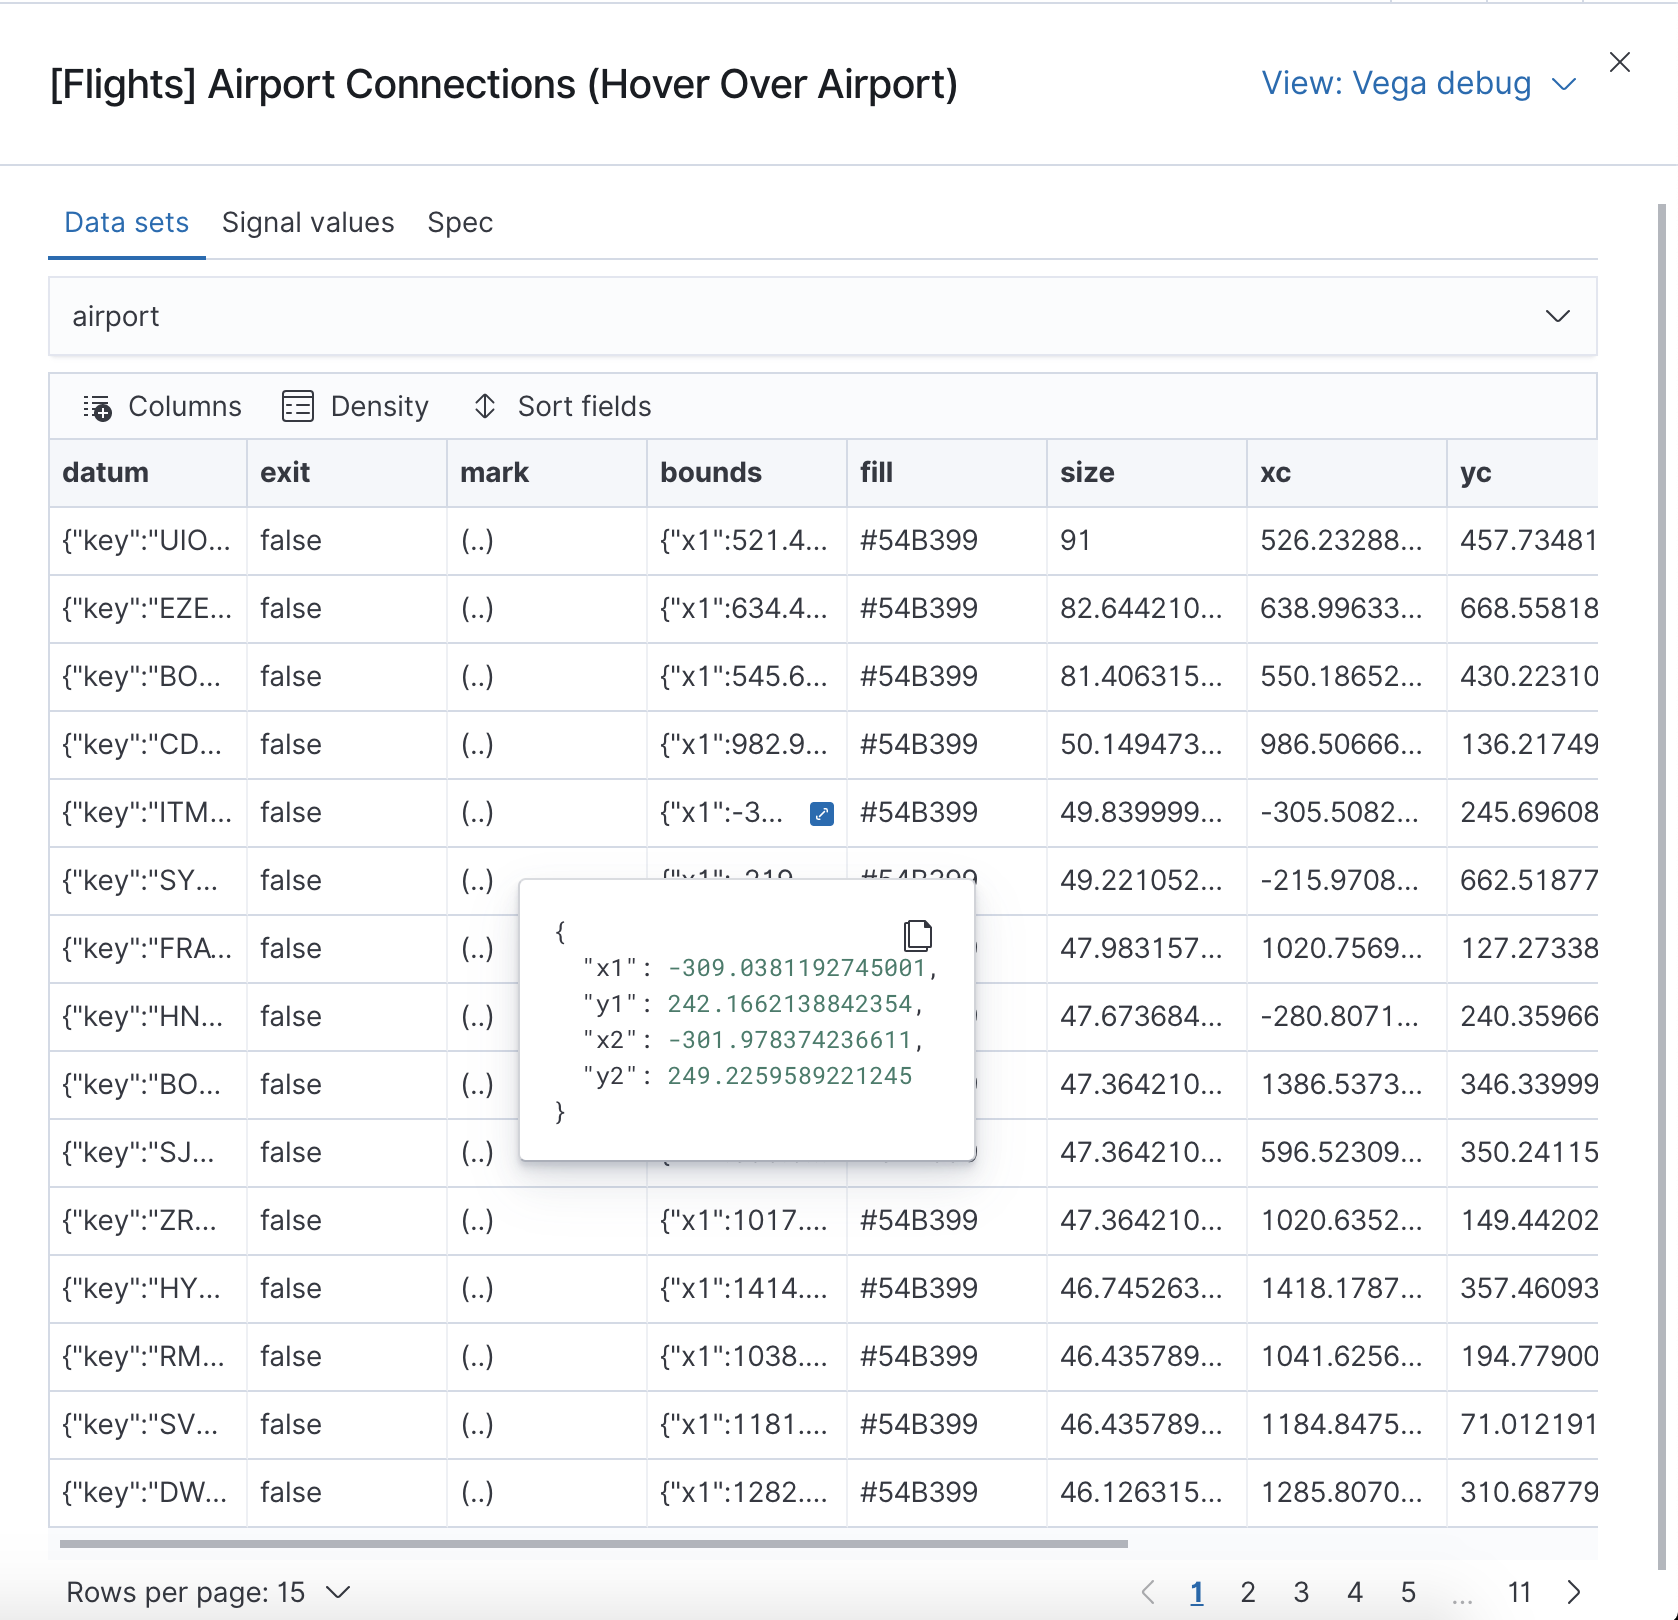
To debug more complex specs, access to the view variable. For more information, refer to
the Vega browser debugging process.
Asking for help with a Vega spec
editBecause of the dynamic nature of the data in Elasticsearch, it is hard to help you with Vega specs unless you can share a dataset. To do this, click Inspect, select the Vega debug view, then select the Spec tab:
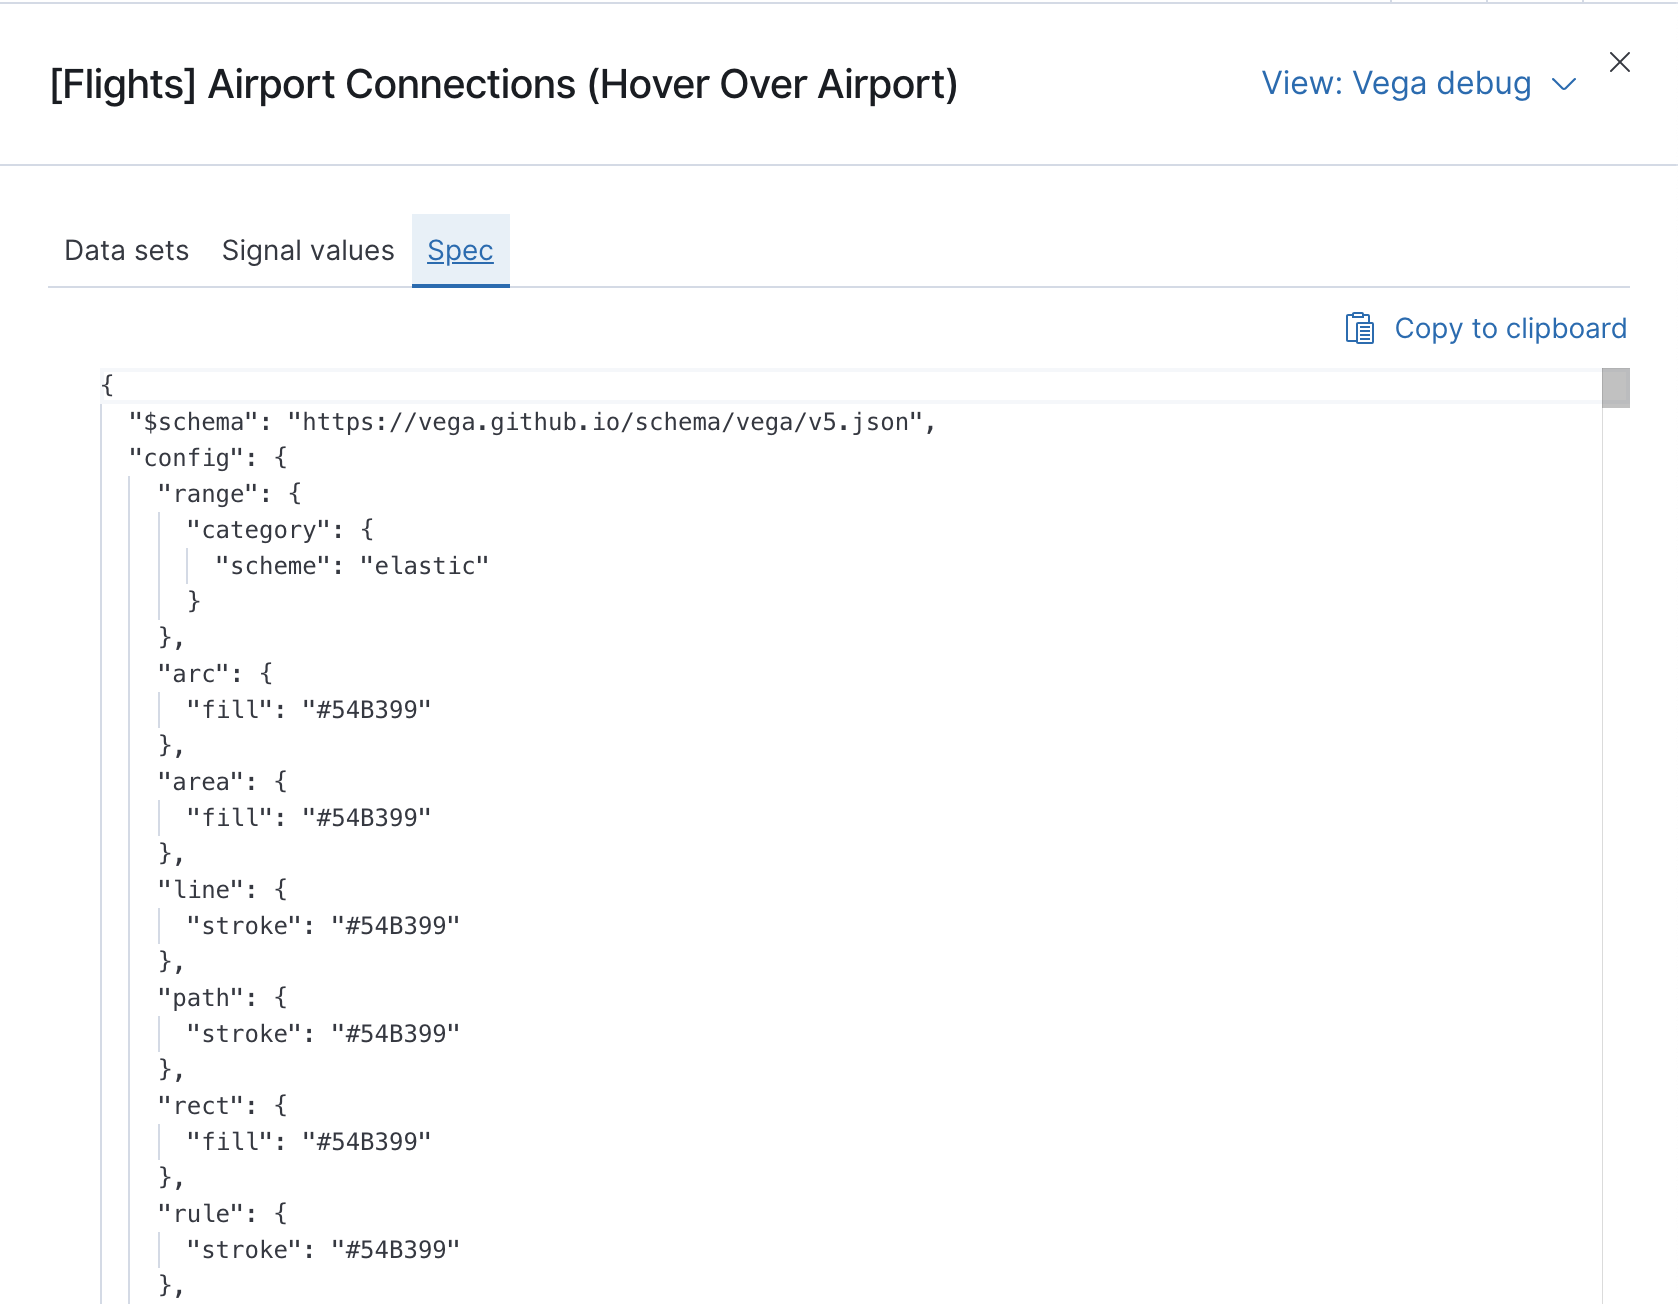
To copy the response, click Copy to clipboard. Paste the copied data to gist.github.com, possibly with a .json extension. Use the [raw] button, and share that when asking for help.
Browser debugging console
edit
[preview]
This functionality is in technical preview and may be changed or removed in a future release. Elastic will work to fix any issues, but features in technical preview are not subject to the support SLA of official GA features.
Use browser debugging tools (for example, F12 or Ctrl+Shift+J in Chrome) to
inspect the VEGA_DEBUG variable:
-
view— Access to the Vega View object. See Vega Debugging Guide on how to inspect data and signals at runtime. For Vega-Lite,VEGA_DEBUG.view.data('source_0')gets the pre-transformed data, andVEGA_DEBUG.view.data('data_0')gets the encoded data. For Vega, it uses the data name as defined in your Vega spec. -
vega_spec— Vega JSON graph specification after some modifications by Kibana. In case of Vega-Lite, this is the output of the Vega-Lite compiler. -
vegalite_spec— If this is a Vega-Lite graph, JSON specification of the graph before Vega-Lite compilation.
(Vega only) Expression functions which can update the time range and dashboard filters
editKibana has extended the Vega expression language with these functions:
/**
  * @param {object} query Elastic Query DSL snippet, as used in the query DSL editor
  * @param {string} [index] as defined in Kibana, or default if missing
  */
kibanaAddFilter(query, index)

/**
  * @param {object} query Elastic Query DSL snippet, as used in the query DSL editor
  * @param {string} [index] as defined in Kibana, or default if missing
  */
kibanaRemoveFilter(query, index)

kibanaRemoveAllFilters()

/**
  * Update dashboard time filter to the new values
  * @param {number|string|Date} start
  * @param {number|string|Date} end
  */
kibanaSetTimeFilter(start, end)
Additional configuration options
edit{
config: {
kibana: {
// Placement of the Vega-defined signal bindings.
// Can be `left`, `right`, `top`, or `bottom` (default).
controlsLocation: top
// Can be `vertical` or `horizontal` (default).
controlsDirection: vertical
// If true, hides most of Vega and Vega-Lite warnings
hideWarnings: true
// Vega renderer to use: `svg` or `canvas` (default)
renderer: canvas
}
}
}