Quick start: Get logs and metrics into the Elastic Stack
editQuick start: Get logs and metrics into the Elastic Stack
editThis functionality is in beta and is subject to change. The design and code is less mature than official GA features and is being provided as-is with no warranties. Beta features are not subject to the support SLA of official GA features.
This guide describes how to use the ingest management capabilities in the Elastic Stack to:
- Collect logs and metrics from systems and services across your organization
- Send the data to the Elastic Stack
- Explore and visualize the data in real-time
For feedback and questions, please contact us in the discuss forum.
Prerequisites
editBefore you begin, please read Limitations of this release.
You need Elasticsearch for storing and searching your data, and Kibana for visualizing and managing it. You can use our hosted Elasticsearch Service on Elastic Cloud (recommended), or self-manage the Elastic Stack on your own hardware.
Here’s what you need for each deployment type:
- Access to a deployment of our hosted Elasticsearch Service on Elastic Cloud. The Elasticsearch Service is available on AWS, GCP, and Azure. Try it out for free.
- User with the superuser role. See Built-in roles.
- Access to an Elasticsearch cluster and Kibana (version 7.9) with a basic license. Learn how to install the Elastic Stack on your own hardware.
-
Secure, encrypted connection between Kibana and Elasticsearch. See:
- Configuring security in Elasticsearch
- Configuring security in Kibana
-
Encrypt communications in Kibana
You can disable the TLS check by setting
xpack.ingestManager.fleet.tlsCheckDisabled: truein the Kibana configuration. For example, you might want to do this if Kibana is behind a proxy that terminates the SSL connection.
- User with the superuser role. See Built-in roles.
-
In the Elasticsearch configuration, the
built-in API key
service must be enabled.
(
xpack.security.authc.api_key.enabled: true) -
In the Kibana configuration, the saved objects encryption key
(
xpack.encryptedSavedObjects.encryptionKey) must be set to any alphanumeric value of at least 32 characters. Fleet requires this setting in order to save API keys and encrypt them in Kibana.
Step 1: Add integrations
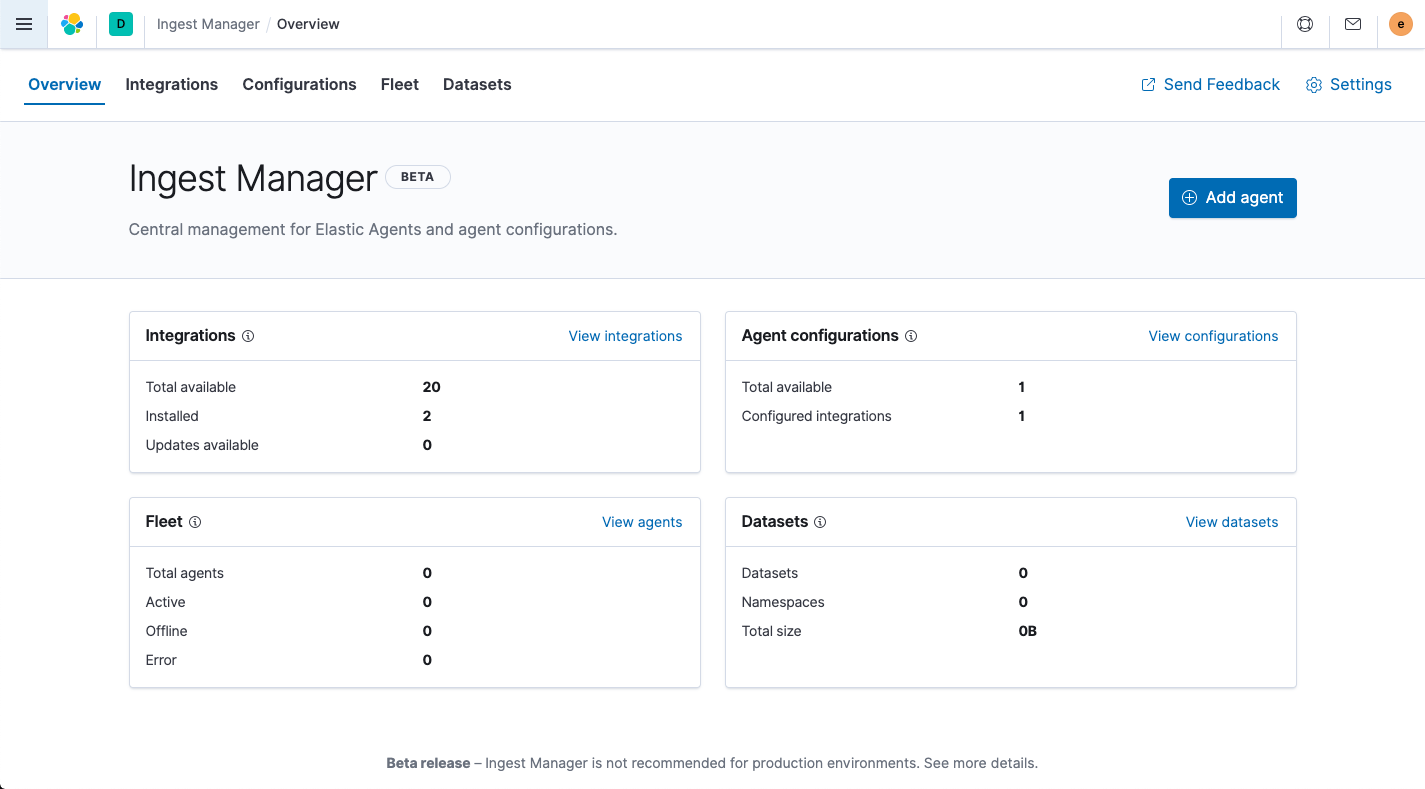
editIngest Manager provides integrations that bundle various assets needed to ingest and visualize data.
In this guide, we assume that you have nginx running on some of your
infrastructure, and want to collect logs and metrics from it. To do so:
-
Log in to Kibana and go to Management > Ingest Manager.
-
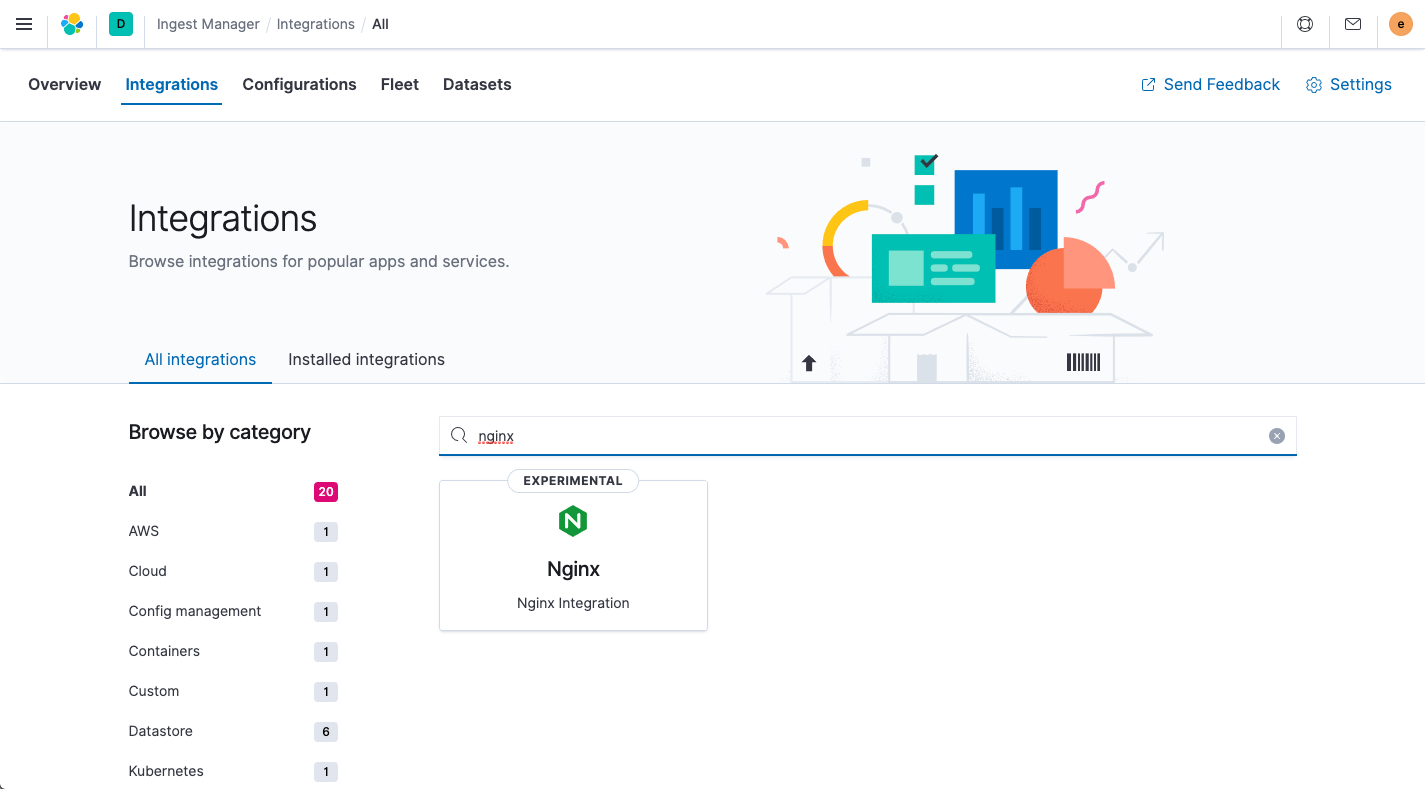
In Ingest Manager, click the Integrations tab and use the search bar to find the Nginx integration.
-
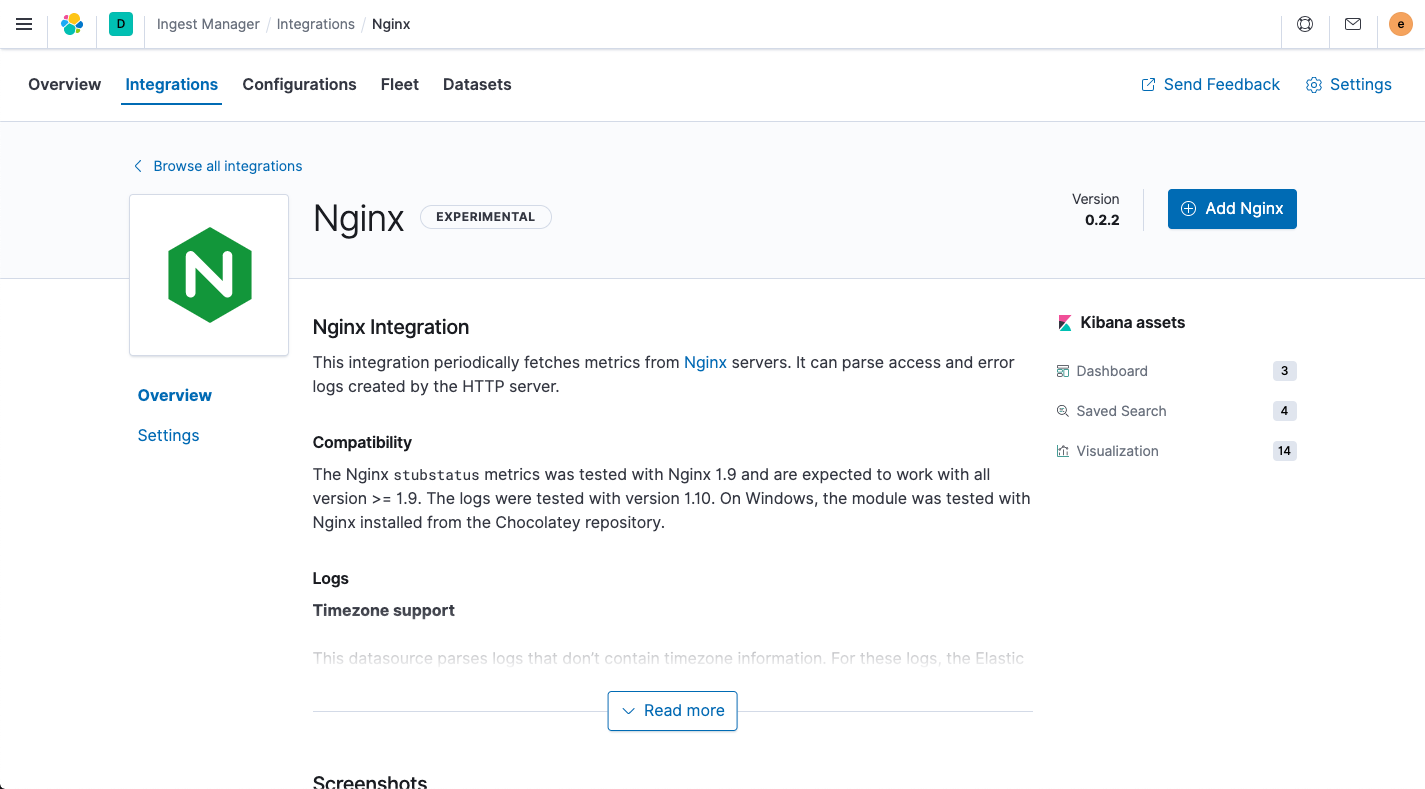
Click the Nginx integration to see more details about it, and then click Add Nginx.
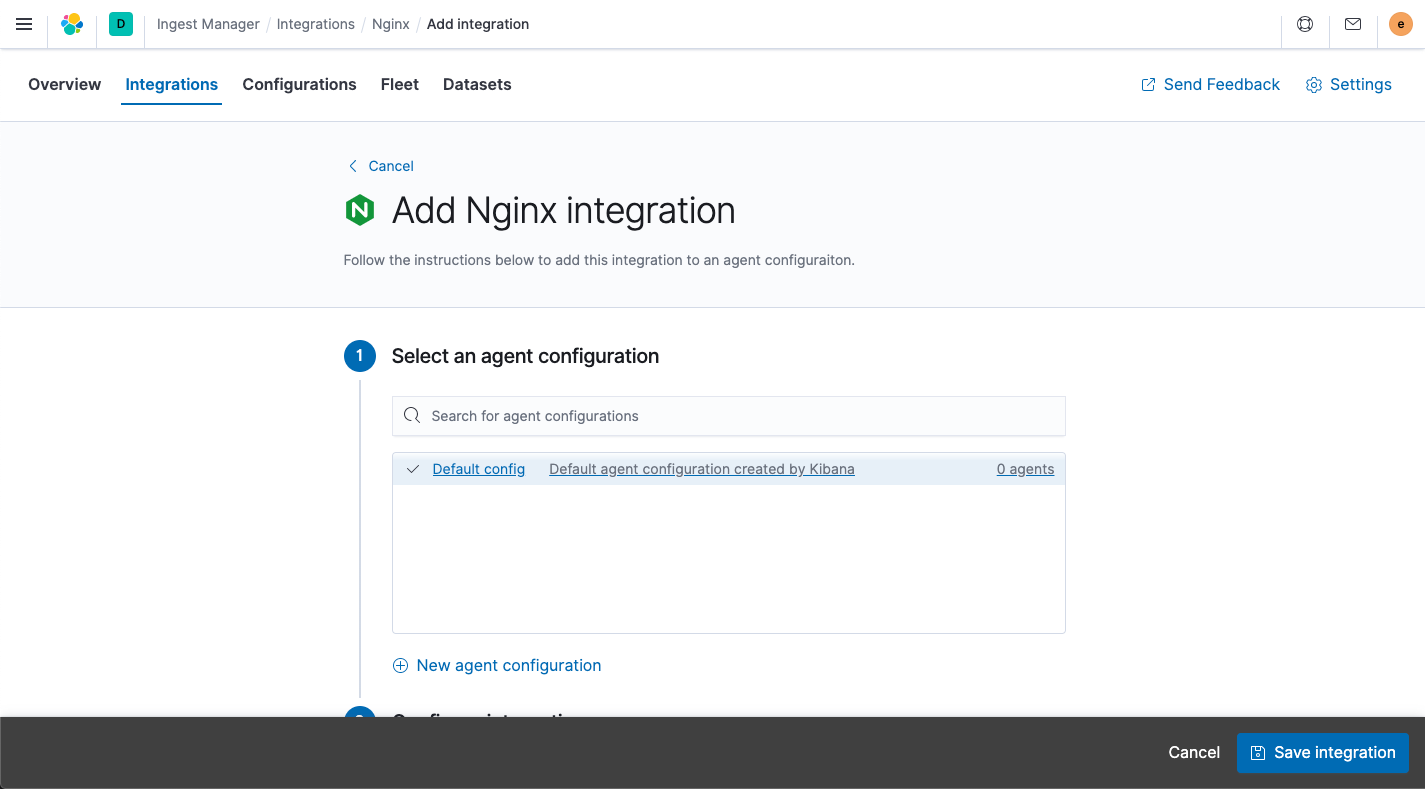
- On the Add Nginx integration page, click the default agent configuration to select it, then scroll down to inspect or change the default settings.
- If your logs are not in the default location, click the down arrow next to enabled streams and change the Paths field.
-
When you’re done, click Save integration.
-
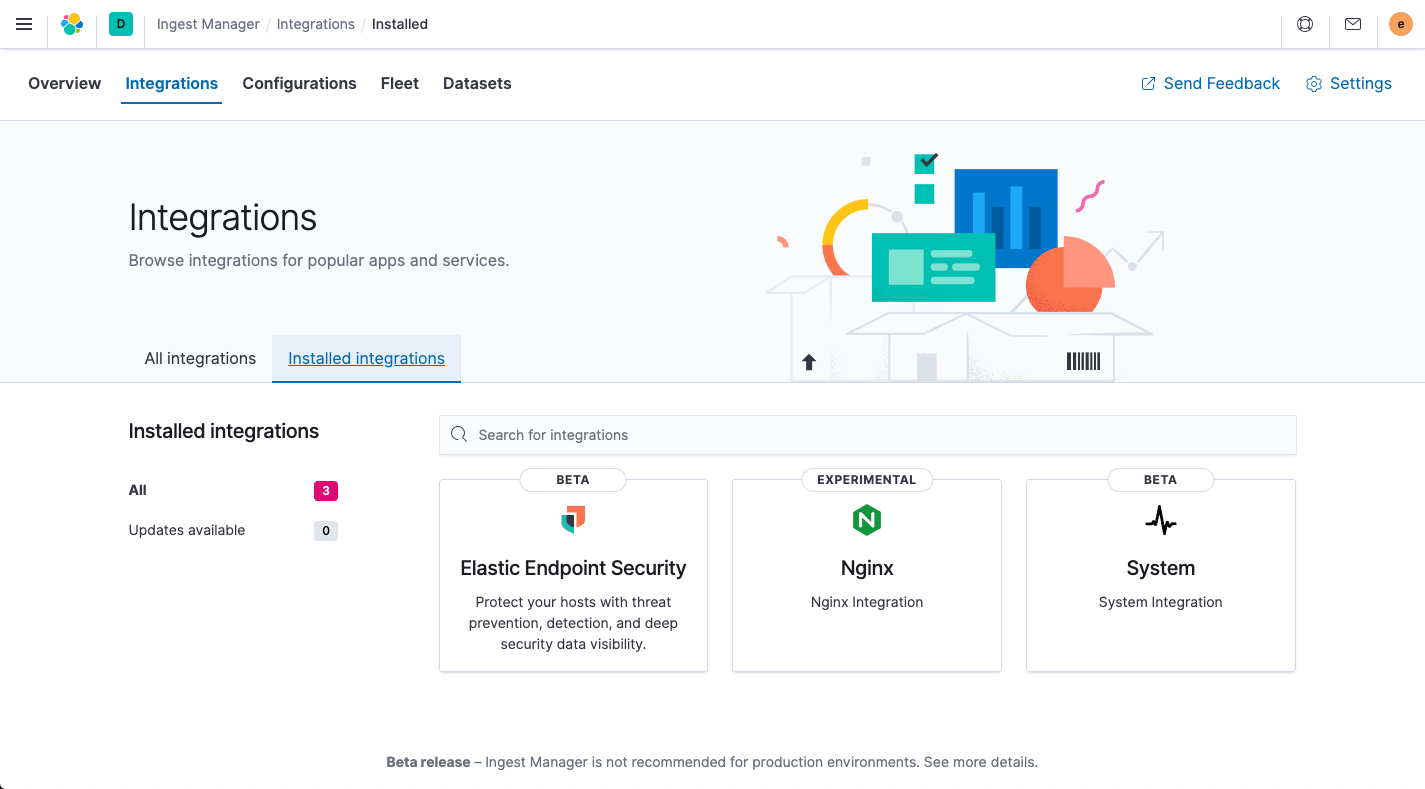
To verify that the integration is installed, click the Integrations tab and then click Installed Integrations.
The Nginx integration has been installed and should show up in this list. Note that the System and Elastic Endpoint Security integrations are installed by default.
-
Select the Configurations tab, and in the list of agent configurations, click Default config.
The newly added Nginx integration should appear under Integrations. Note that the
system-1integration has been created by default.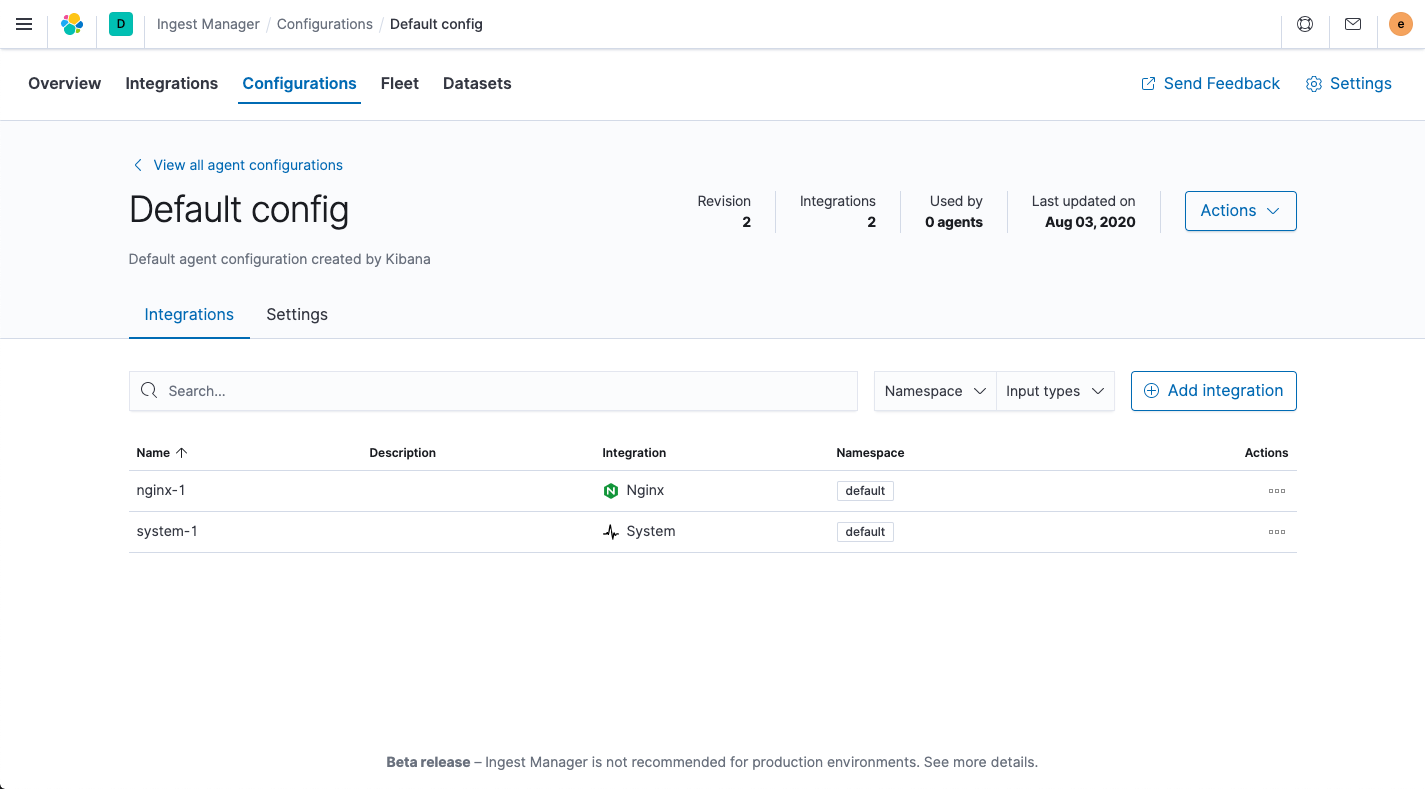
Step 3: Install and run Elastic Agent
editElastic Agent is a single, unified agent that you can deploy to hosts or containers to collect data and send it to the Elastic Stack. Behind the scenes, Elastic Agent runs the Beats shippers or Elastic Endpoint required for your configuration.
To download and install Elastic Agent, use the commands that work with your system:
curl -L -O https://artifacts.elastic.co/downloads/beats/elastic-agent/elastic-agent-7.9.3-amd64.deb
sudo dpkg -i elastic-agent-7.9.3-amd64.deb
curl -L -O https://artifacts.elastic.co/downloads/beats/elastic-agent/elastic-agent-7.9.3-x86_64.rpm
sudo rpm -vi elastic-agent-7.9.3-x86_64.rpm
curl -L -O https://artifacts.elastic.co/downloads/beats/elastic-agent/elastic-agent-7.9.3-darwin-x86_64.tar.gz
tar xzvf elastic-agent-7.9.3-darwin-x86_64.tar.gz
curl -L -O https://artifacts.elastic.co/downloads/beats/elastic-agent/elastic-agent-7.9.3-linux-x86_64.tar.gz
tar xzvf elastic-agent-7.9.3-linux-x86_64.tar.gz
We recommend that you use the DEB or RPM distribution, instead of the tarball, to ensure that Elastic Agent restarts automatically if the system is rebooted.
- Download the Elastic Agent Windows zip file from the downloads page.
-
Extract the contents of the zip file into
C:\Program Files. -
Rename the
elastic-agent-<version>-windowsdirectory toElastic-Agent.
See the download page for other installation options.
After the download is complete, decide which mode you want to run in: Fleet or standalone. What’s the difference?
- With Fleet mode, you use Ingest Manager in Kibana to define and manage Elastic Agent configurations from a central location.
- With standalone mode, you configure Elastic Agent manually on the system where the agent is installed.
Fleet mode
editTo use Fleet to configure Elastic Agent:
-
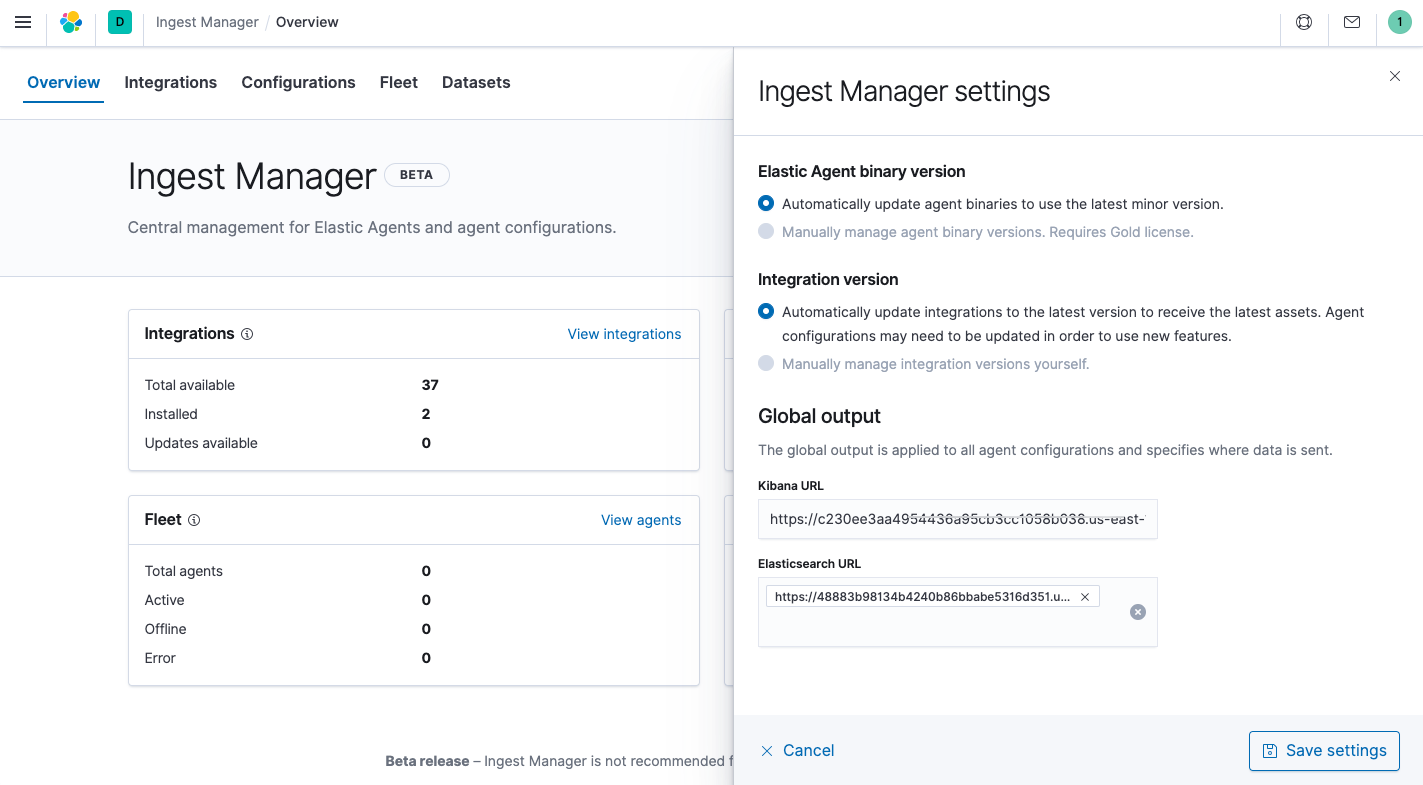
In Ingest Manager, click Settings and change the defaults, if necessary. For self-managed installations, set the URLs for Elasticsearch and Kibana, including the http ports, then save your changes.
-
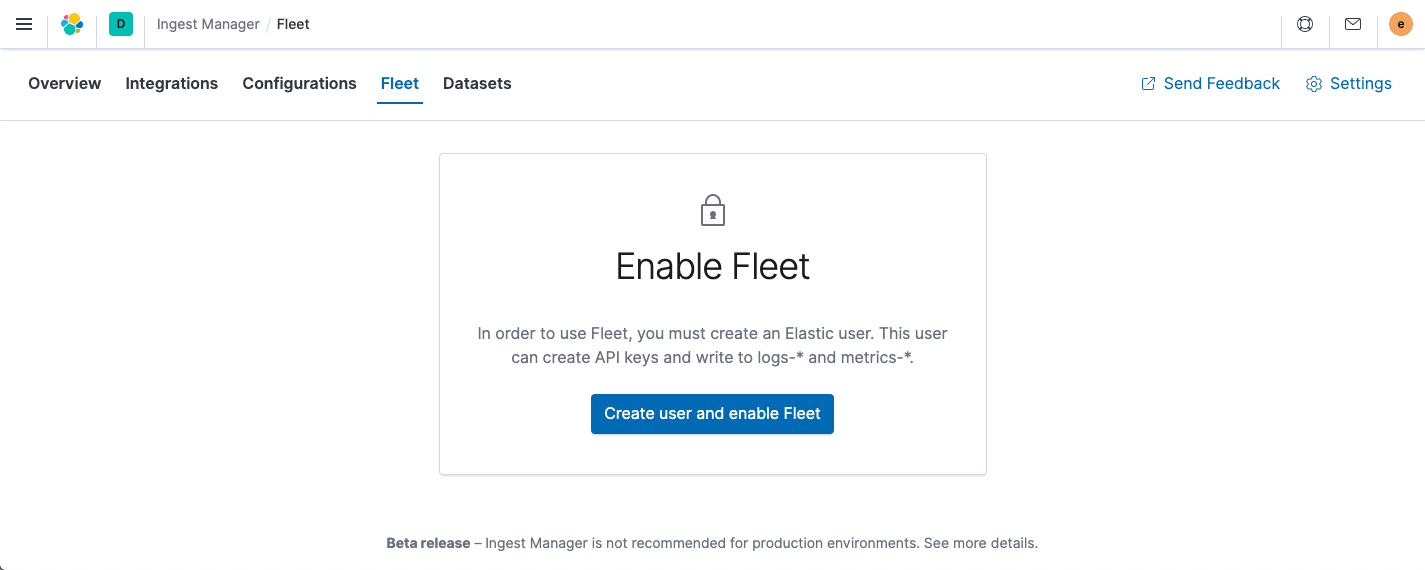
Enable Fleet. Click the Fleet tab and click Create user and enable Fleet.
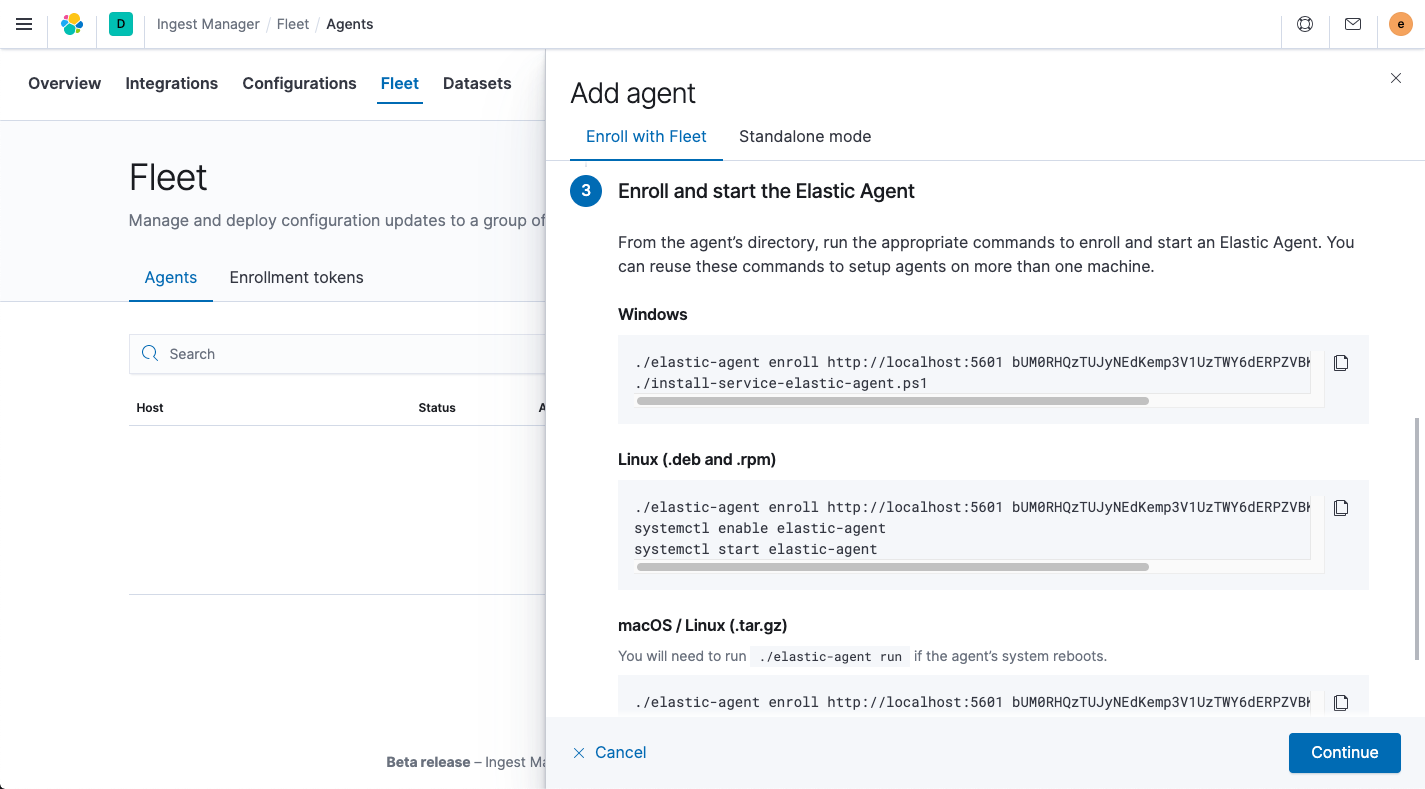
- On the Fleet tab, click Add agent and complete the steps under Enroll with Fleet. Skip the first step because you downloaded Elastic Agent earlier.
- Select an agent configuration (or accept the default).
-
Copy the command for enrolling the agent.
The copied command contains your Kibana URL and an enrollment key that was generated by Ingest Manager.
-
In the directory where Elastic Agent is installed, run the command you copied. Note that this command will overwrite the
elastic-agent.ymlfile in that directory.We recommend that you run this command as the root user because some integrations require root privileges to collect sensitive data.
elastic-agent enroll KIBANA_URL ENROLLMENT_KEY
Where
KIBANA_URLis the Kibana URL where Fleet is running, andENROLLMENT_KEYis the enrollment token acquired from Fleet.We recommend that you run this command as the root user because some integrations require root privileges to collect sensitive data.
elastic-agent enroll KIBANA_URL ENROLLMENT_KEY
Where
KIBANA_URLis the Kibana URL where Fleet is running, andENROLLMENT_KEYis the enrollment token acquired from Fleet.We recommend that you run this command as the root user because some integrations require root privileges to collect sensitive data.
./elastic-agent enroll KIBANA_URL ENROLLMENT_KEY
Where
KIBANA_URLis the Kibana URL where Fleet is running, andENROLLMENT_KEYis the enrollment token acquired from Fleet.Open a PowerShell prompt as an Administrator (right-click the PowerShell icon and select Run As Administrator).
From the PowerShell prompt, change to the directory where you installed Elastic Agent, and run:
.\elastic-agent.exe enroll KIBANA_URL ENROLLMENT_KEY
Where
KIBANA_URLis the Kibana URL where Fleet is running, andENROLLMENT_KEYis the enrollment token acquired from Fleet. -
Run Elastic Agent:
The DEB package includes a service unit for Linux systems with systemd. On these systems, you can manage Elastic Agent by using the usual systemd commands:
systemctl enable elastic-agent
systemctl start elastic-agent
Otherwise, use:
sudo service elastic-agent start
Elastic Agent will restart automatically if the system is rebooted.
The RPM package includes a service unit for Linux systems with systemd. On these systems, you can manage Elastic Agent by using the usual systemd commands:
systemctl enable elastic-agent
systemctl start elastic-agent
Otherwise, use:
sudo service elastic-agent start
Elastic Agent will restart automatically if the system is rebooted.
./elastic-agent run
This command starts Elastic Agent in the foreground. You must restart Elastic Agent manually if the agent terminates or the system is rebooted.
To start the agent automatically when the system is rebooted, Install the agent as a service.
./elastic-agent run
This command starts Elastic Agent in the foreground. You must restart Elastic Agent manually if the agent terminates or the system is rebooted.
To start the agent automatically when the system is rebooted, use the DEB or RPM package instead of the tarball.
The first time you run Elastic Agent, you need to install it as auto-starting Windows service. To do this, run the PowerShell script provided in the archive you downloaded:
- Open a PowerShell prompt as an Administrator (right-click the PowerShell icon and select Run As Administrator).
-
From the PowerShell prompt, run the following commands to install Elastic Agent as an service and start the service:
You must run Elastic Agent under the SYSTEM account if you plan to use the Elastic Endpoint integration.
If script execution is disabled on your system, set the execution policy for the current session to allow the script to run. For example:
PowerShell.exe -ExecutionPolicy UnRestricted -File .\install-service-elastic-agent.ps1.If the service stops and you need to restart it manually, run:
Start-Service elastic-agent
Elastic Agent will restart automatically if the system is rebooted.
-
In Ingest Manager, click Continue to go to the Fleet tab, where you should see the newly enrolled agent.
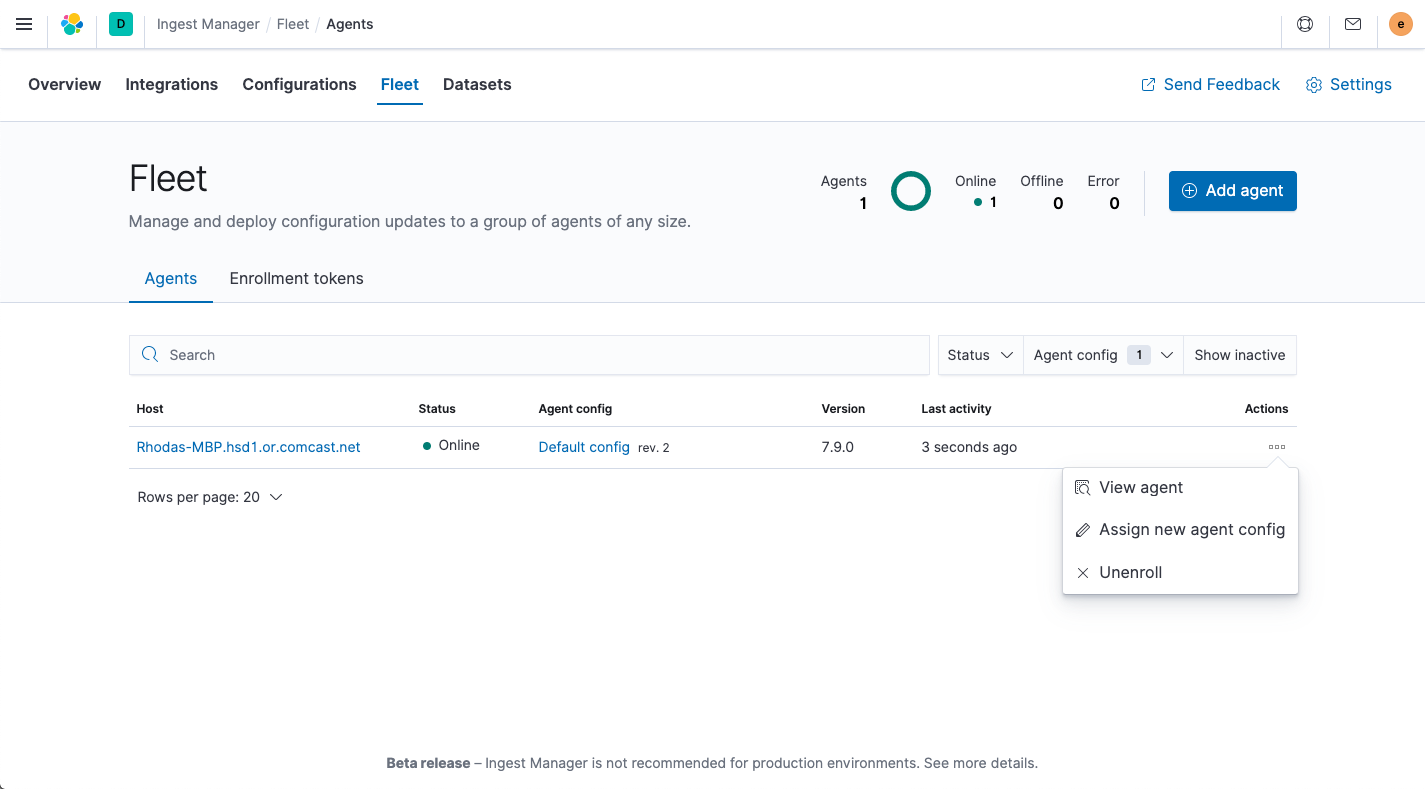
If you run into problems, see Troubleshoot common problems.
To unenroll an agent, see Unenroll Elastic Agent.
Standalone mode (manual configuration)
editTo configure Elastic Agent manually:
- On the Fleet tab, click Add agent and complete the steps under Standalone mode. Skip the first step because you downloaded Elastic Agent earlier.
- Select an agent configuration (or accept the default).
-
Copy the content of the agent configuration and put it into a file named
elastic-agent.ymlon the system where Elastic Agent is installed.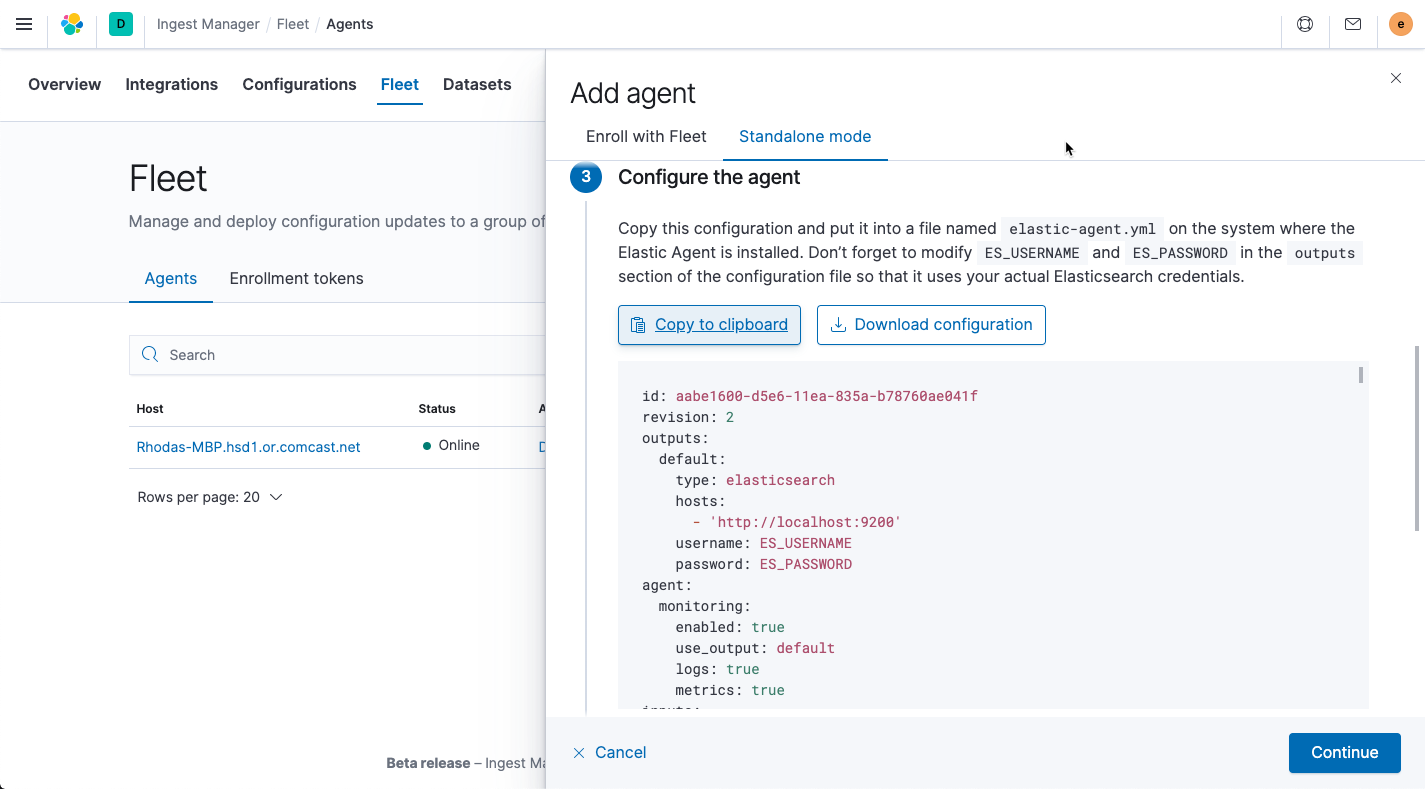
The configuration file generated by Ingest Manager already contains the correct Elasticsearch address and port for your setup. If you run everything locally, the address is
127.0.0.1:9200. If you use our hosted Elasticsearch Service on Elastic Cloud, the address corresponds to the Elasticsearch endpoint URL that you can copy from the Overview page of your deployment. -
Change the Elasticsearch username and password in the
outputssection of the configuration file:[...] outputs: default: type: elasticsearch hosts: - 'HOST:PORT' username: ES_USERNAME password: ES_PASSWORD datasources: [...] -
Run Elastic Agent:
The DEB package includes a service unit for Linux systems with systemd. On these systems, you can manage Elastic Agent by using the usual systemd commands:
systemctl enable elastic-agent
systemctl start elastic-agent
Otherwise, use:
sudo service elastic-agent start
Elastic Agent will restart automatically if the system is rebooted.
The RPM package includes a service unit for Linux systems with systemd. On these systems, you can manage Elastic Agent by using the usual systemd commands:
systemctl enable elastic-agent
systemctl start elastic-agent
Otherwise, use:
sudo service elastic-agent start
Elastic Agent will restart automatically if the system is rebooted.
./elastic-agent run
This command starts Elastic Agent in the foreground. You must restart Elastic Agent manually if the agent terminates or the system is rebooted.
To start the agent automatically when the system is rebooted, Install the agent as a service.
./elastic-agent run
This command starts Elastic Agent in the foreground. You must restart Elastic Agent manually if the agent terminates or the system is rebooted.
To start the agent automatically when the system is rebooted, use the DEB or RPM package instead of the tarball.
The first time you run Elastic Agent, you need to install it as auto-starting Windows service. To do this, run the PowerShell script provided in the archive you downloaded:
- Open a PowerShell prompt as an Administrator (right-click the PowerShell icon and select Run As Administrator).
-
From the PowerShell prompt, run the following commands to install Elastic Agent as an service and start the service:
You must run Elastic Agent under the SYSTEM account if you plan to use the Elastic Endpoint integration.
If script execution is disabled on your system, set the execution policy for the current session to allow the script to run. For example:
PowerShell.exe -ExecutionPolicy UnRestricted -File .\install-service-elastic-agent.ps1.If the service stops and you need to restart it manually, run:
Start-Service elastic-agent
Elastic Agent will restart automatically if the system is rebooted.
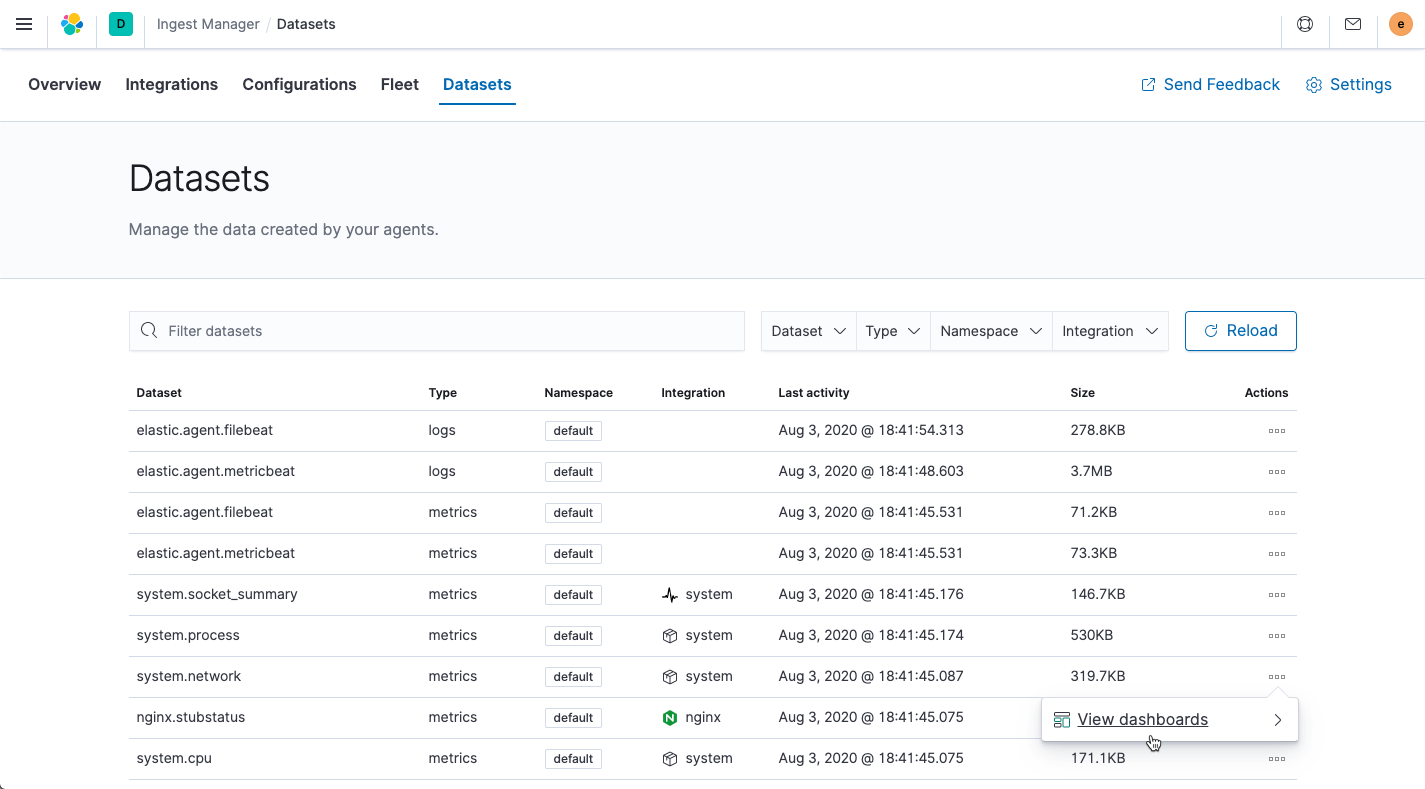
Step 4: View your data
editIn Ingest Manager, click the Datasets tab to inspect the data that is sent by Elastic Agent. From the Actions column, you can navigate to the dashboards corresponding to the data type that is sent.
What’s next?
editNow that you have your logs streaming into Elasticsearch, learn how to unify your logs, metrics, uptime, and application performance data by using Elastic Observability.