Get started with ingest management
editGet started with ingest management
editThis functionality is in technical preview and may be changed or removed in a future release. Elastic will work to fix any issues, but features in technical preview are not subject to the support SLA of official GA features.
This experimental release allows you to try out new capabilities. There is no migration path for future releases. You must test in a dedicated cluster. Delete the cluster when you are done. You will not be able to upgrade the cluster.
This guide describes how to get started with the new ingest management capabilities available in this release.
For feedback and questions, please contact us in the discuss forum.
Prerequisites
editBefore you begin, please read Limitations of this release.
To use this experimental release of ingest management, you need:
- An Elasticsearch cluster and Kibana (version 7.8) with a basic license. You can use our hosted Elasticsearch Service on Elastic Cloud, or install the Elastic Stack on your own hardware.
- A user with the superuser role. See Built-in roles.
-
On self-managed clusters, you must configure security and encryption settings. If you’re using our hosted Elasticsearch Service on Elastic Cloud, these settings are already enabled.
-
In your Elasticsearch configuration:
-
Configure Elasticsearch security. Set
xpack.security.enabledtotrue. -
Enable the built-in API key service.
Set
xpack.security.authc.api_key.enabledtotrue.
-
Configure Elasticsearch security. Set
-
In your Kibana configuration:
-
Configure Kibana security. Set
xpack.security.enabledtotrue. -
Configure TLS. As an alternative, you can
disable the TLS check by setting
xpack.ingestManager.fleet.tlsCheckDisabledtotrue. For example, you might want to disable TLS checking if Kibana is behind a proxy that terminates the SSL connection. -
Set
xpack.encryptedSavedObjects.encryptionKeyto any alphanumeric value of at least 32 characters. For example:xpack.encryptedSavedObjects.encryptionKey: "something_at_least_32_characters". Fleet requires this setting in order to save API keys and encrypt them in Kibana.
-
Configure Kibana security. Set
-
Step 1: Enable ingest management
editTo enable ingest management:
-
Add the following setting to the Kibana configuration:
xpack.ingestManager.enabled: true
- On our hosted Elasticsearch Service on Elastic Cloud, add the setting to the Kibana user settings as described in Add Kibana user settings.
- On a self-managed stack, add the setting to the Kibana configuration as described in Ingest Manager settings.
-
Verify that ingest management has been correctly enabled:
-
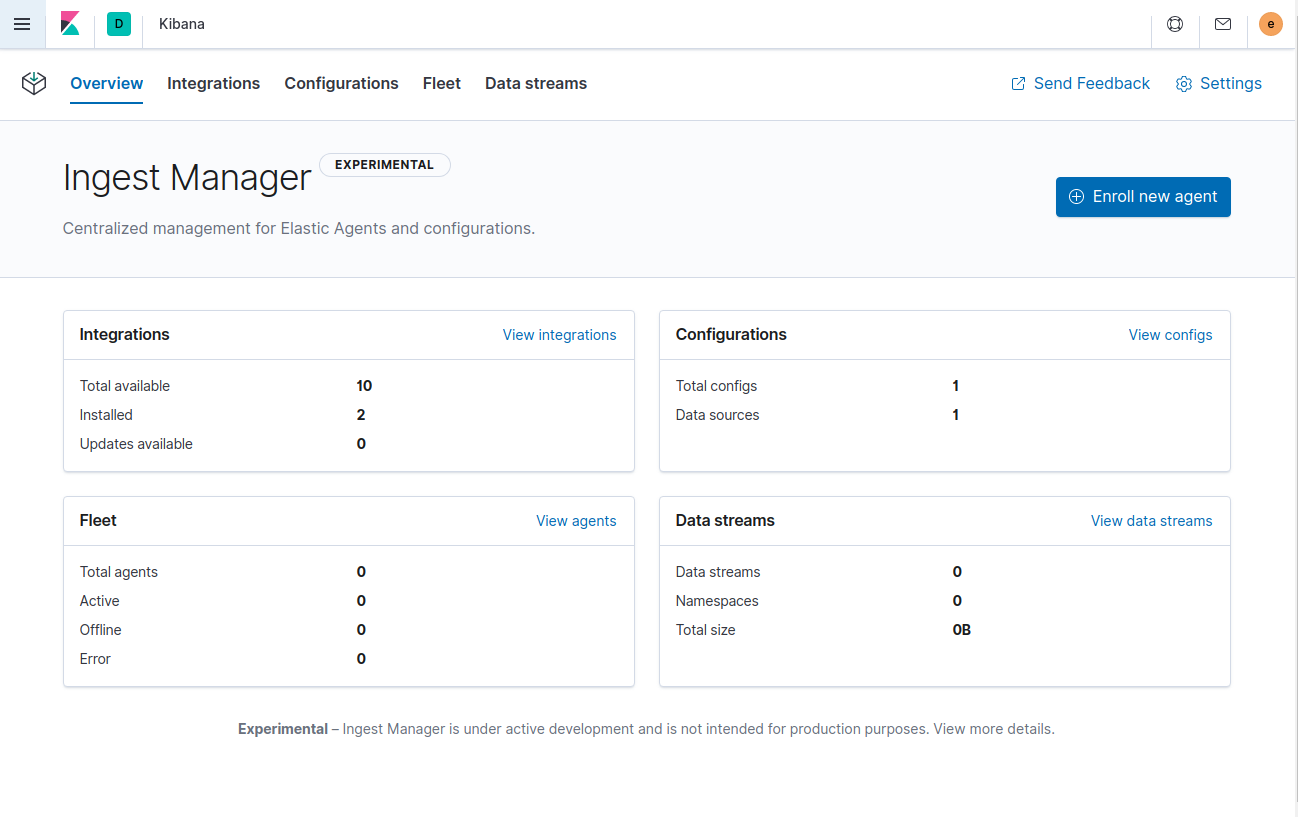
Log in to Kibana and go to Management > Ingest Manager.
If the menu entry is visible, and you see the following start page for Ingest Manager, ingest management is successfully enabled.
-
Step 2: Install an integration and create a data source
editIngest Manager provides integrations that bundle various assets needed to ingest and visualize data.
In this guide, we assume that you have nginx running on some of your
infrastructure, and want to collect logs and metrics from it. To do so:
-
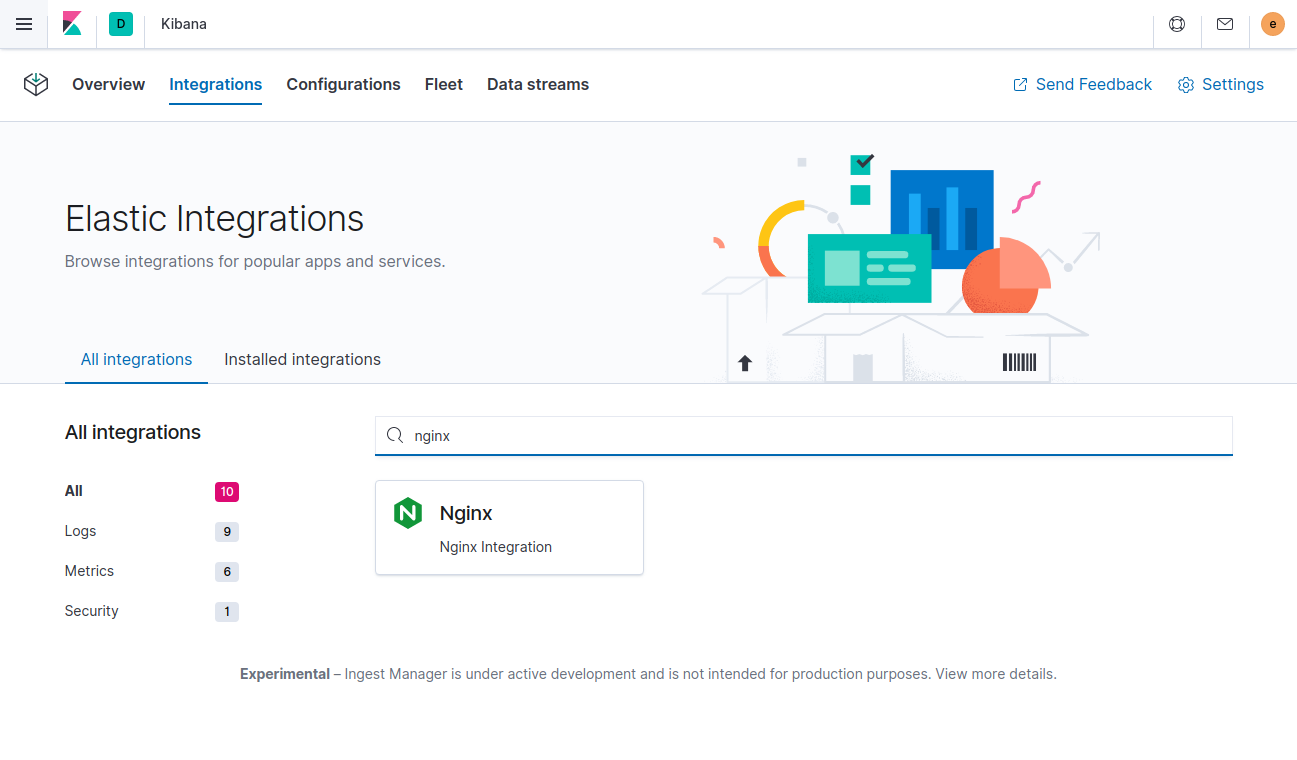
In the Ingest Manager app, click the Integrations tab and use the search bar to find the Nginx integration.
-
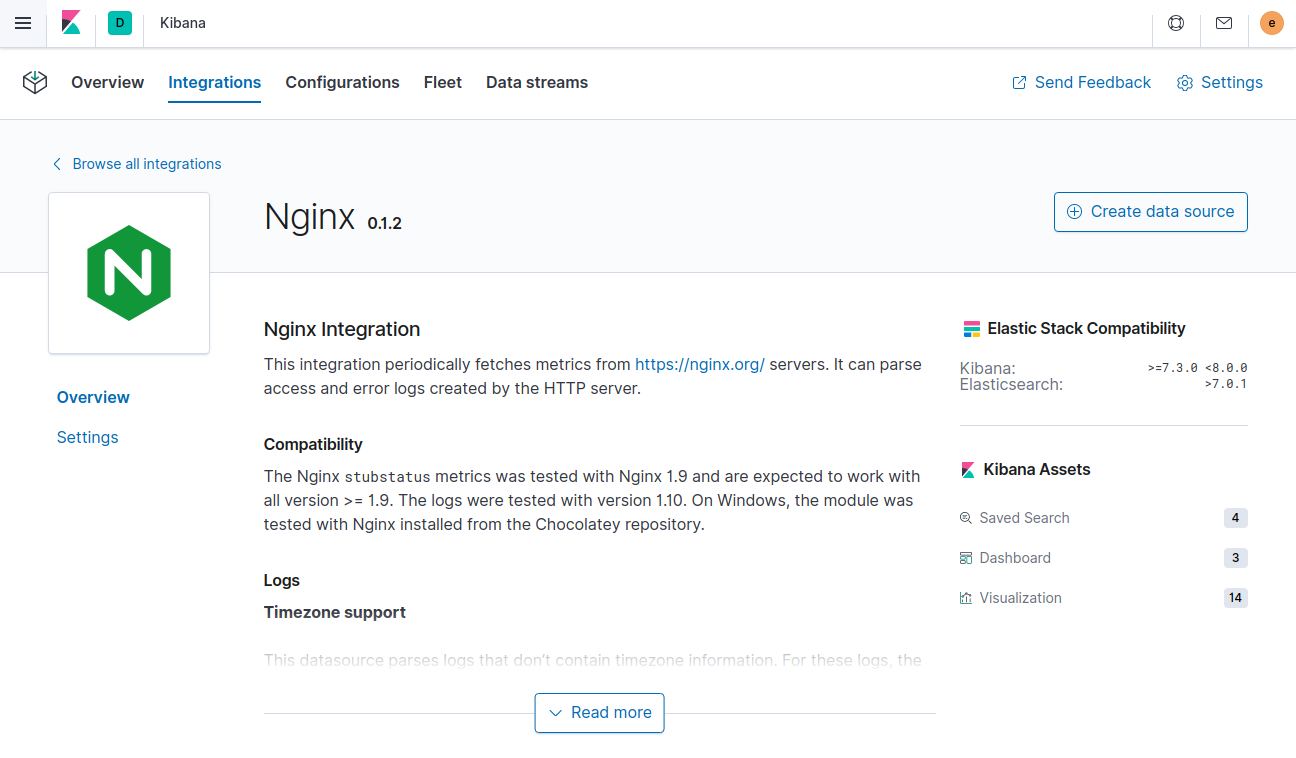
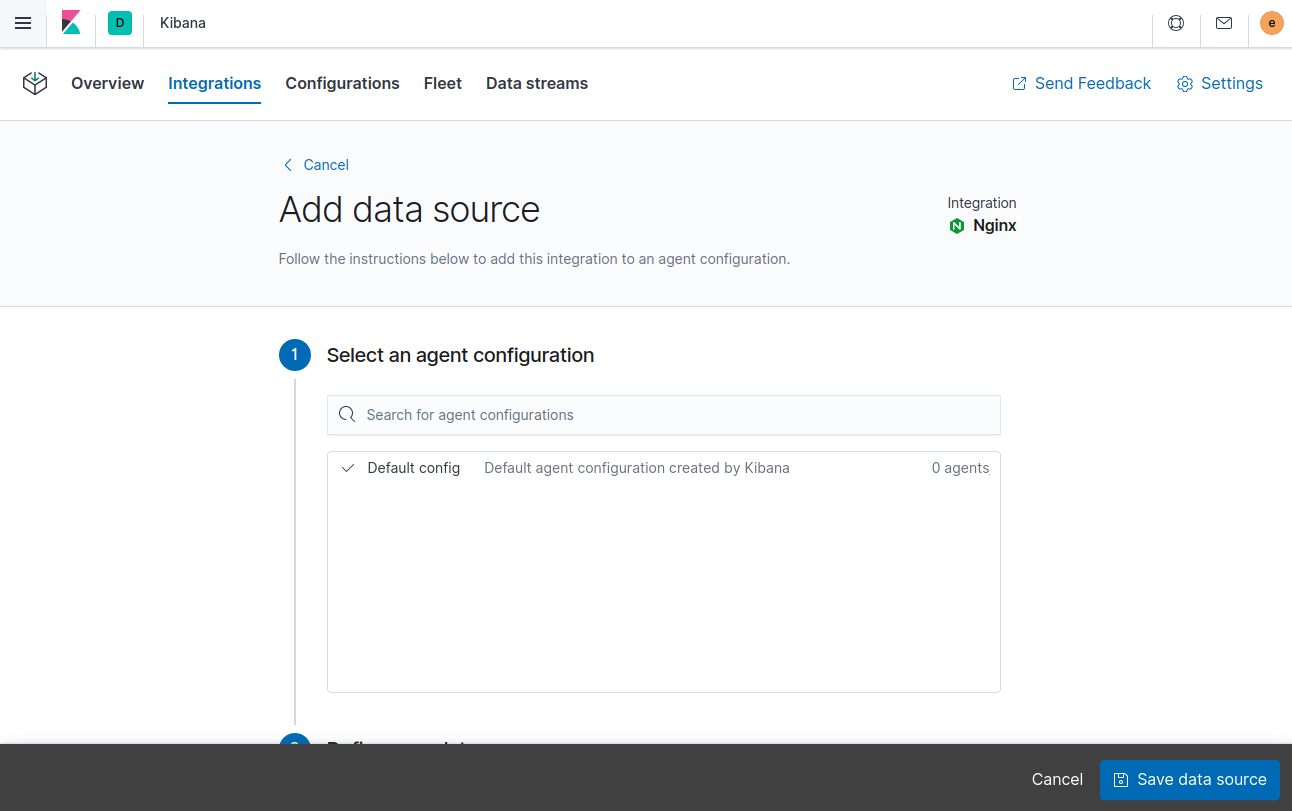
Click the Nginx integration to see more details about it, and then click Create data source.
- On the Add data source page, click the default Agent configuration to select it, then scroll down to inspect or change the default settings.
- If your logs are not in the default location, click the down arrow next to enabled streams and change the Paths field.
-
When you’re done, click Save data source.
-
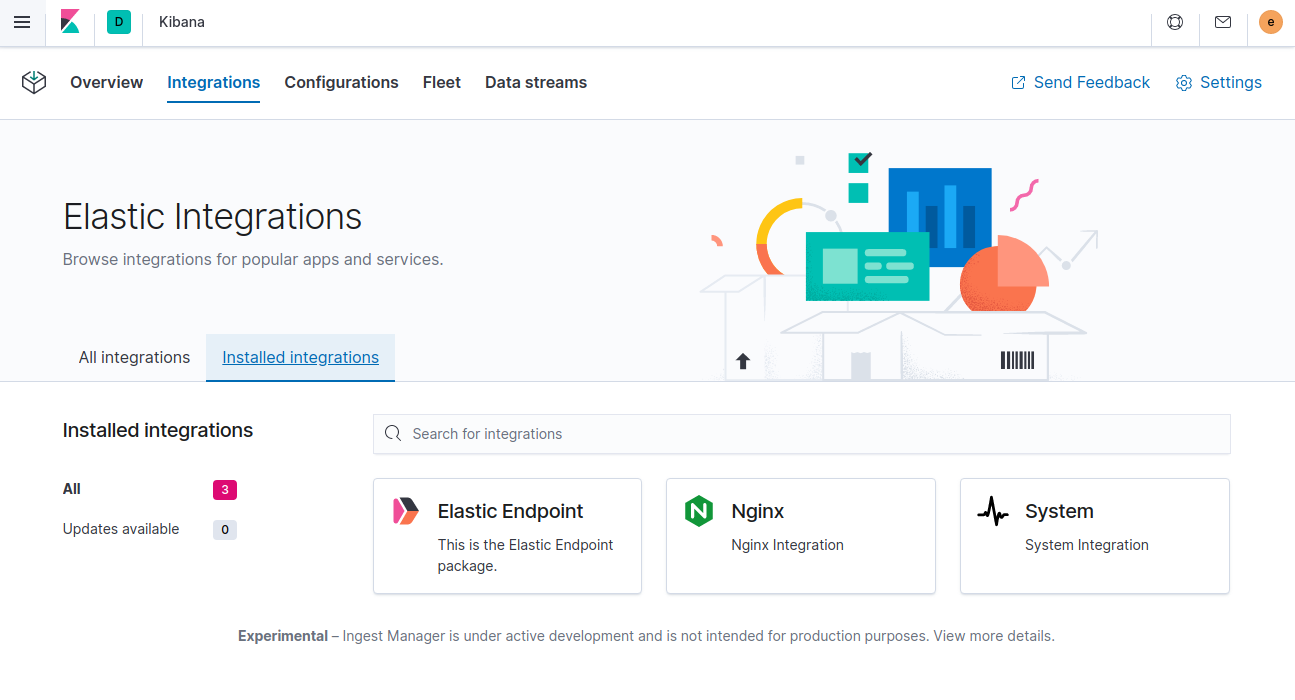
To verify that the integration is installed, click the Integrations tab and then click Installed Integrations.
The Nginx integration has been installed and should show up in this list. Note that the System and Elastic Endpoint integrations are installed by default.
-
Select the Configurations tab, and in the Agent configurations list, click the default config.
The newly created data source should appear on the Data sources tab. Note that the
system-1data source has been created by default.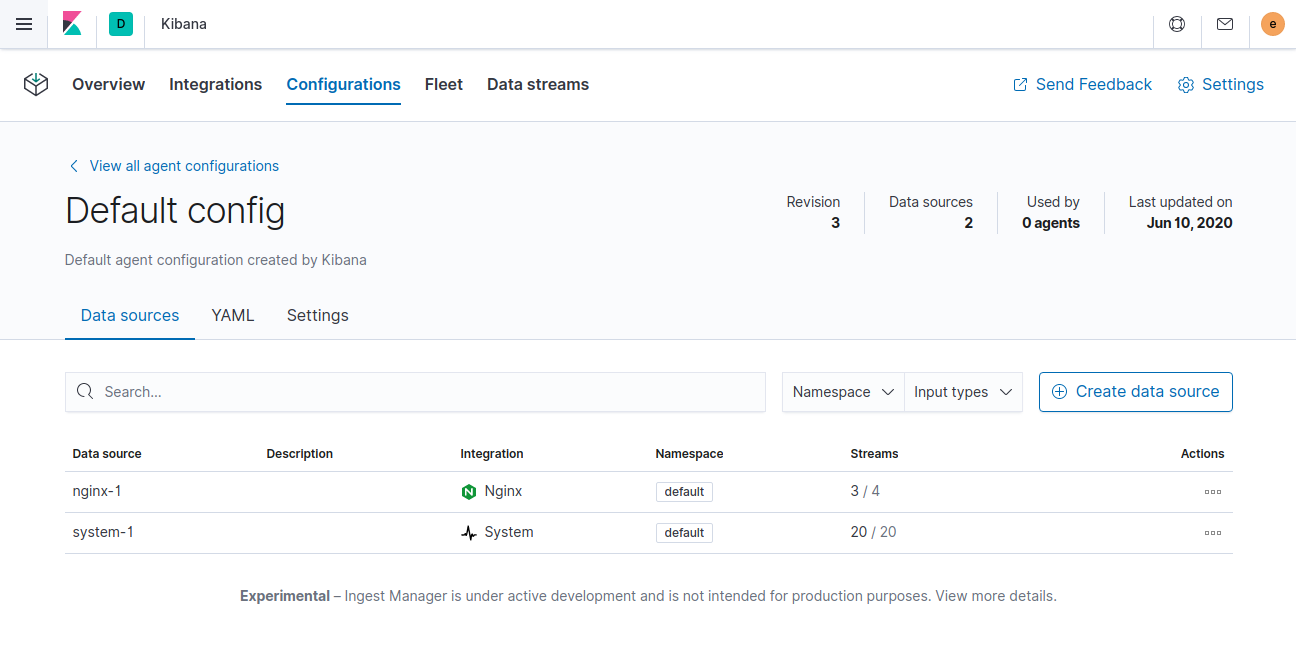
Step 3: Install and run Elastic Agent
editElastic Agent is a single, unified agent that you can deploy to hosts or containers to collect data and send it to the Elastic Stack. Behind the scenes, Elastic Agent runs the Beats shippers or Endpoint required for your configuration.
To download and install Elastic Agent, use the commands that work with your system:
mac:
curl -L -O https://artifacts.elastic.co/downloads/beats/elastic-agent/elastic-agent-7.8.1-darwin-x86_64.tar.gz
tar xzvf elastic-agent-7.8.1-darwin-x86_64.tar.gz
linux:
curl -L -O https://artifacts.elastic.co/downloads/beats/elastic-agent/elastic-agent-7.8.1-linux-x86_64.tar.gz
tar xzvf elastic-agent-7.8.1-linux-x86_64.tar.gz
win:
- Download the Elastic Agent Windows zip file from the downloads page.
-
Extract the contents of the zip file into
C:\Program Files. -
Rename the
elastic-agent-<version>-windowsdirectory toElastic-Agent. - Open a PowerShell prompt as an Administrator (right-click the PowerShell icon and select Run As Administrator).
-
From the PowerShell prompt, run the following commands to install Filebeat as a Windows service:
PS > cd 'C:\Program Files\Elastic-Agent'
PS C:\Program Files\Elastic-Agent> .\install-service-elastic-agent.ps1
If script execution is disabled on your system, you need to set the execution policy for the current session to allow the script to run. For example: PowerShell.exe -ExecutionPolicy UnRestricted -File .\install-service-elastic-agent.ps1.
To configure Elastic Agent, you can use the Ingest Manager app in Kibana (see Fleet mode), or configure it manually (see Standalone mode).
Fleet mode
editTo use Fleet to configure Elastic Agent:
-
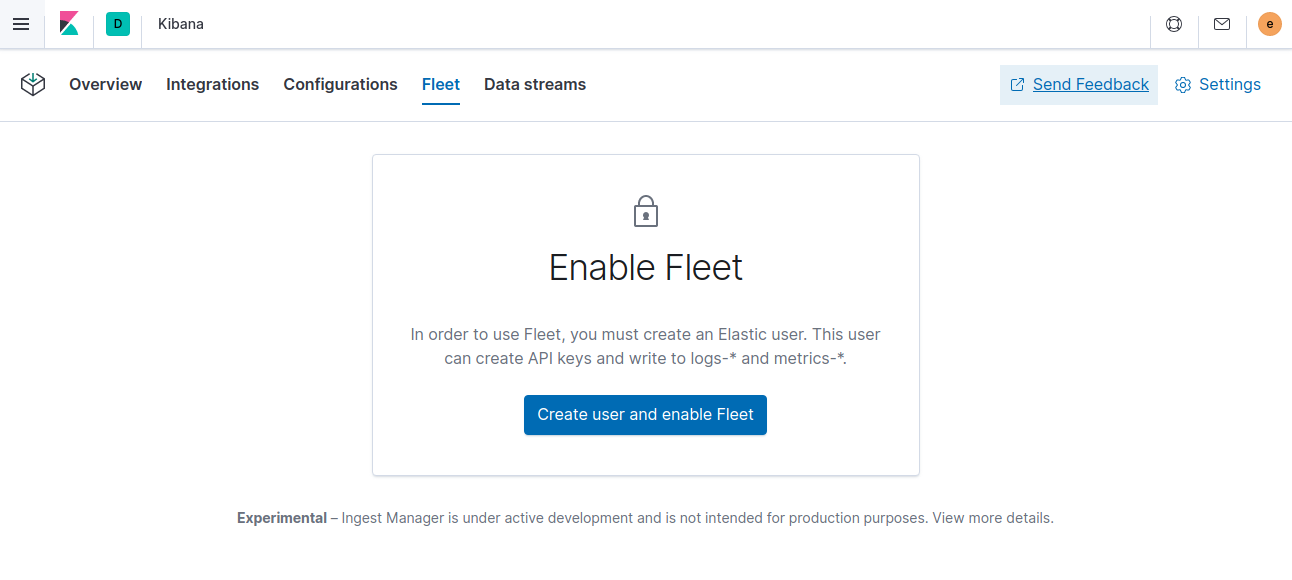
Enable Fleet in the Ingest Manager app. To do so, click the Fleet tab and click Create user and enable Fleet.
-
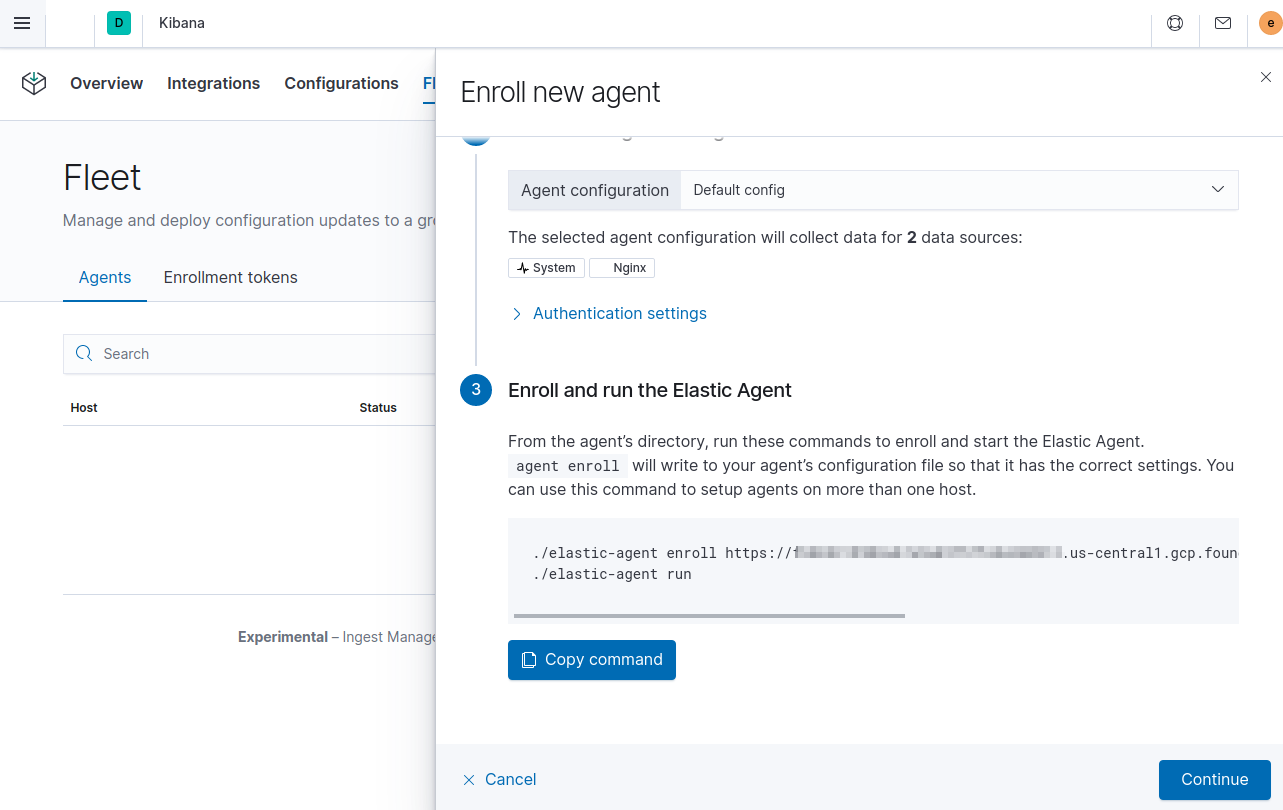
On the Fleet tab, click Enroll new agent to start the enrollment. Select an Agent configuration (or accept the default) and copy the command for enrolling the Agent.
The copied command contains your Kibana URL and an enrollment key that was generated by the Ingest Manager app.
-
In the directory where you installed Elastic Agent, paste the command to enroll the Agent. Note that this command will overwrite the
elastic-agent.ymlfile in that directory../elastic-agent enroll KIBANA_URL ENROLLMENT_KEY The Elastic Agent is currently in Experimental and should not be used in production This will replace your current settings. Do you want to continue? [Y/n]:
-
Run the Agent:
./elastic-agent run
-
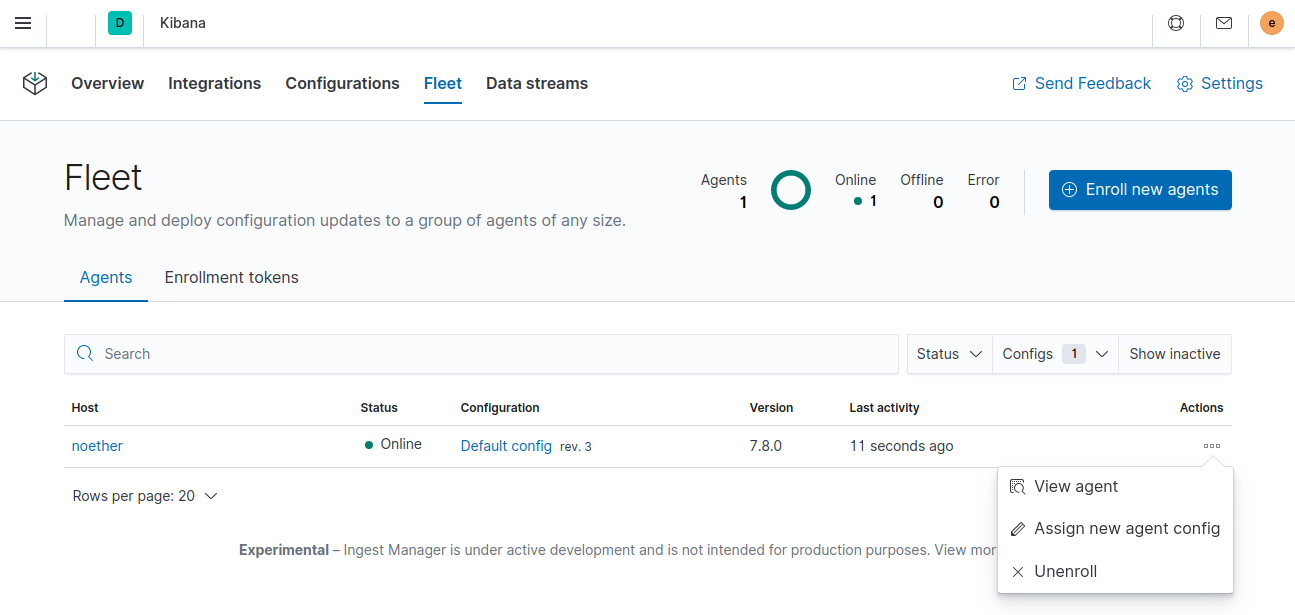
In the Ingest Manager app, click Continue to go to the Fleet tab, where you should see the newly enrolled Agent.
If you run into problems, see Troubleshooting.
To unenroll an Agent, choose Unenroll from the Actions
menu for the Agent. This will invalidate the API key the Agent uses to
connect to Elasticsearch. The Elastic Agent will continue to run, but will not be able to send
data. It will show this error instead:
invalid api key to authenticate with fleet.
Standalone mode (manual configuration)
editTo configure Elastic Agent manually:
- In the Ingest Manager app, click the Configurations tab, and in the Agent configurations list, click the default config.
-
Select the YAML tab to see the configuration for Elastic Agent. Copy the content and put it into a file named
elastic-agent-standalone.ymlon the system where Elastic Agent is installed.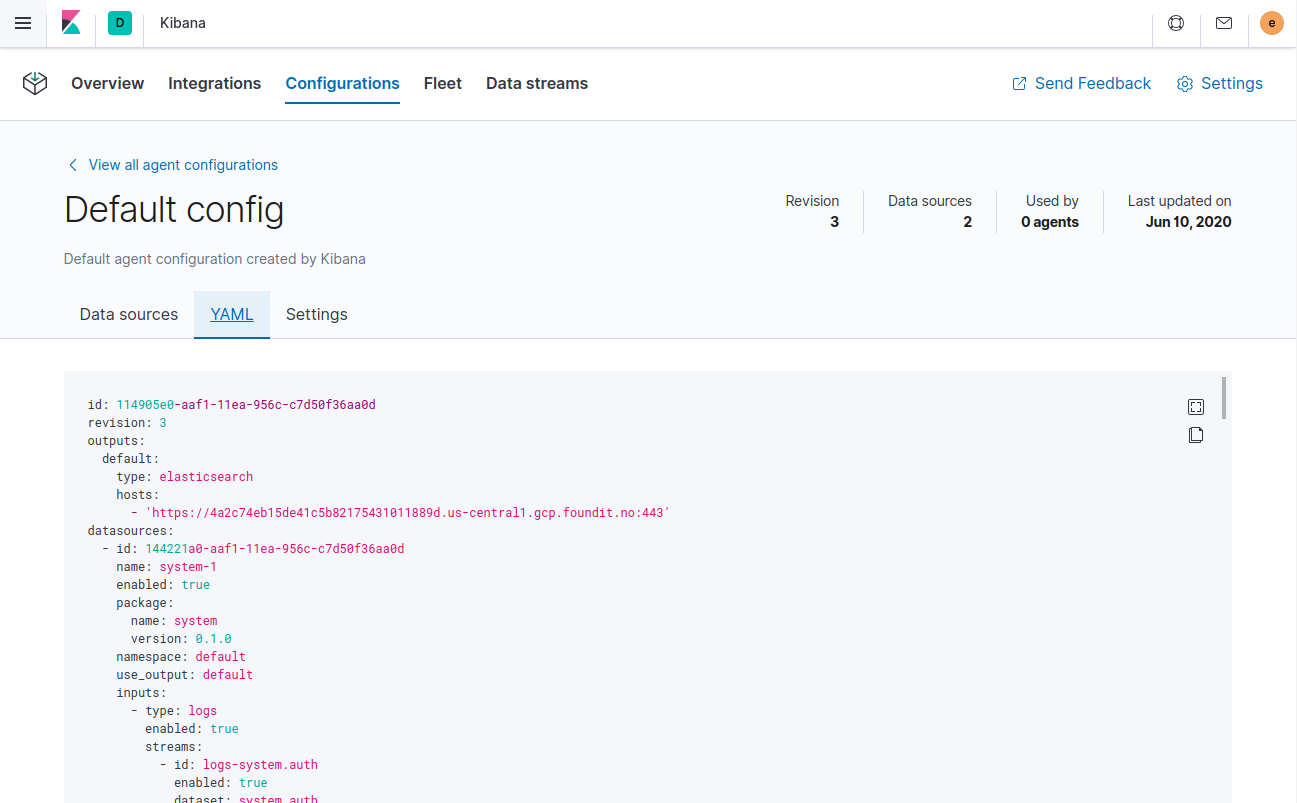
The configuration file generated by the Ingest Manager app already contains the correct Elasticsearch address and port for your setup. If you run everything locally, the address is
127.0.0.1:9200. If you use our hosted Elasticsearch Service on Elastic Cloud, the address corresponds to the Elasticsearch endpoint URL that you can copy from the Overview page of your deployment. -
Add your Elasticsearch username and password to the
outputssection in the configuration file:[...] outputs: default: type: elasticsearch hosts: - 'HOST:PORT' username: ES_USERNAME password: ES_PASSWORD datasources: [...] -
Run Elastic Agent:
./elastic-agent -c elastic-agent-standalone.yml run
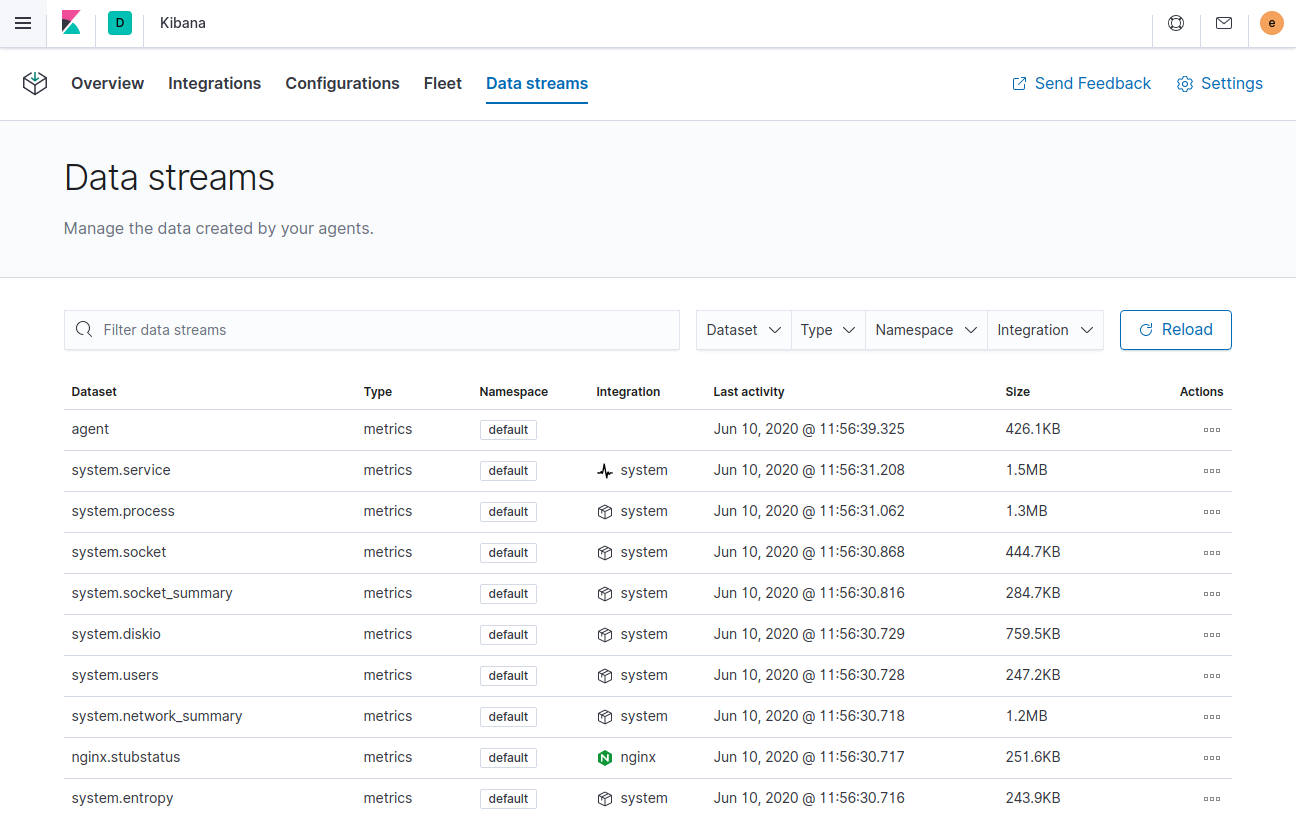
Step 4: View your data
editIn the Ingest Manager app, click the Data streams tab to inspect the data that is sent by the Agent. From the Actions column, you can navigate to the dashboards corresponding to the data type that is sent.