Kibana highlights
editKibana highlights
editThis list summarizes the most important enhancements in Kibana 7.14.
Alerting—import and export rules & connectors
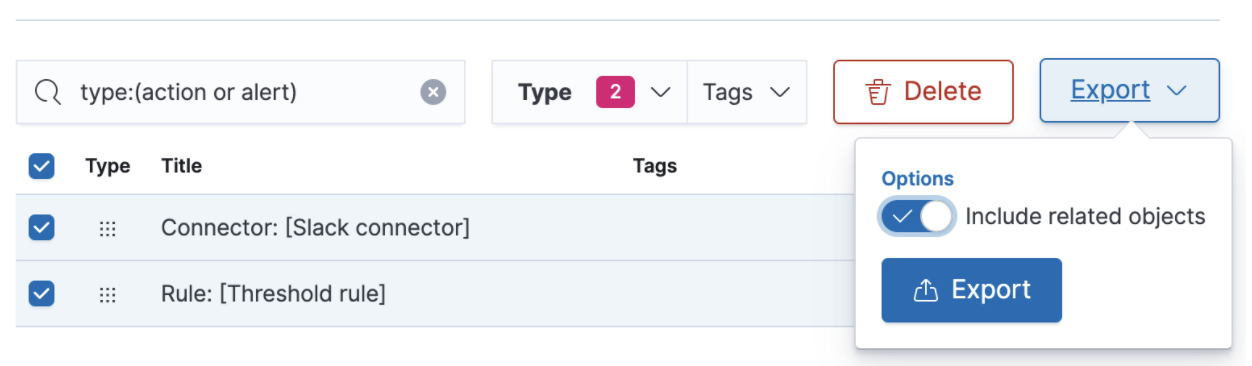
edit7.14 adds the ability to export and import rules and connectors between Kibana deployments and spaces. This increases support for Kibana’s multi-tenancy paradigm and for reusability. Write your rules once and reuse them fast and effortlessly according to your organization’s needs.
This release also improves the observability of alerting by enhancing the following:
- The Task Manager health API with the ability to log stats over time when a problem occurs and an (experimental) capacity estimation.
- The event log with more fields (rule fields, start, end, and duration of alert, reference to rule ID, task drift) and a log at the start of a rule or connector execution.
- The server logs with a log warning when disabling an alert task due to not finding the rule saved object.
- The documentation with example event log queries and an enhanced Alerting and Task Manager troubleshooting doc.
Lens—custom formulas, time shifts, & more
editCustom formulas
editWith formulas, you can combine math operations and aggregated fields to author your own metrics at query time. With the easy-to-use, autocompleting formula editor, you can:
- Mix and match filtered and time shifted Elasticsearch aggregations
- Add report-time calculations on the fly, such as cumulative sum and moving average
- Build comparisons to the overall summary data using the new overall functions
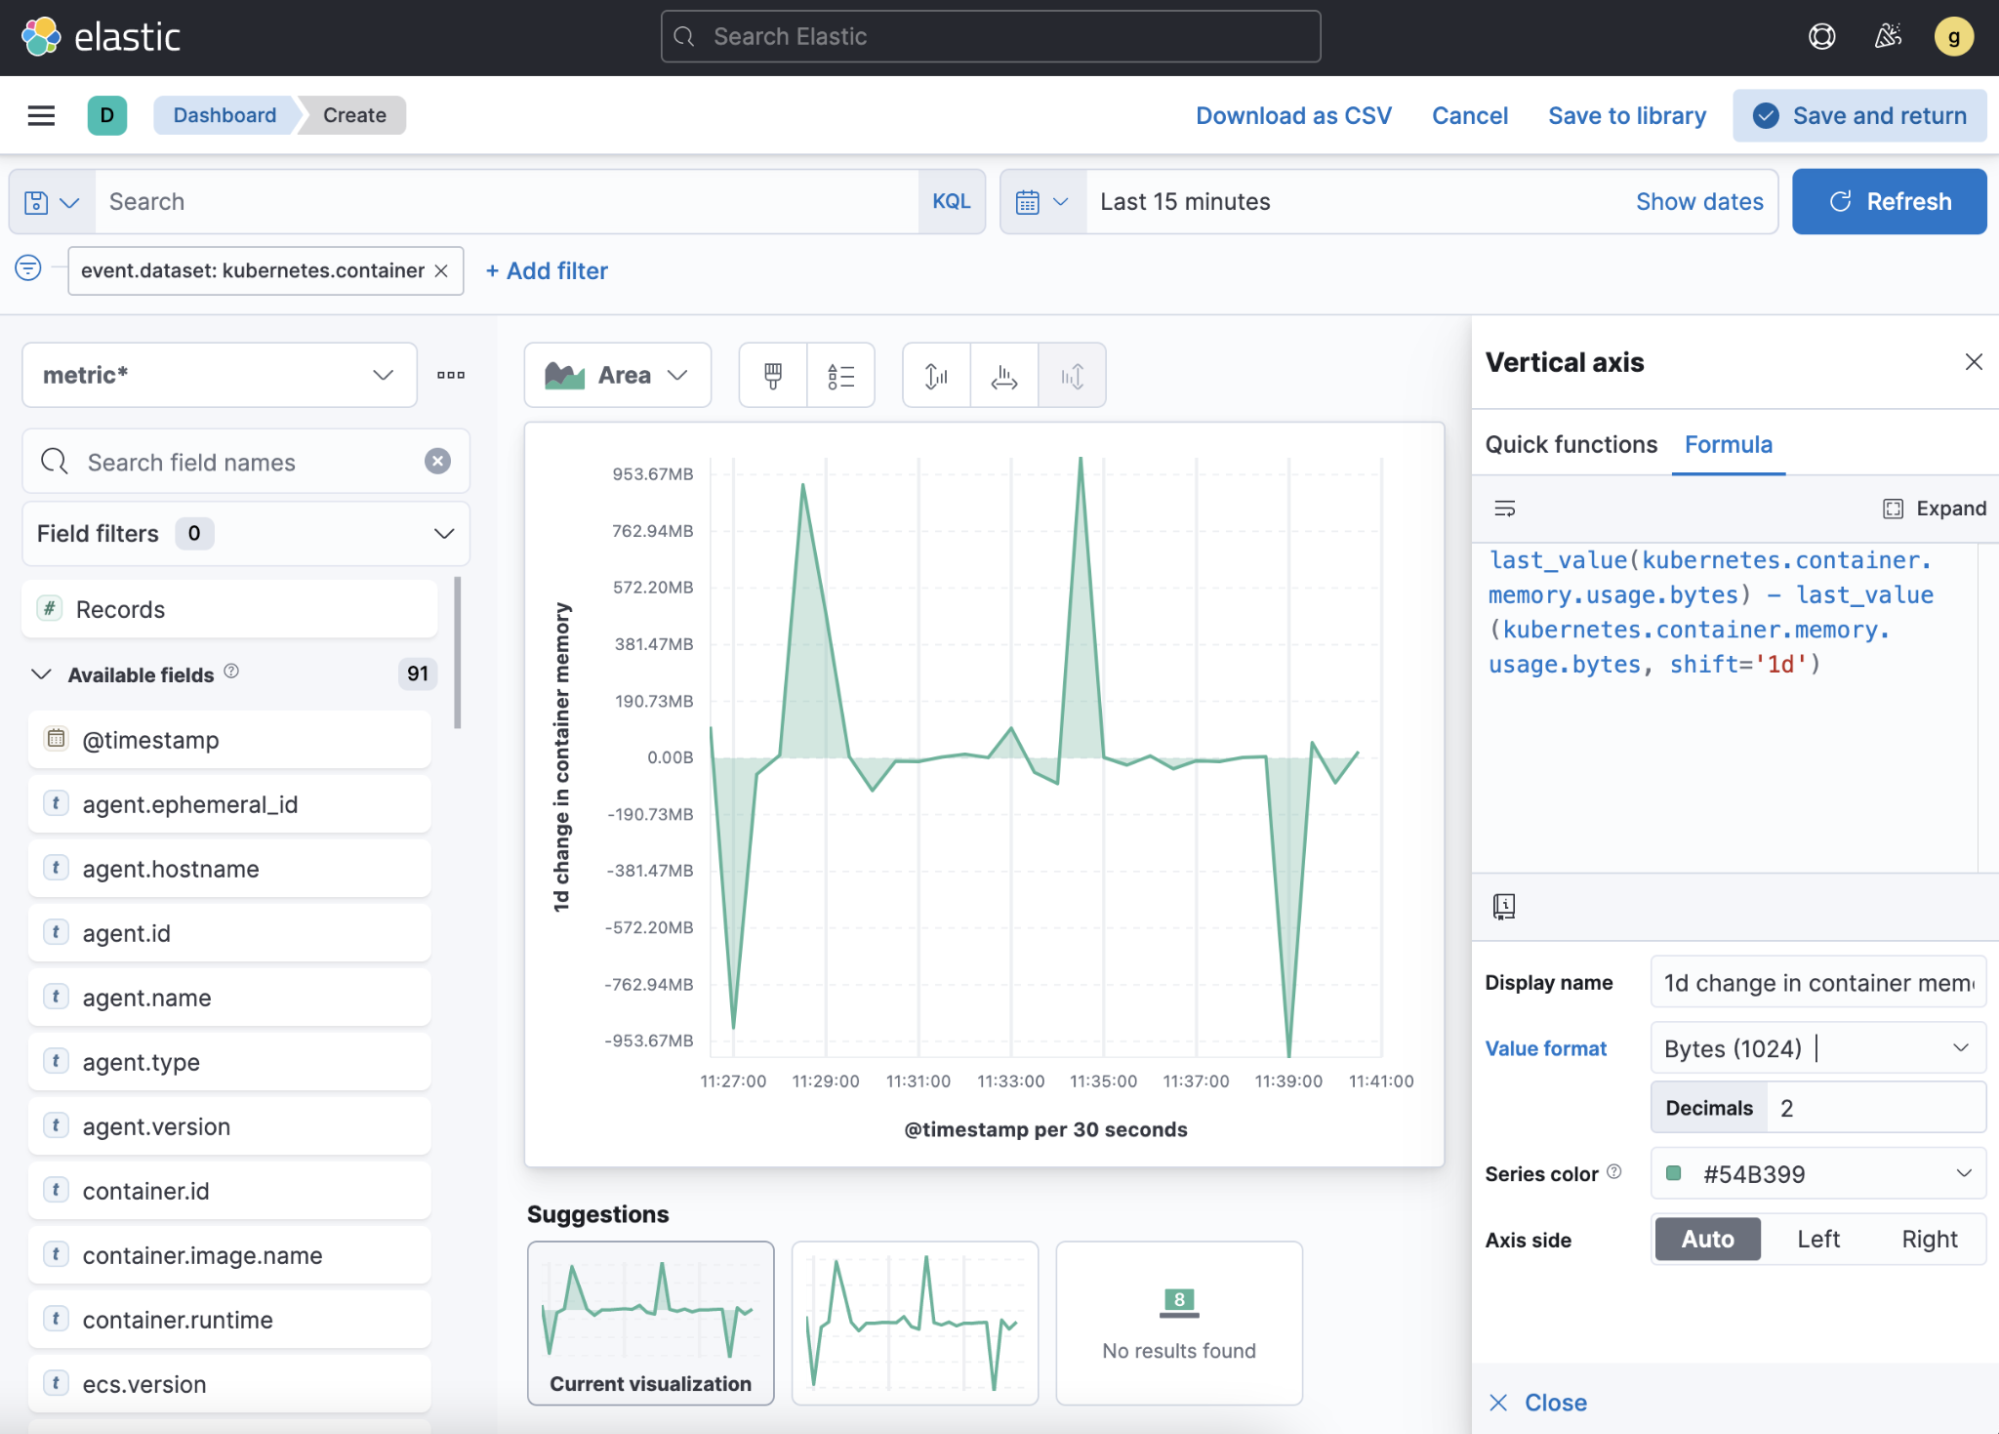
Want to learn more? Check out the searchable in-product reference documentation, which also includes common use cases. When you’re ready, use full screen mode to create your own formulas.
Time shifts
editMake easy and powerful comparisons between two time periods by adding time shifted metrics to your visualizations. Time shifted metrics help to reduce the distraction caused by the seasonal or behavioral changes in your data.
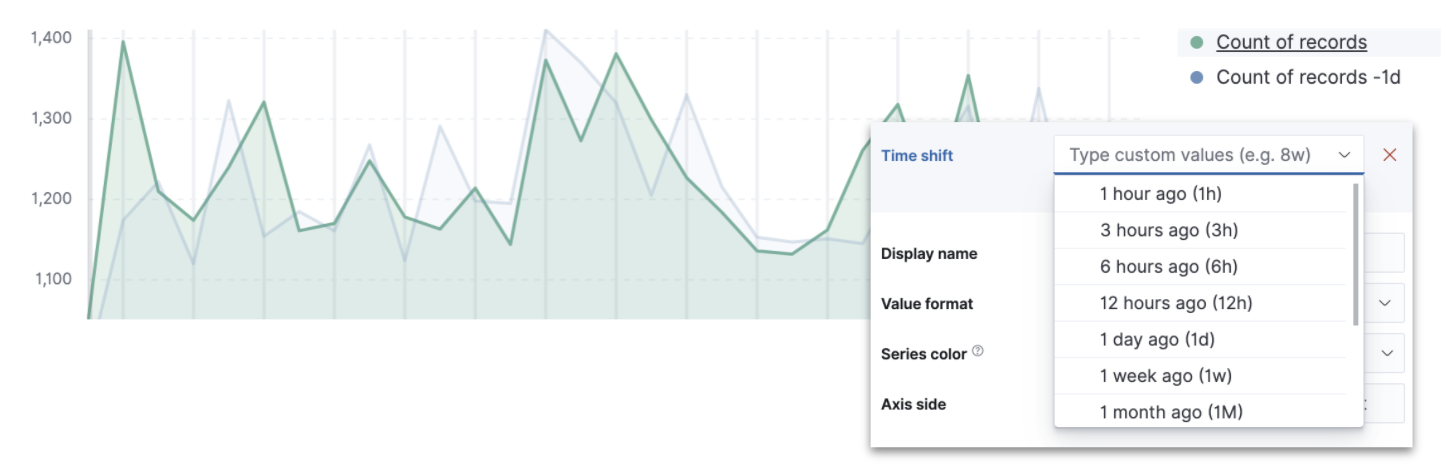
Table enhancements
editEnhancements to tables include:
- Summary rows. Add a row to your table that summarizes the column values, and customize how you want the summary aggregation and label to appear.
-
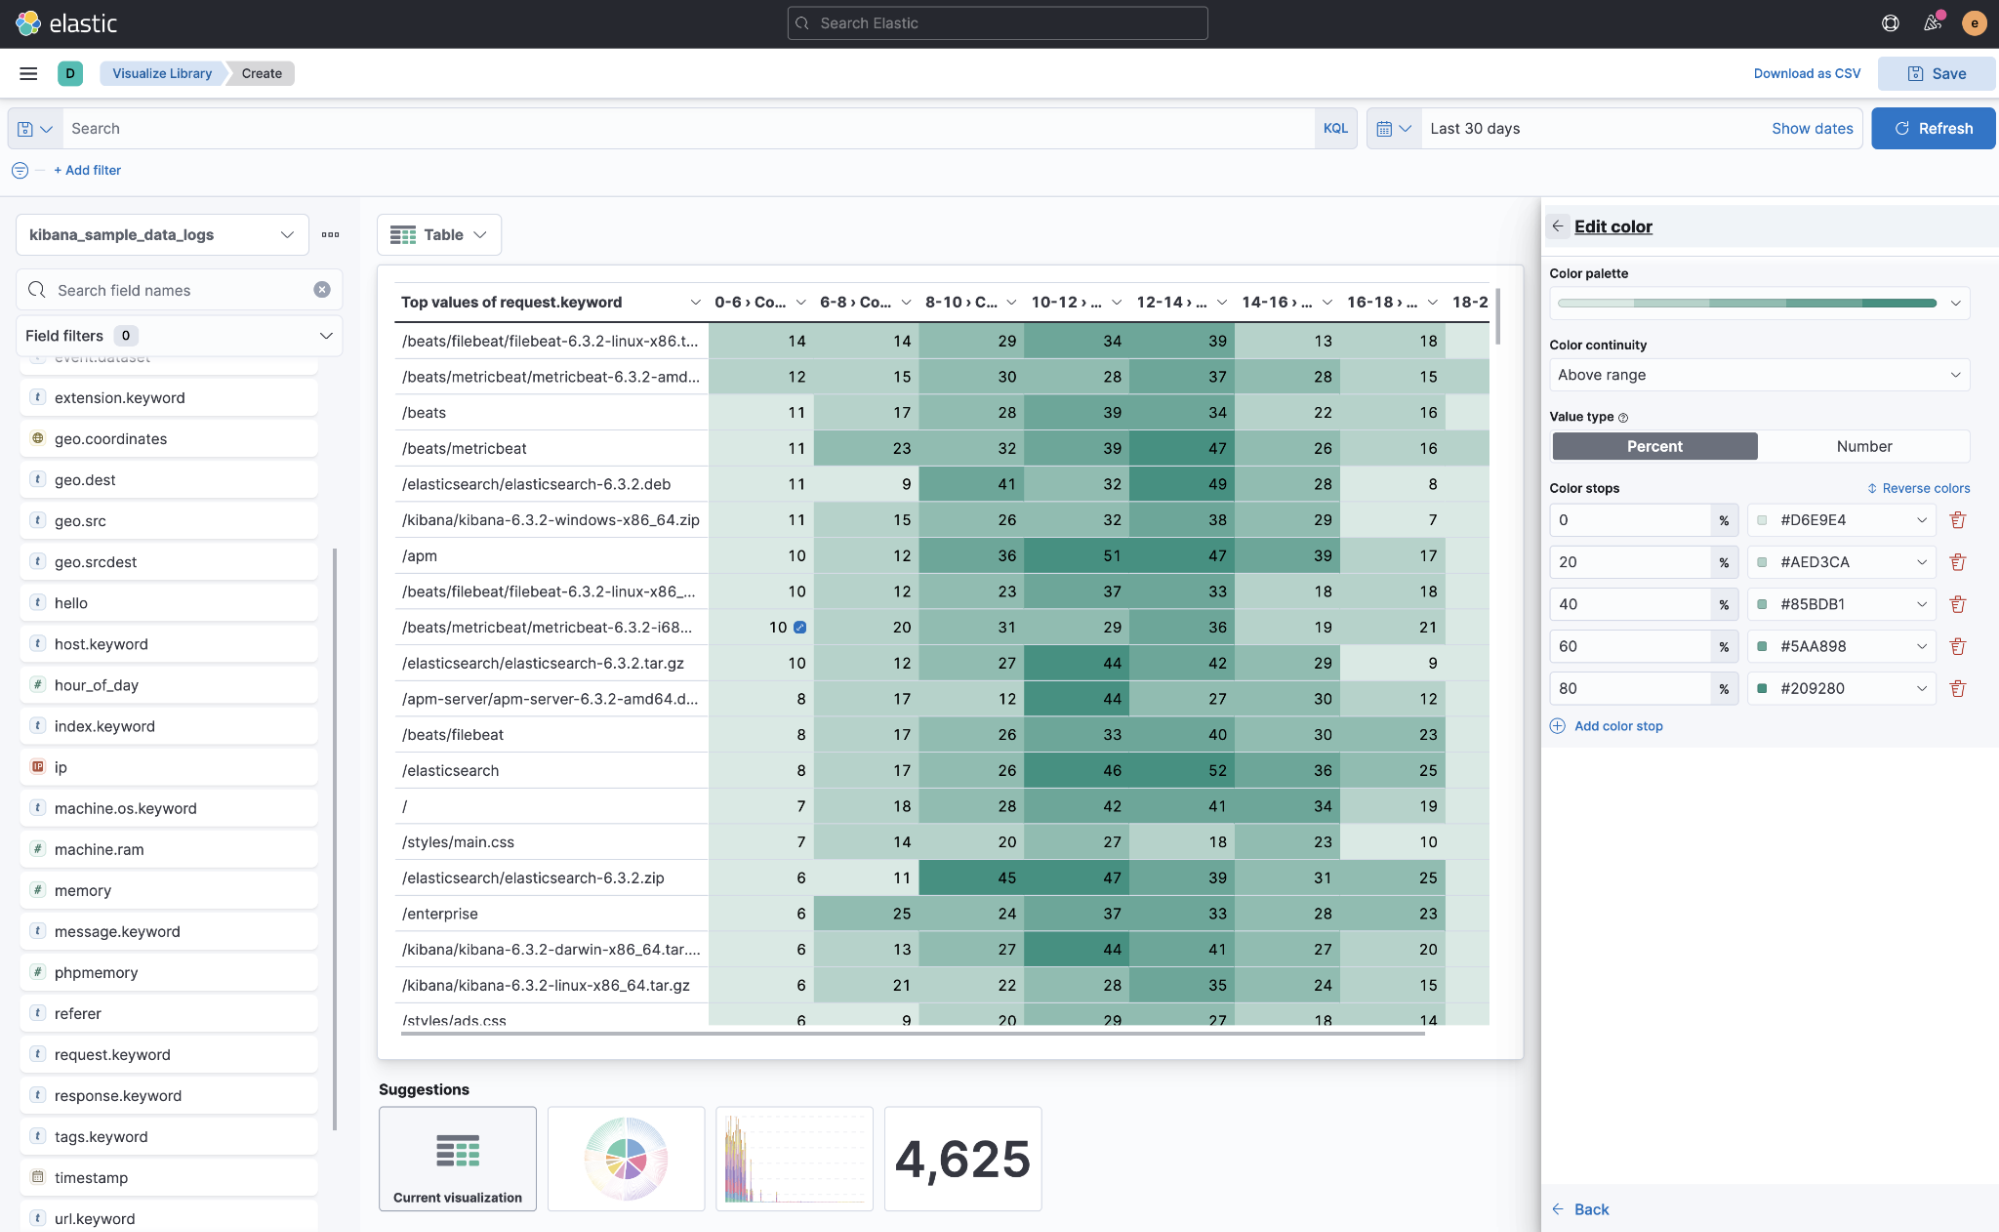
Color by value. Visually emphasize specific metric values with flexible conditional coloring. Kibana provides you with an out-of-the-box palette, or you can define your own color palette. To dynamically apply colors, specify the color stops by percent or number values. For values that are outside the specified range, control how to apply colors with color continuity.
Additional improvements
edit- [preview] This functionality is in technical preview and may be changed or removed in a future release. Elastic will work to fix any issues, but features in technical preview are not subject to the support SLA of official GA features. Heatmaps. Create heatmaps, sometimes called swim lanes, which are useful for showing a single metric at the intersection of two dimensions.
- Improved editing performance. Notice how fast it is to switch between visualization authoring and dashboard, improving the authoring workflow.
- Legend values on hover. Configure legends to display the values on hover. This helps you clearly see the legend values for dense data sets.
- Custom axis controls. Create consistent scales across your visualizations on a dashboard. Represent the possible range of values—even when those values might not be returned in the current data set.
- Opacity slider in area charts. Adjust the transparency with the Fill opacity slider. This makes it easier to analyze the area chart data that frequently overlaps.
- Quickly navigate to Maps Select a geospatial field in the Available fields list to open and visualize it in Maps, including any filters you’ve applied.
New EUI theme
editKibana now uses the new EUI theme by default, bringing a more modern look to the entire interface. Due to small changes to padding, margins, and font sizes in the base components, you might notice minor changes to dashboard layouts. During the 7.x cycle, you can revert to the old theme in Advanced Settings.
Improvements to saved objects migrations
editThe migration system for saved objects, the data structures that underpin much of Kibana, has improved. Now upgrading from prior versions is quicker and more seamless, even for the largest of deployments. When problems arise, the error logging is now more clear, so administrators can get migration back on track faster.
Maps—time slider and drawing tools
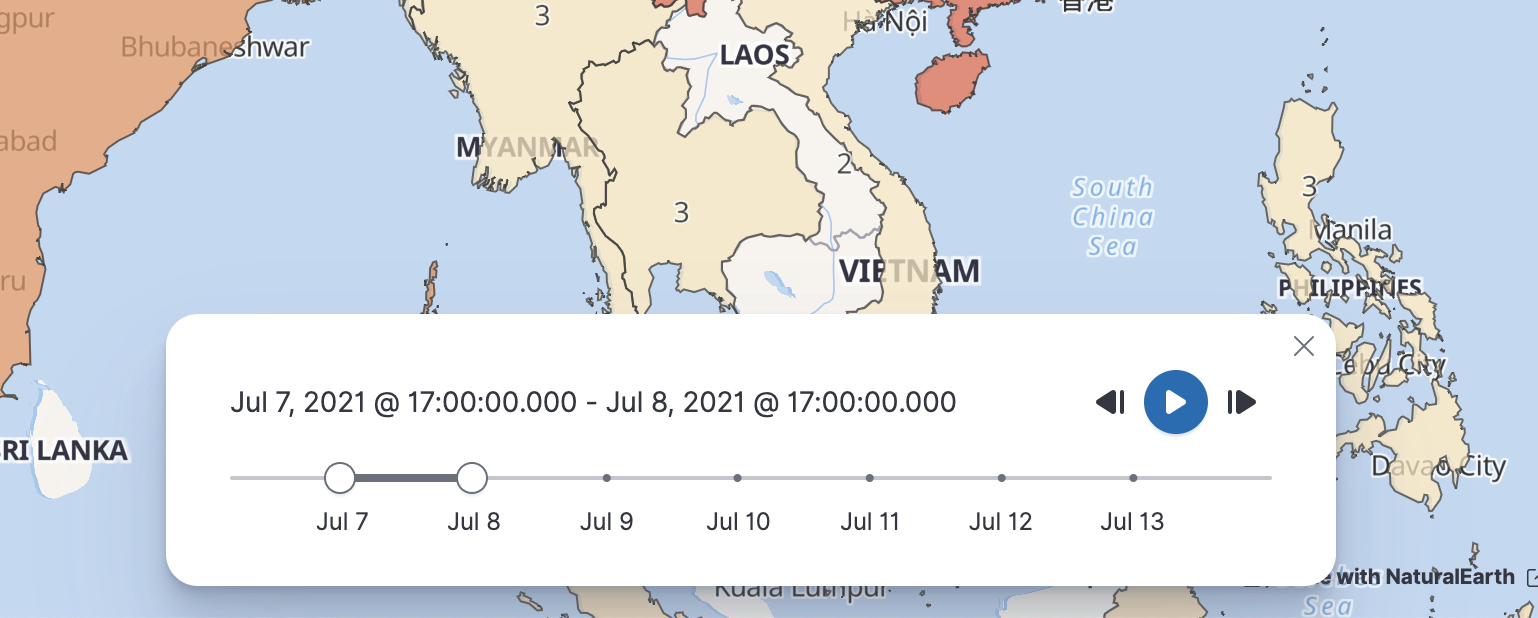
editTime slider
editYou can now analyze and explore space and time with the time slider. This control allows you to look at a subset of time (a time slice), move it forward or backward, and play back your data based on the global time extent. The time slider works on all layers that are based on a time-field.
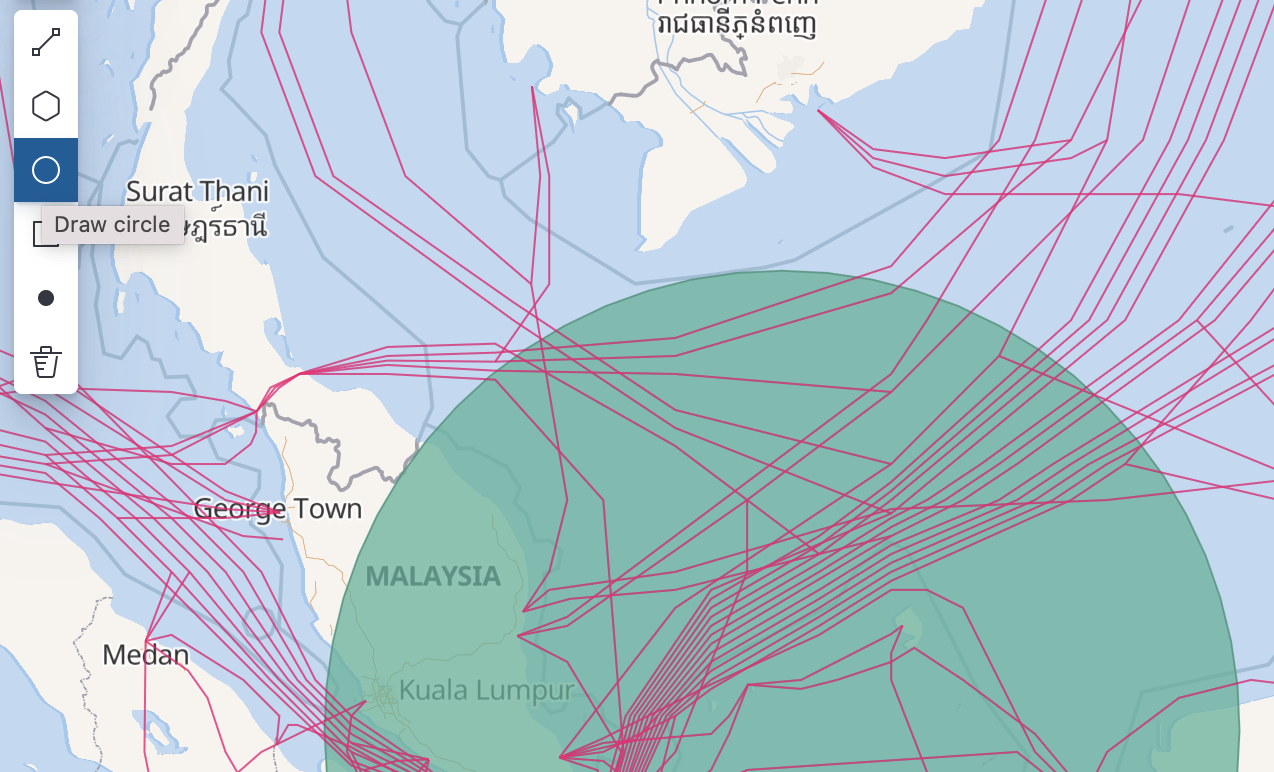
Create and edit tools
edit[beta] This functionality is in beta and is subject to change. The design and code is less mature than official GA features and is being provided as-is with no warranties. Beta features are not subject to the support SLA of official GA features. You can now create an index, and with a new set of drawing tools, add or delete documents. Use the drawing tools to create new data and add geographic context to your map, good for annotation or ad-hoc analysis. You can edit both new and existing layers (indices). Editing is not supported on layers with clustering, joins, or time filtering.
Enhanced spatial filters
editFiltering is now more intuitive. The spatial filters in Maps are enhanced to work with all layers on the map, meaning you no longer have to specify a target index pattern when configuring the filter. When using the distance filter, you will now see a distance value displayed as you draw the shape. This makes it easier to filter all documents that are within 10 kilometers of a specific location.
Discover—community-requested features
editDiscover debuts several community-requested features: a multi-fields toggle, enhanced Lens integration, and source views in the document viewer. Discover also enhances the user experience with improvements to stability, performance, accessibility, and usability. For more information on the most-used app in Kibana, refer to Discover.
Canvas—improves SQL expression function
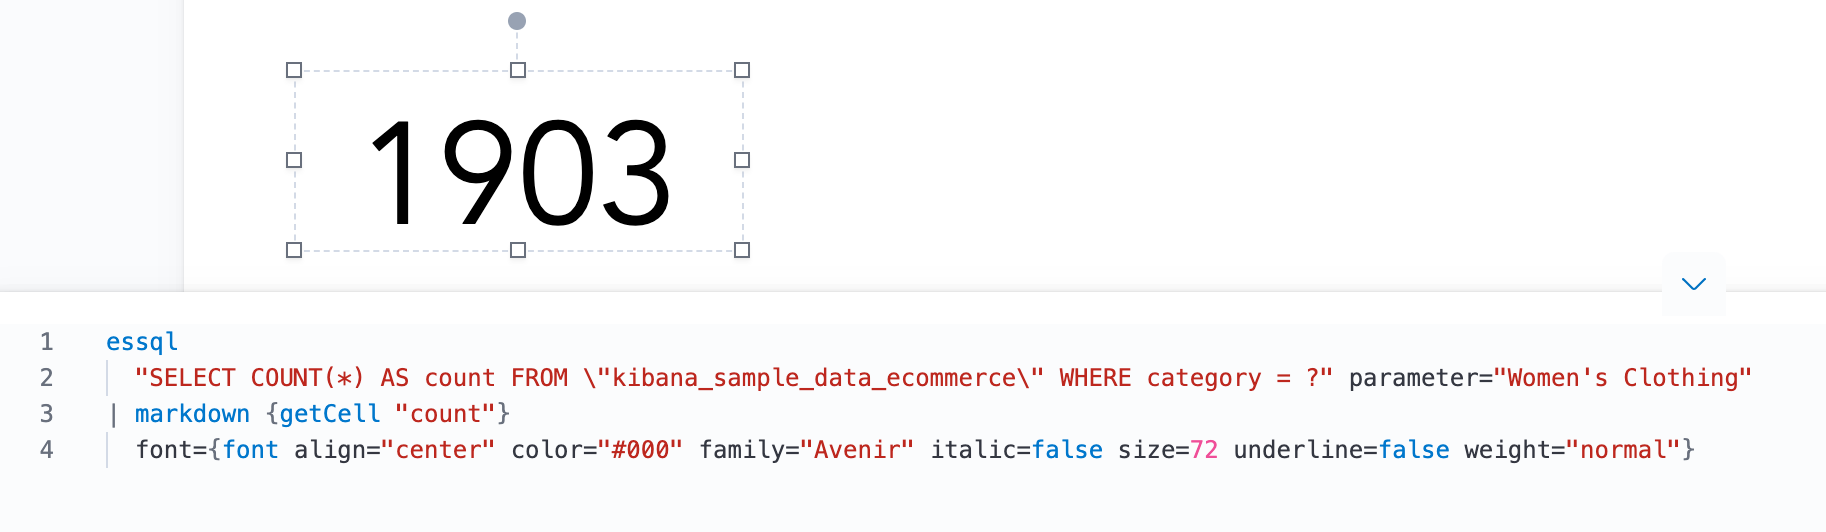
editThe Elasticsearch SQL expression function in Canvas has changed to gracefully handle arrays in retrieved data. If the data for the SQL expression includes an array, the first entry of the array is returned in the result set.
In addition, the SQL expression function now supports passing parameters into the query, making it easier to pass in variable values to your SQL queries on your workpad.
Machine learning—maps, delayed data, & more
editChoropleth maps for anomalies
editChoropleth maps are now available in the Anomaly Explorer and the Data Visualizer for fields such as country and region codes, zip codes, and states. The integration relies on a new service provided by the Maps plugin, which automatically identifies fields that store location data based on sample values or contextual knowledge about the data. For example, for jobs with region ISO code partitioning or influencer fields, a map showing the count of anomalies by location is displayed in the Anomaly Explorer .
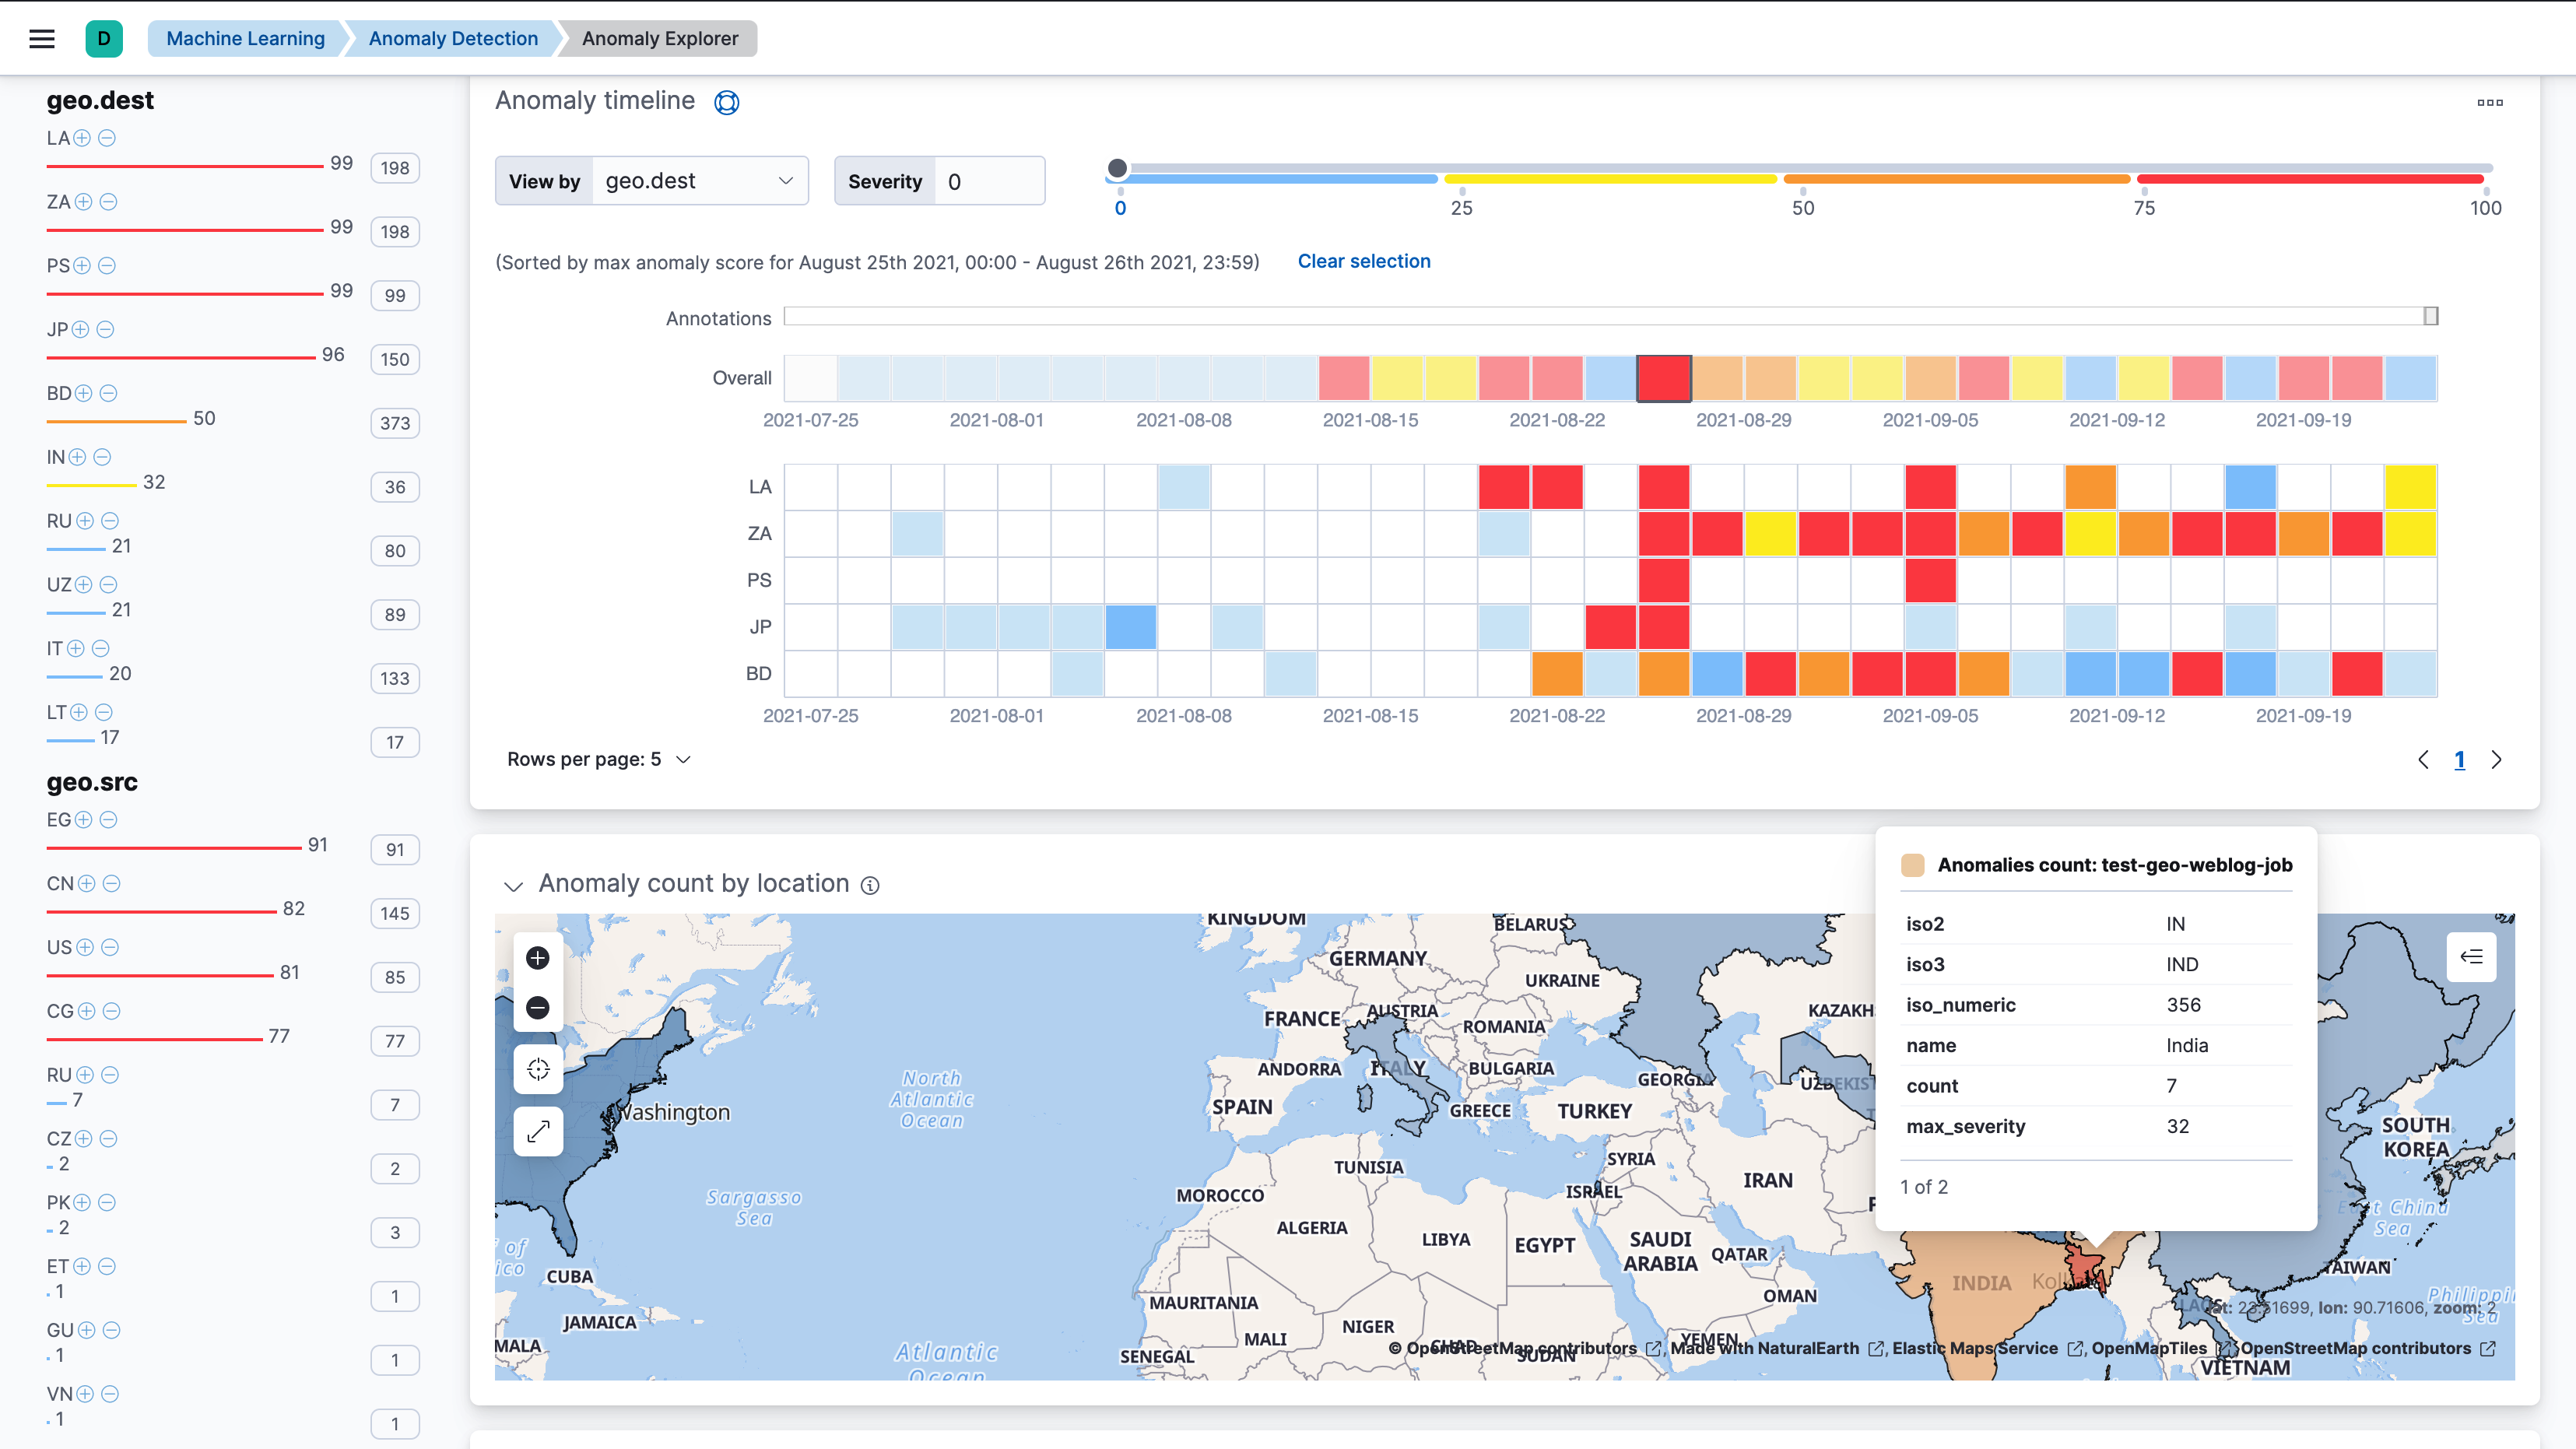
For more details, see Mapping anomalies by location.
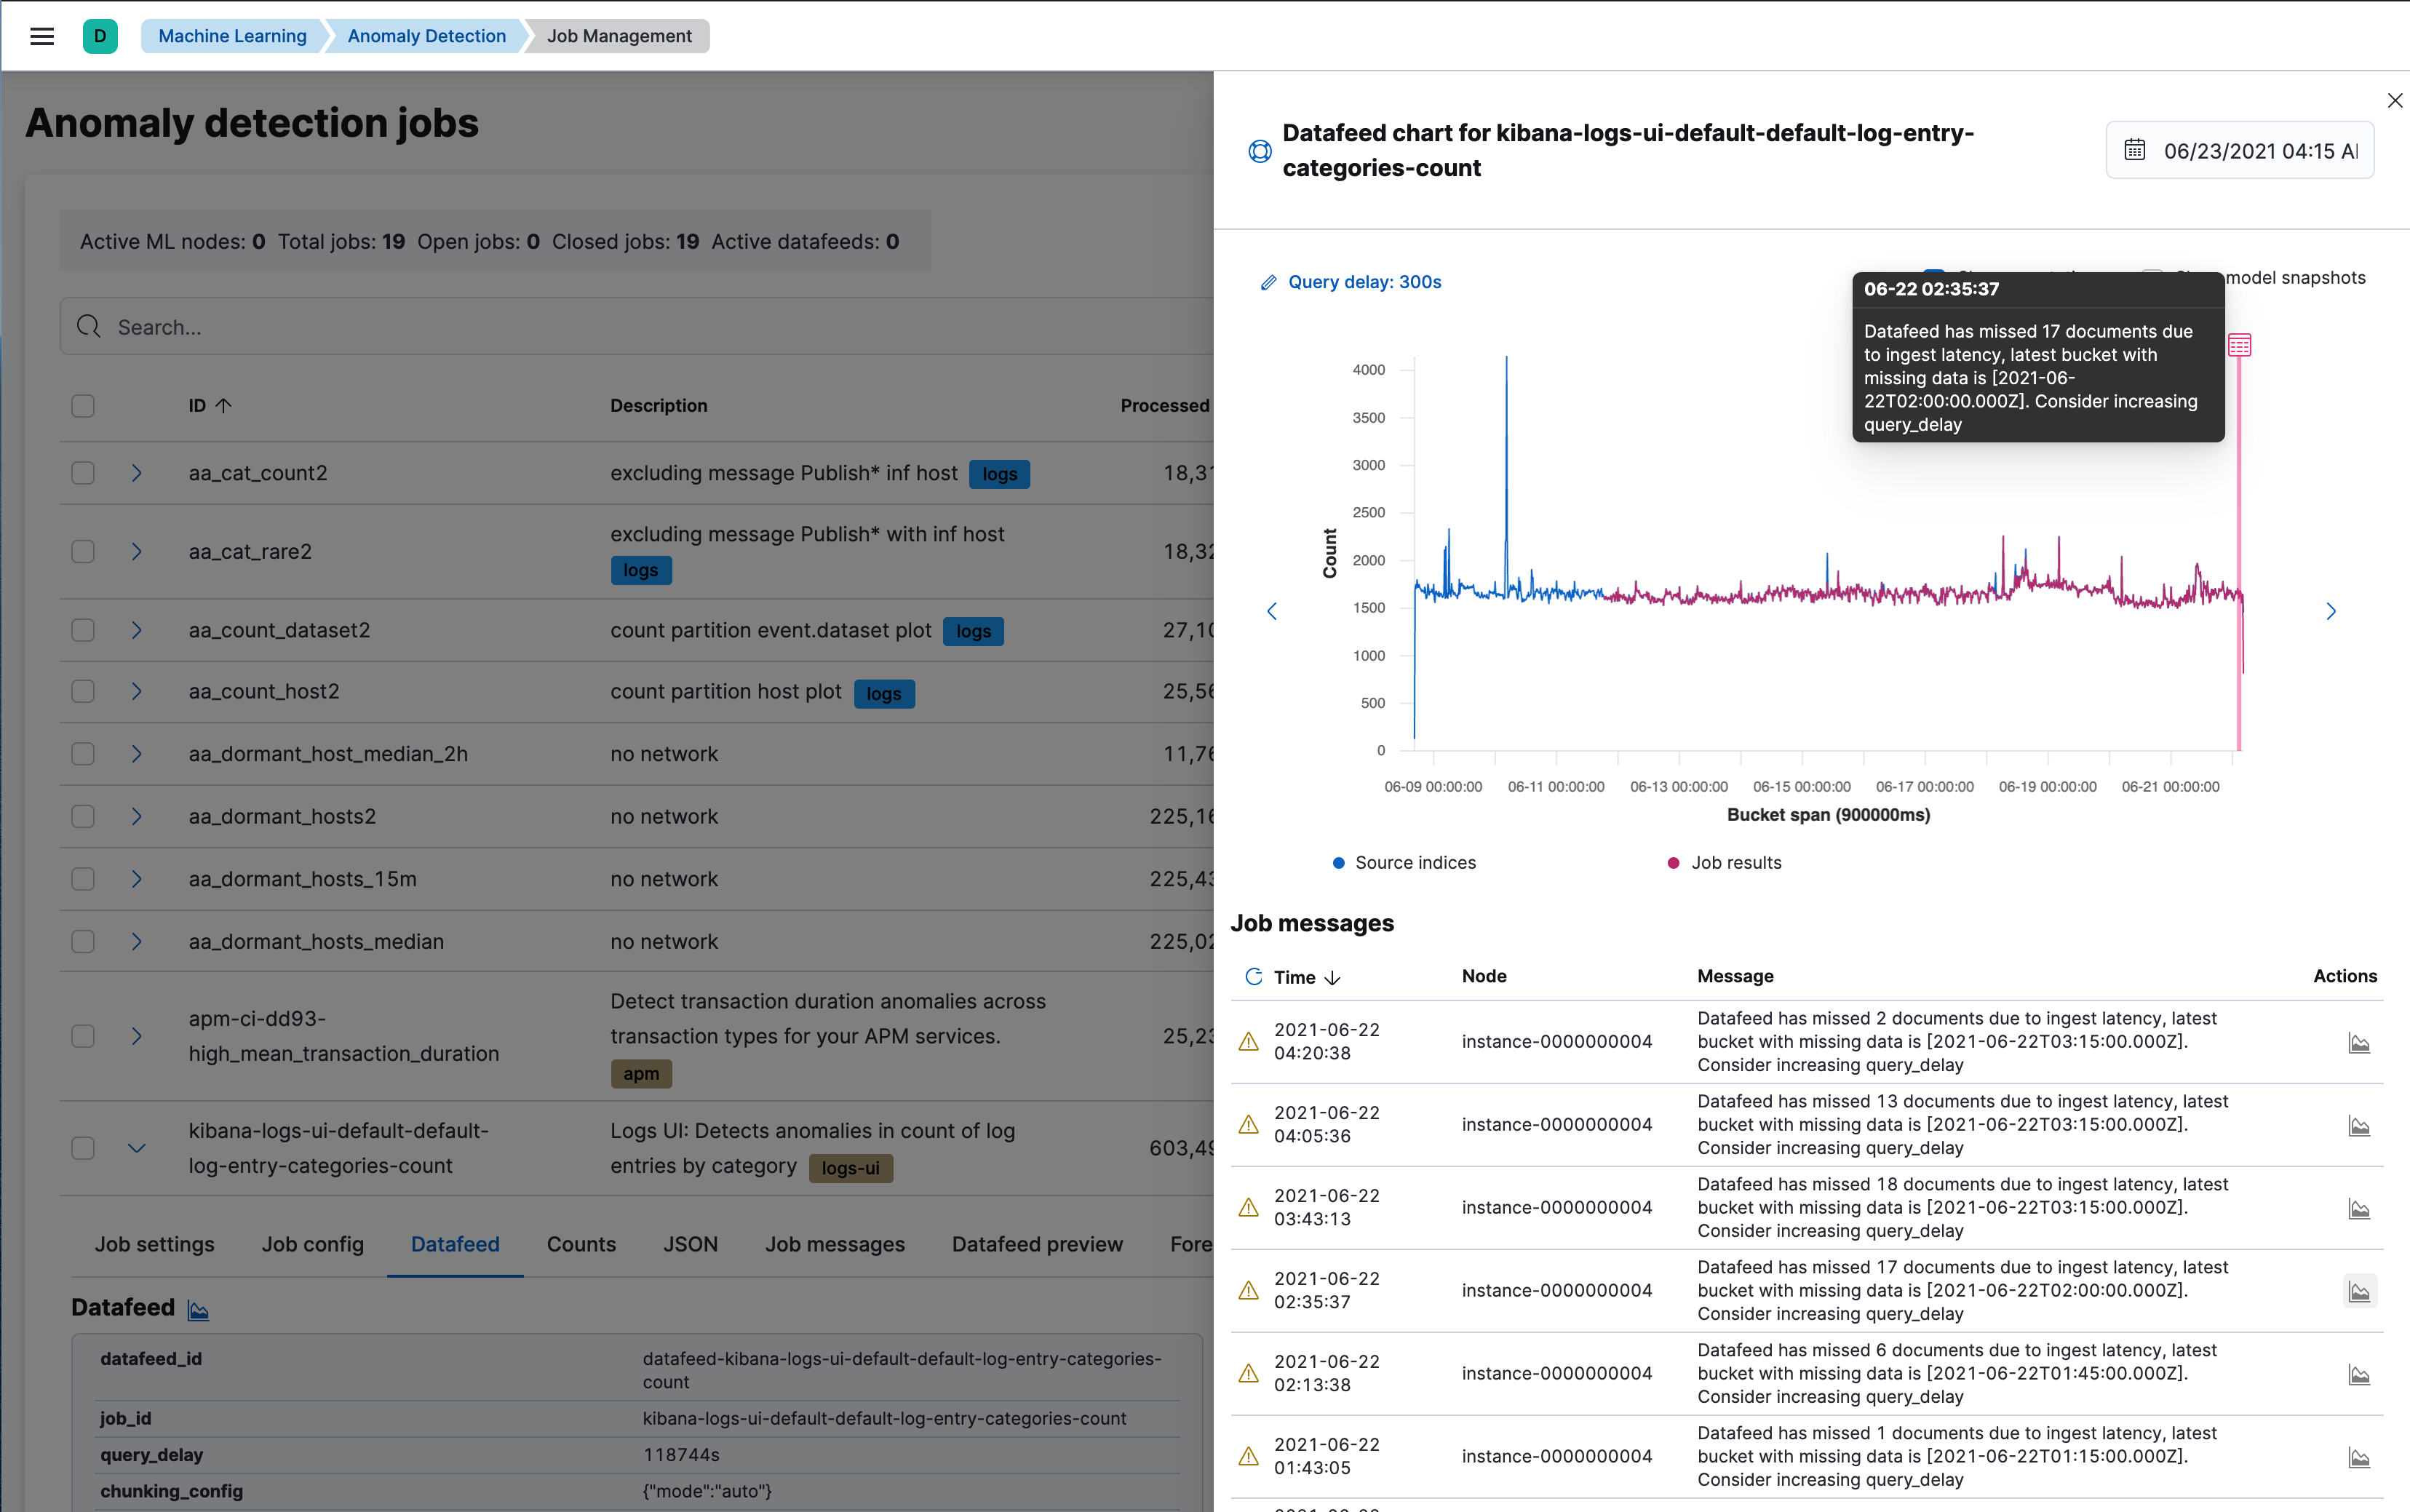
Delayed data visualization for anomaly detection
editDelayed data are documents that are indexed after the datafeed has already processed the time period for the anomaly detection job. For jobs with delayed data, it can be difficult to understand why the current data is different from what was processed for the anomaly detection job.
The delayed data visualization—opened from Job Management—charts the event counts of the job and the source data to identify where missing data has occurred and understand if it is a persistent problem. It enables you to decide whether to take action, such as to increase the query delay of the datafeed or to restore a model snapshot.
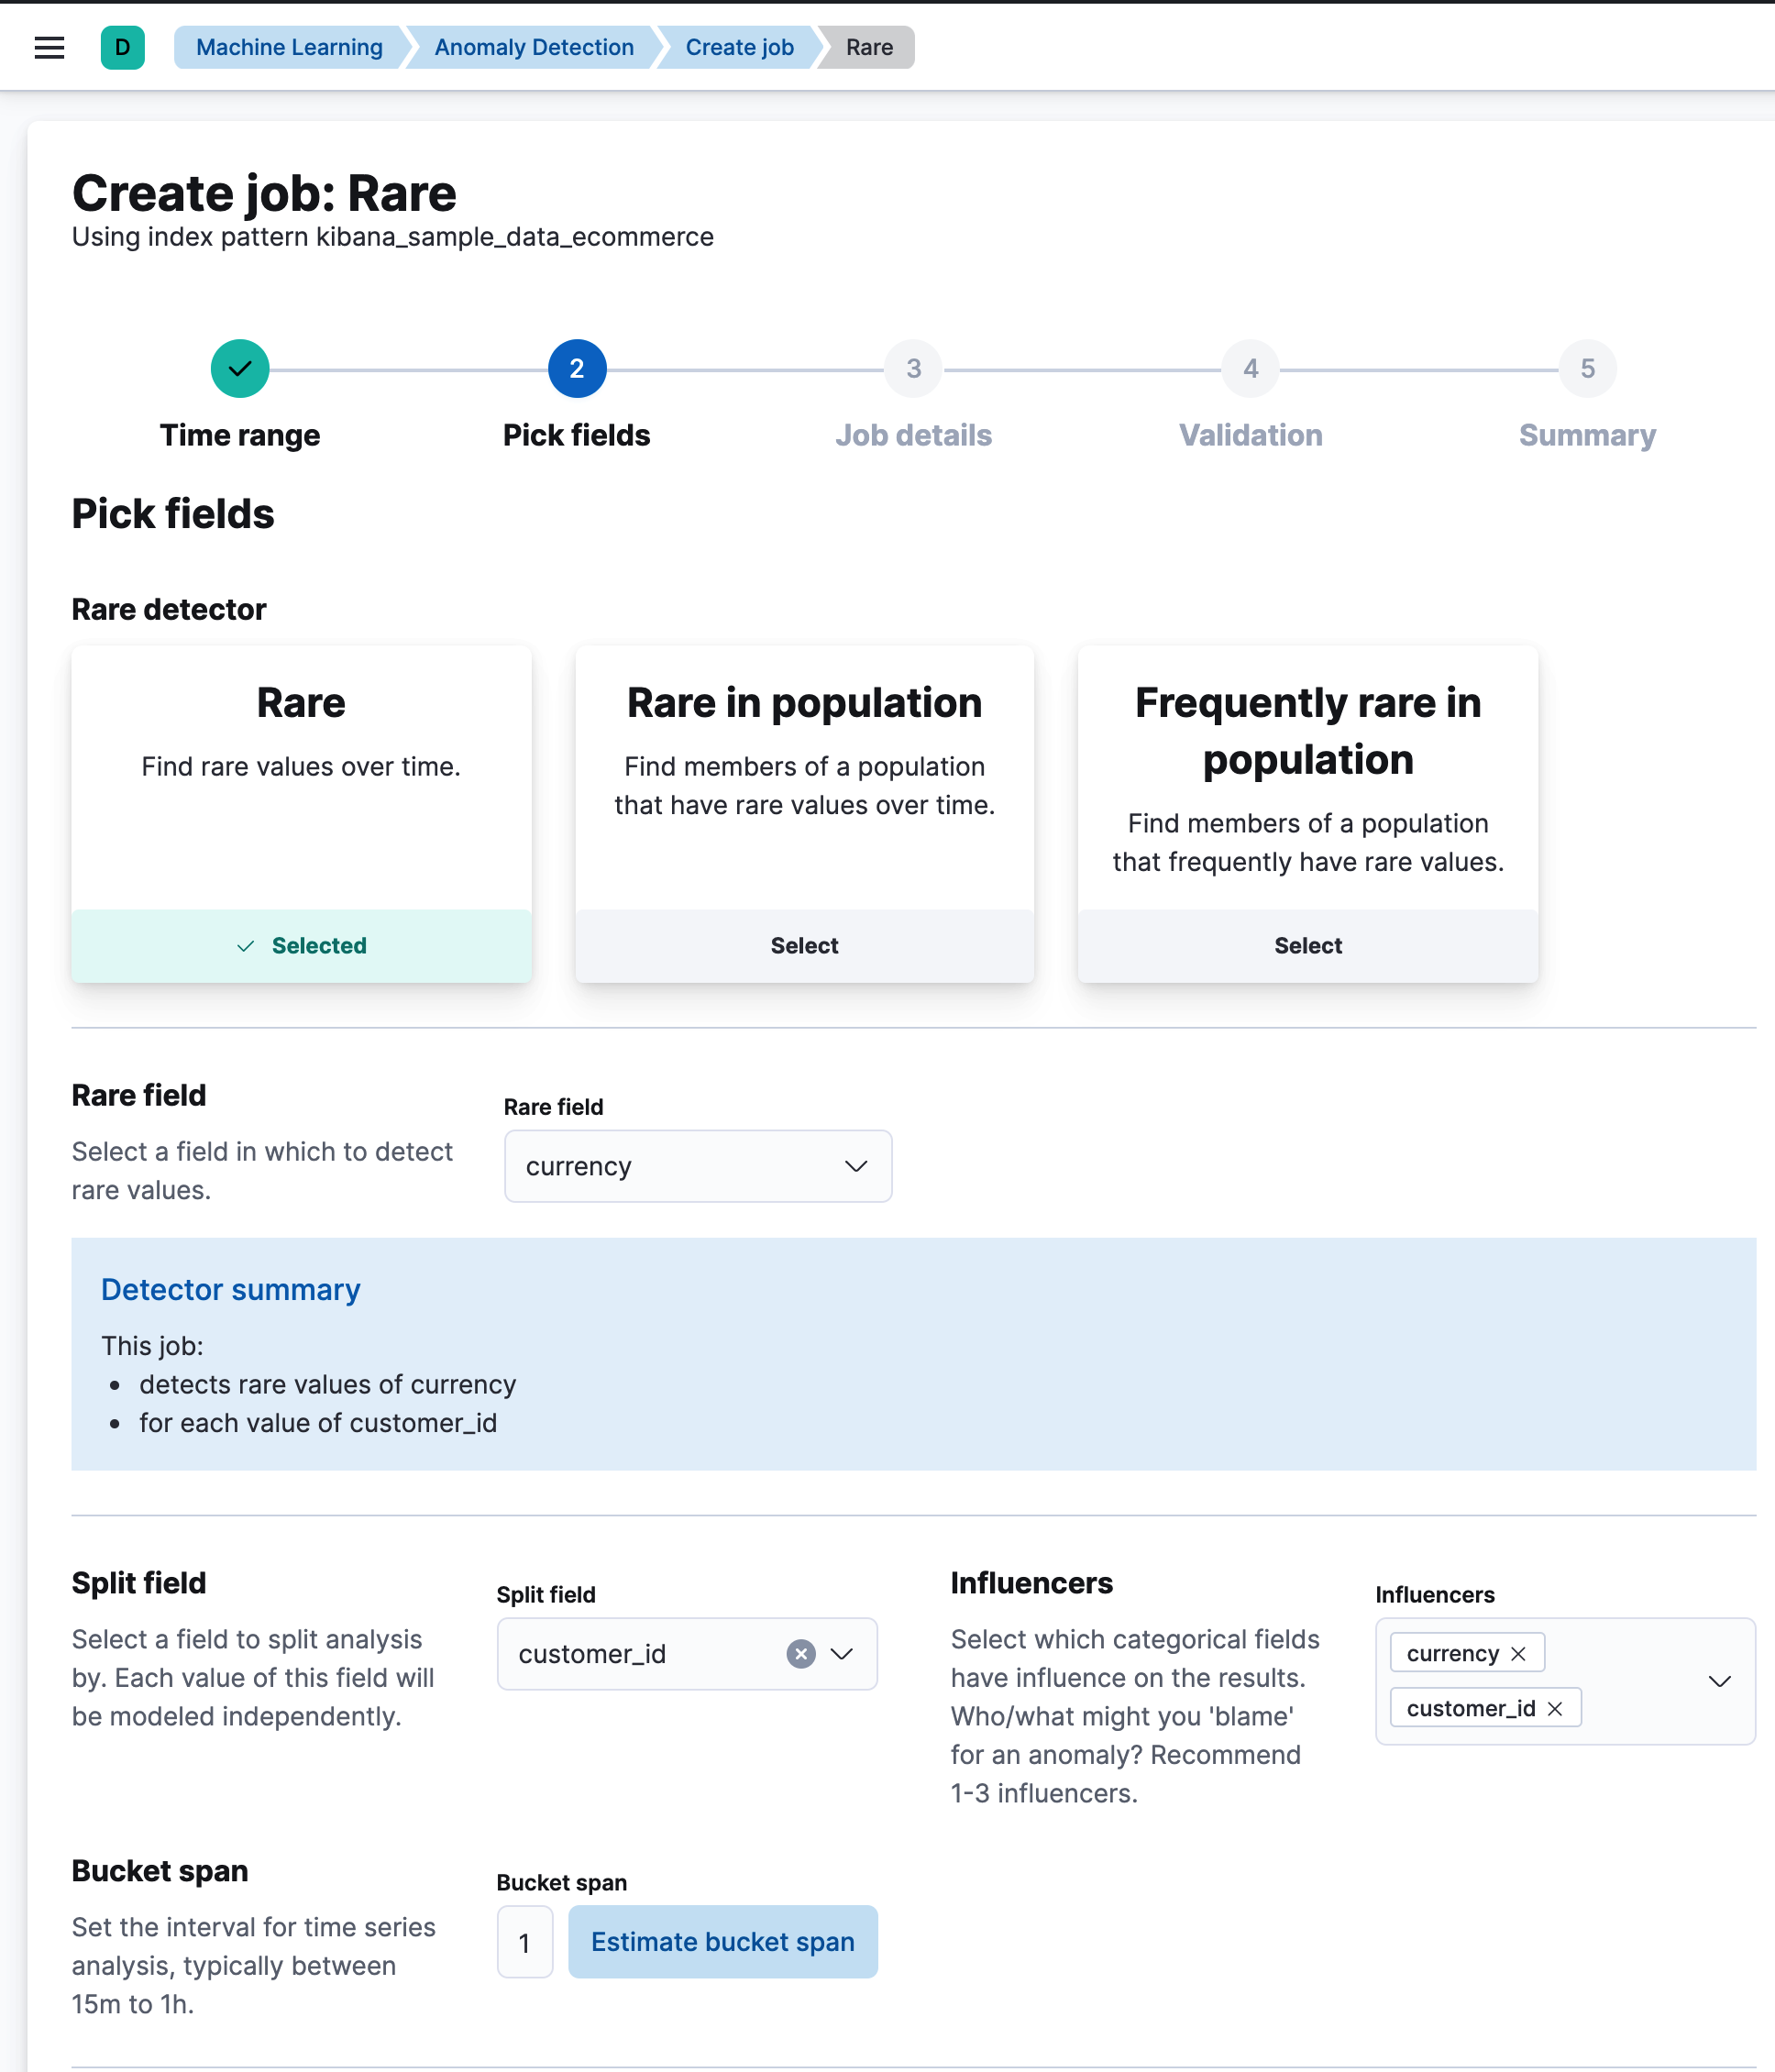
Rare job wizard for anomaly detection
editBeginning in 7.14, you can create rare detector jobs by using the new anomaly detection job wizard. Three general detector types are available: rare, rare in population, and frequently rare in population. The latter two require a population field to select, and it’s also possible to add a split field to any of the choices. A detector summary appears when the configuration details are provided, showing what the job will do and which fields it will operate on.
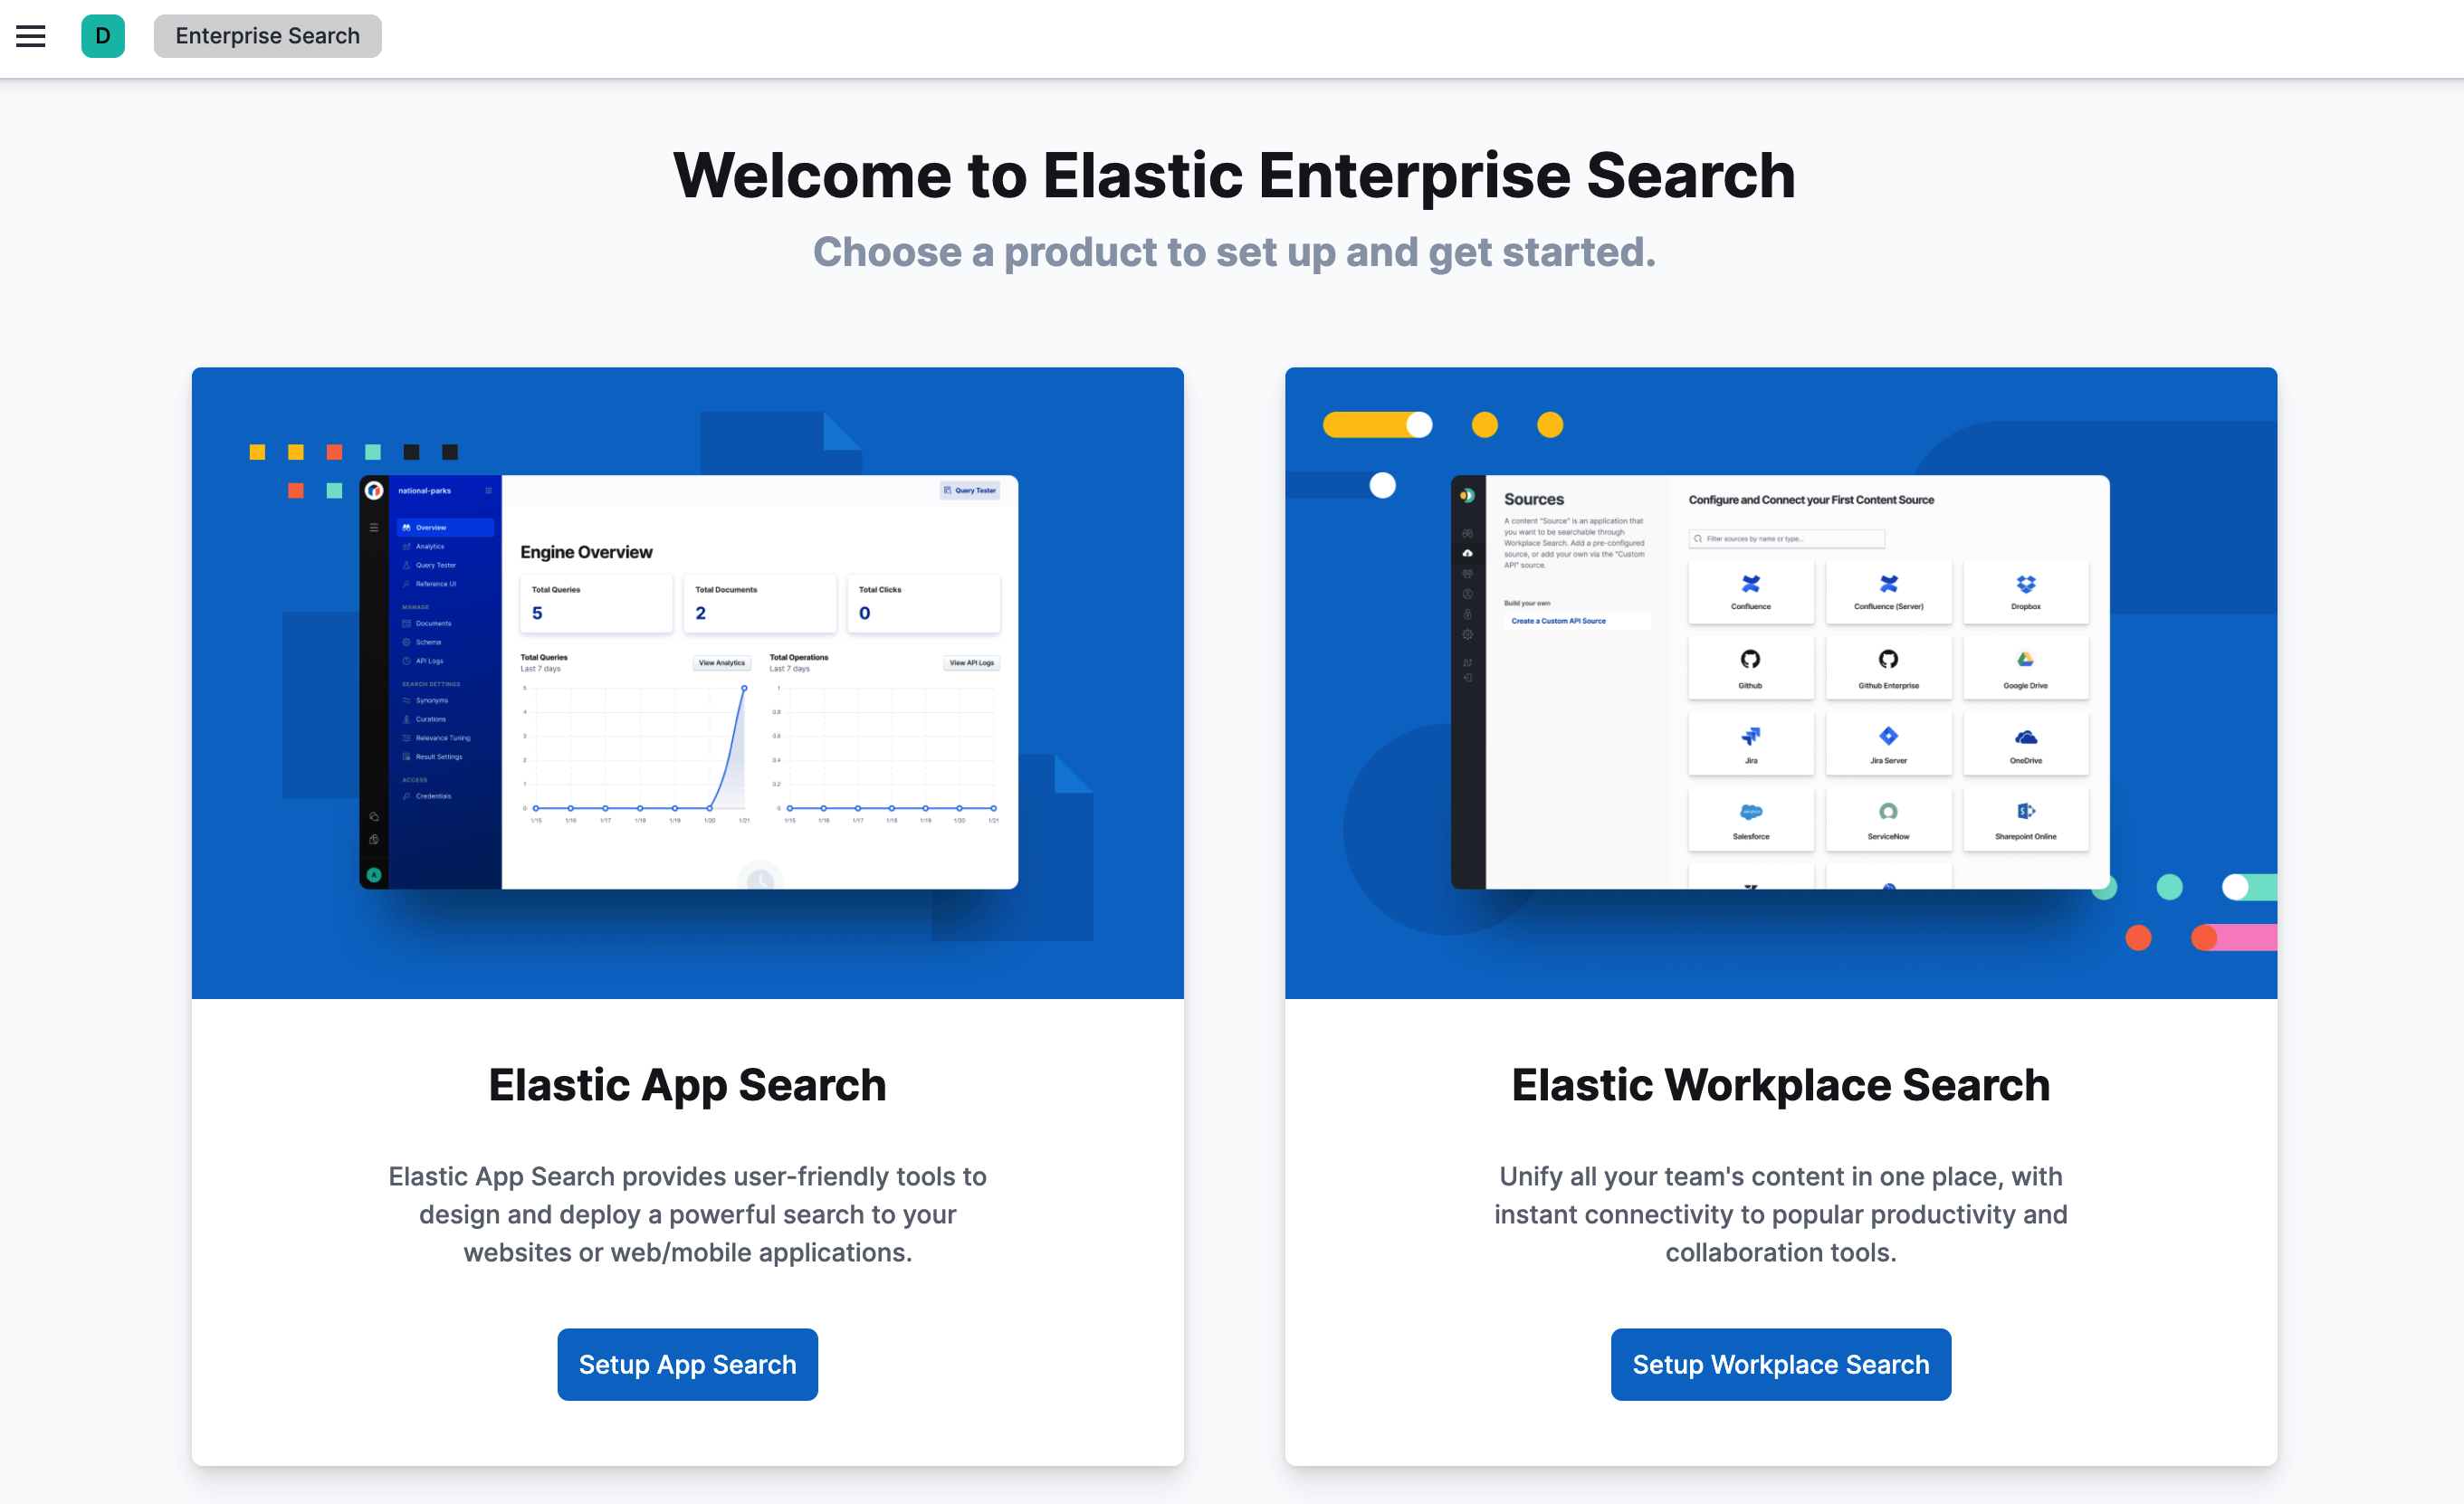
Enterprise Search now in Kibana
edit[beta] This functionality is in beta and is subject to change. The design and code is less mature than official GA features and is being provided as-is with no warranties. Beta features are not subject to the support SLA of official GA features. You can now manage your Enterprise Search deployments without leaving Kibana! 7.14 introduces App Search and Workplace Search management dashboards for Kibana, so you can experience the full power of Elastic from a single interface. Get started by selecting Enterprise Search from the main menu or Kibana home page. Learn more in Setting up Enterprise Search in Kibana.
Labs—preview experimental features
editWith Labs, you can now try out and provide feedback on the Canvas and Dashboard features that are in progress or experimental. When enabled, you’ll see Labs in the toolbar.
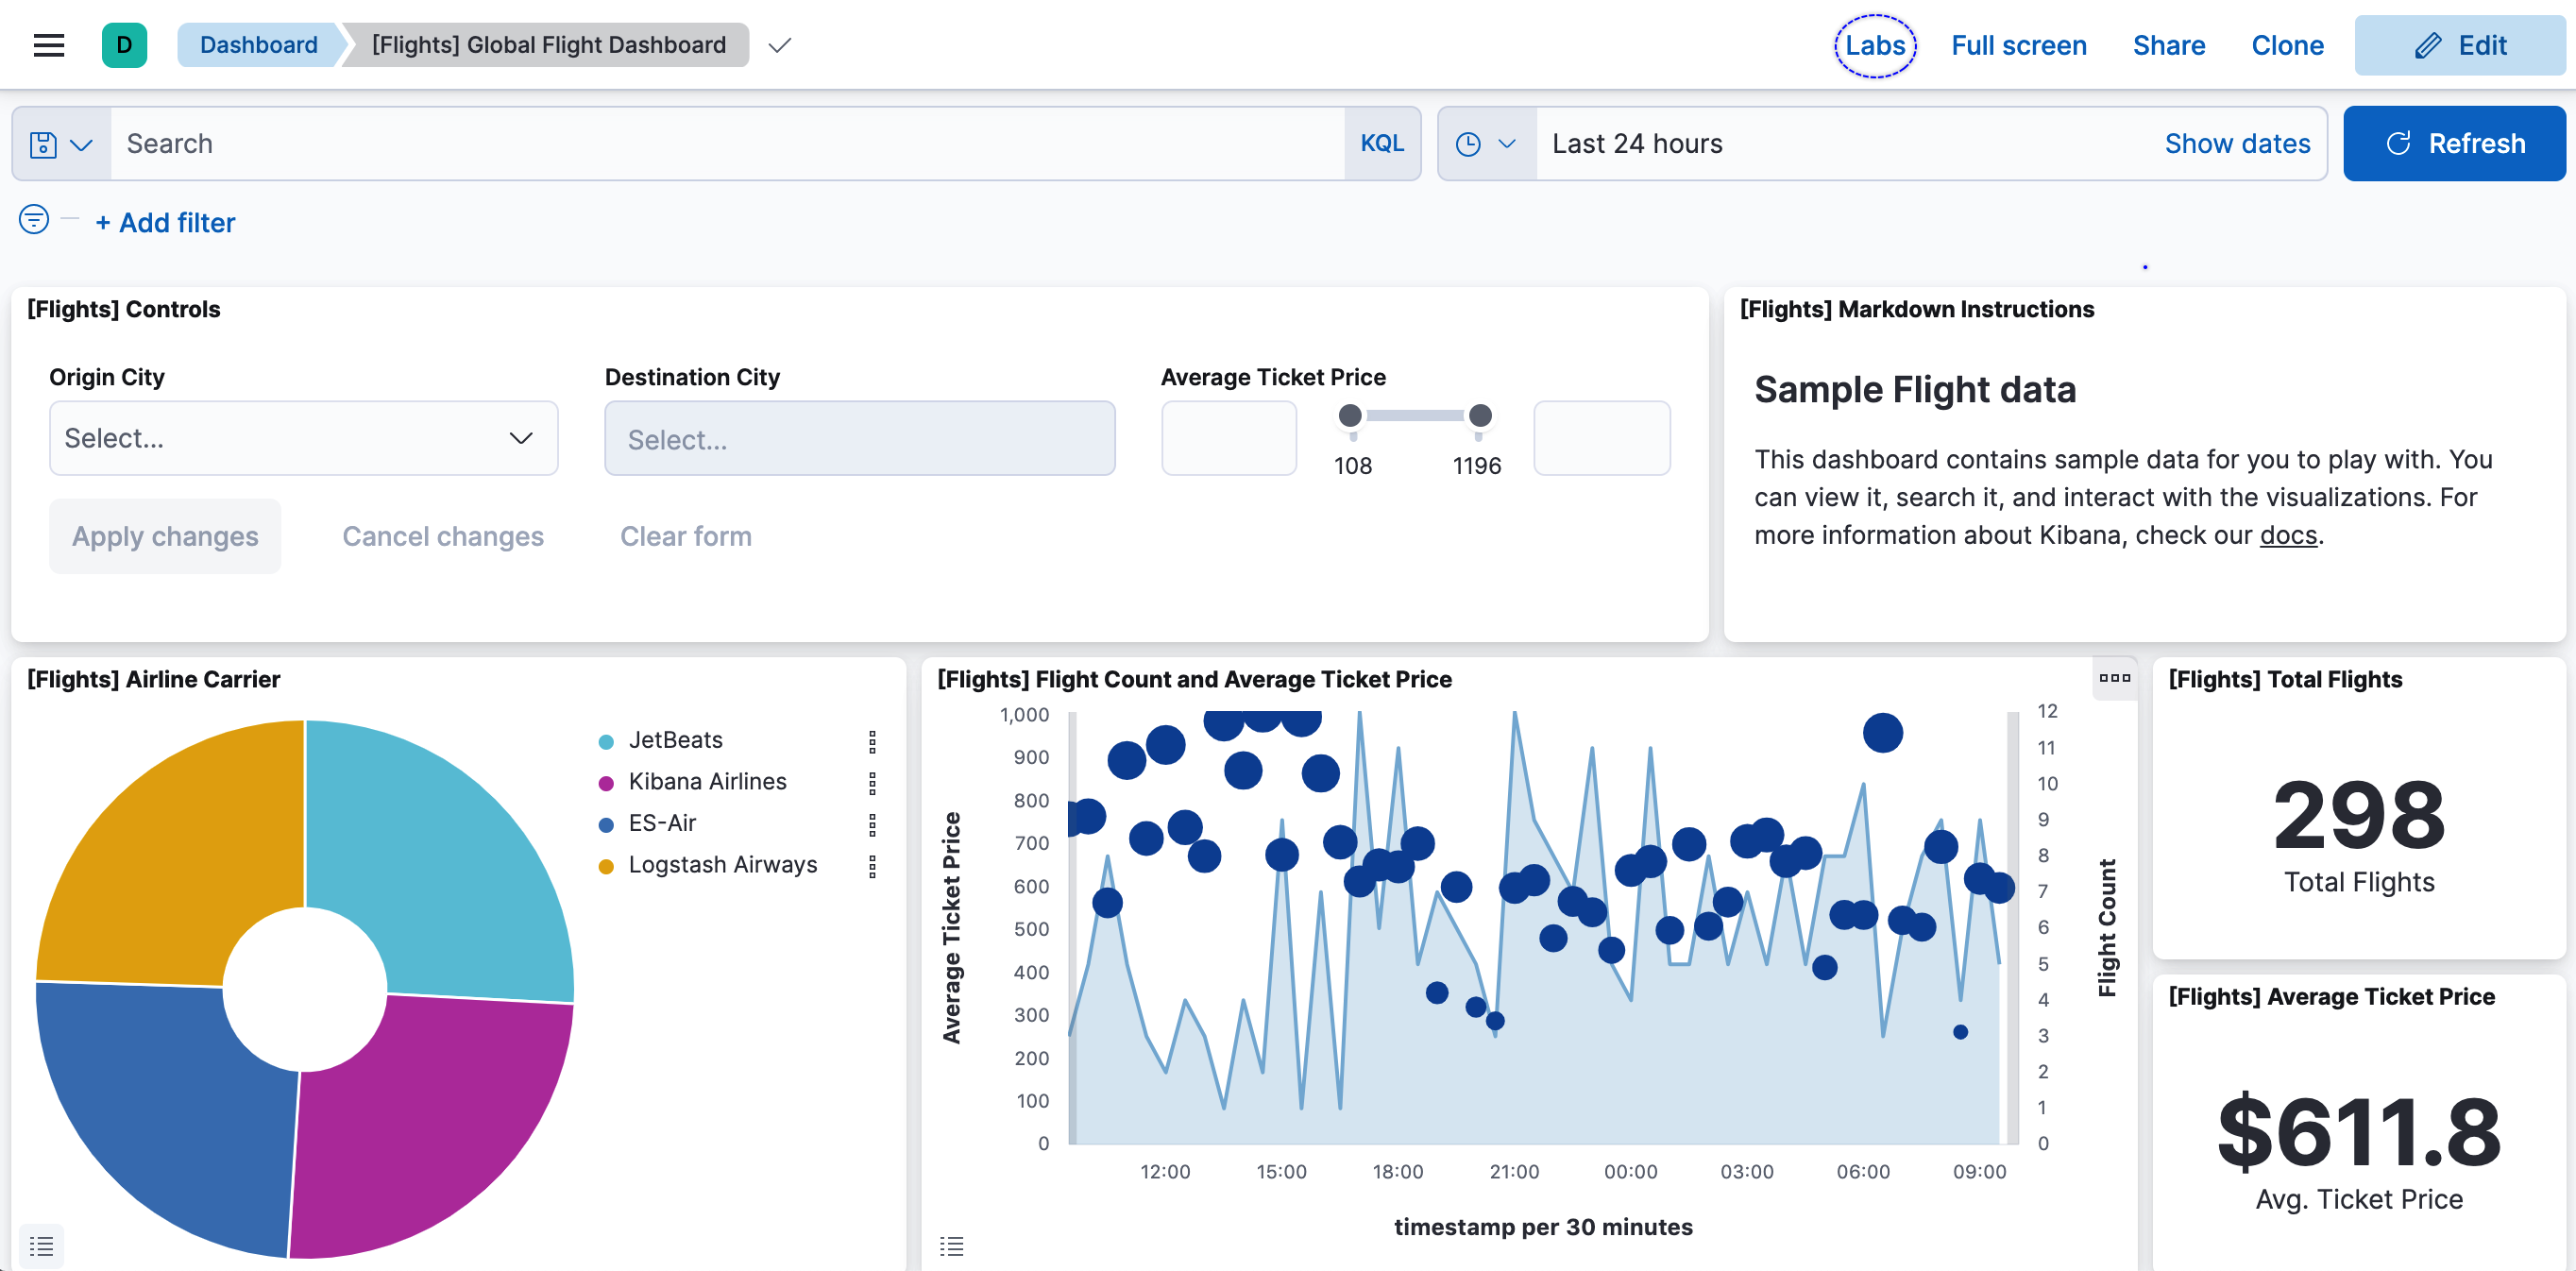
The first Labs project is Defer loading panels below the fold. To improve dashboard loading time, only the visible panels are loaded when you open the dashboard. All other panels are loaded as you scroll. Give the Labs project a try, and let us know what you think.