Kibana highlights
editKibana highlights
editThis list summarizes the most important enhancements in Kibana 7.12.
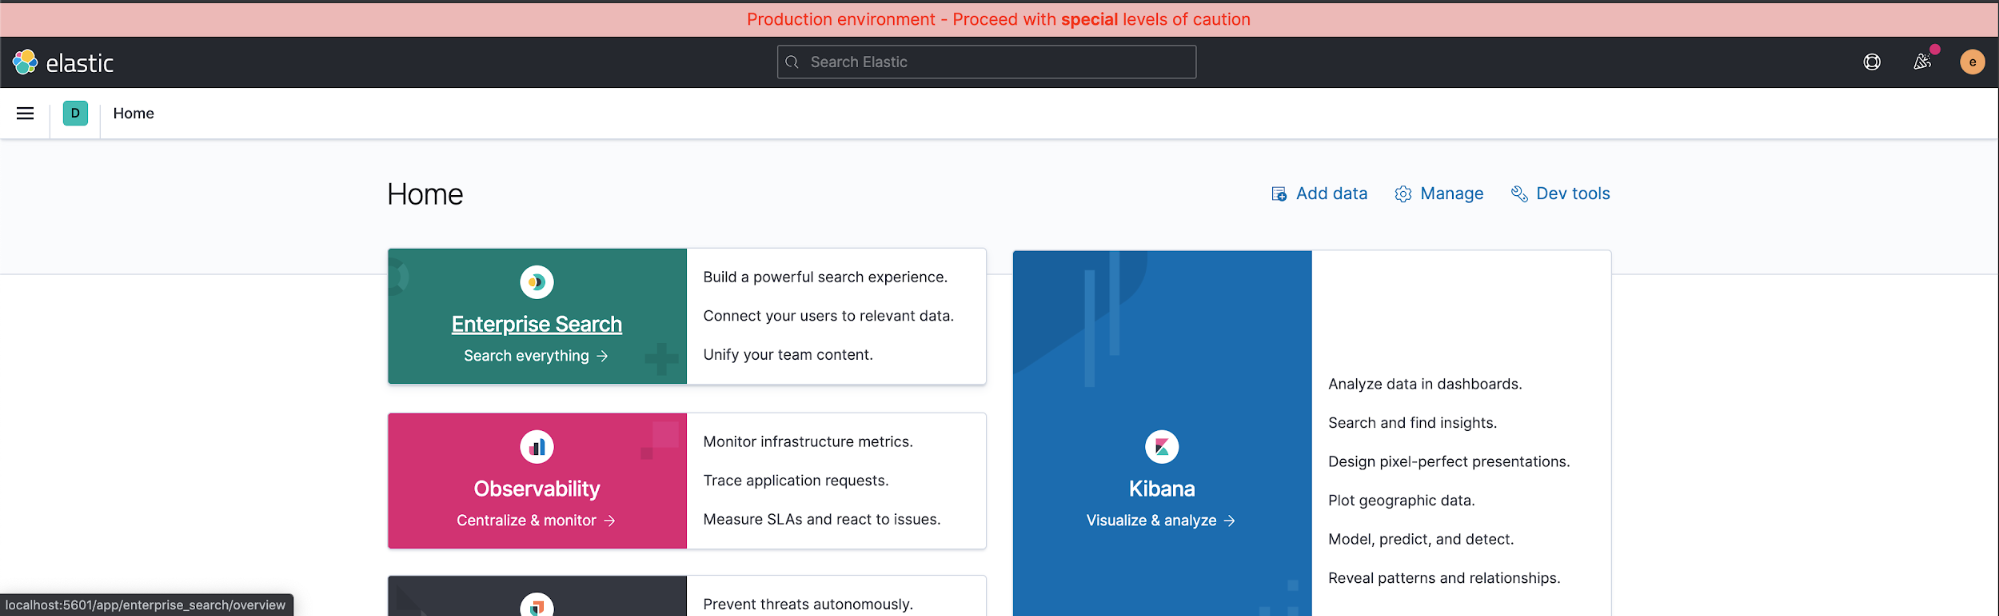
Custom global header
editWhether you have multiple Kibana instances running for different environments, need to provide some additional context for accreditation purposes, or simply want to customize Kibana, you can now add your own header. For more details on how to configure a global header, view the configuration settings. Customizable headers are a subscription feature.
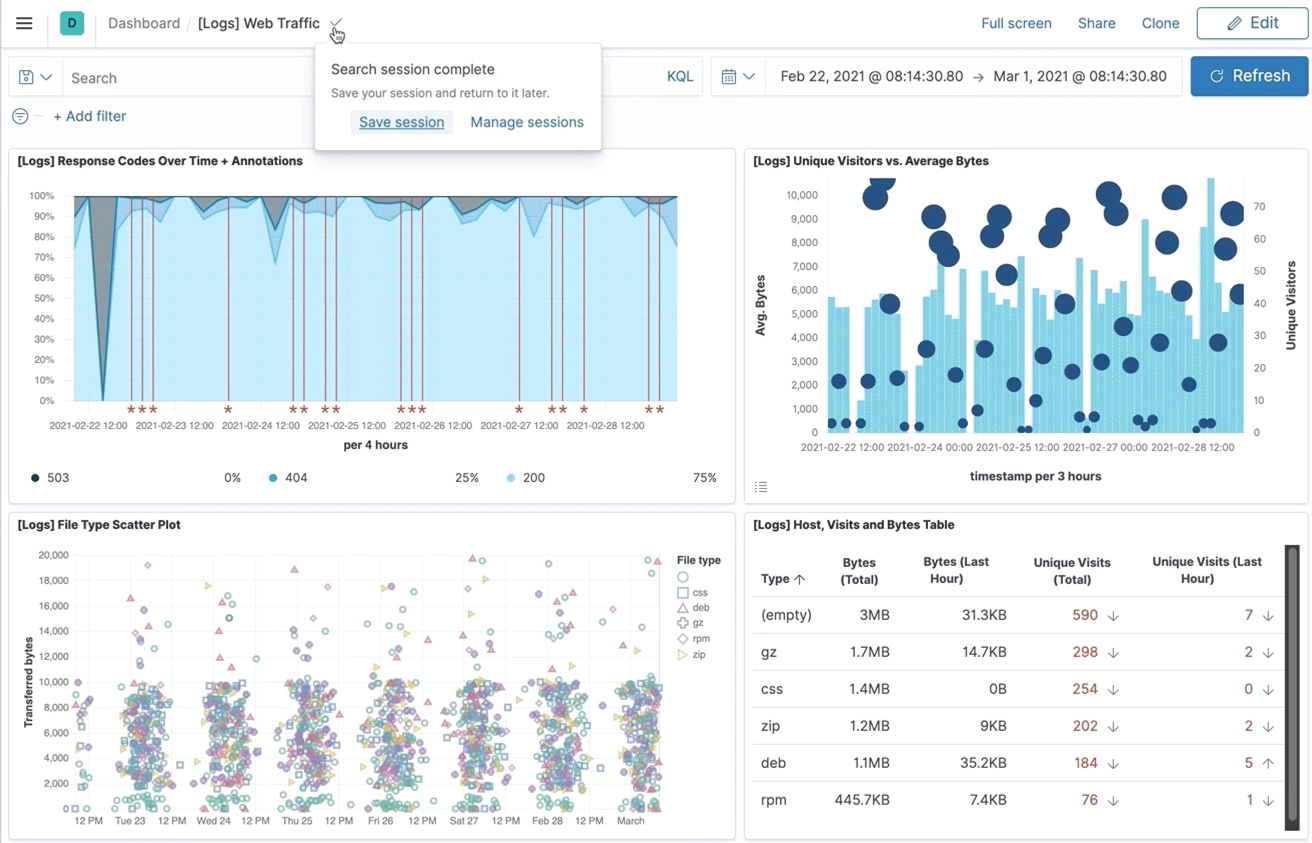
Search sessions for background search
editIncreasing data volumes and tiered storage systems mean some searches take a little longer. When searching frozen indices or using cold storage, there is no reason to sit and wait. Kibana now has search sessions, which give you control when Elasticsearch needs more time to complete a search.
Search sessions are groups of queries, from a dashboard for example, that run in the background for as long as needed. You can save a search session in Dashboard or Discover, close the browser window, and then come back once your searches are complete. A view of your managed search sessions is in Stack Management. For more information, refer to the documentation.
New flow for creating dashboards
editCreating dashboards is now quicker and easier with the new streamlined navigation between apps. Think dashboard-first, making it easy to create new visualizations and add them in place, without interrupting the dashboard building process. For more information about this new workflow, refer to Dashboard.
The 7.12 release also brings:
- Visualize Library. Visualize is now Visualize Library to reflect its new function as the home for all of your saved panels.
- Copy to dashboard. Have a panel that you want to instantly copy to a new or existing dashboard? Now you can right from the panel menu.
- Quick save. A new Save option in the toolbar lets you quickly save a dashboard without ending your editing session. To rename the dashboard or save as a copy press Save as.
Runtime fields in Discover
editDiscover now shows all fields, including runtime fields,
multi-mapped fields like .keyword, and alias fields.
Refer to
the blog announcing the change to Discover.
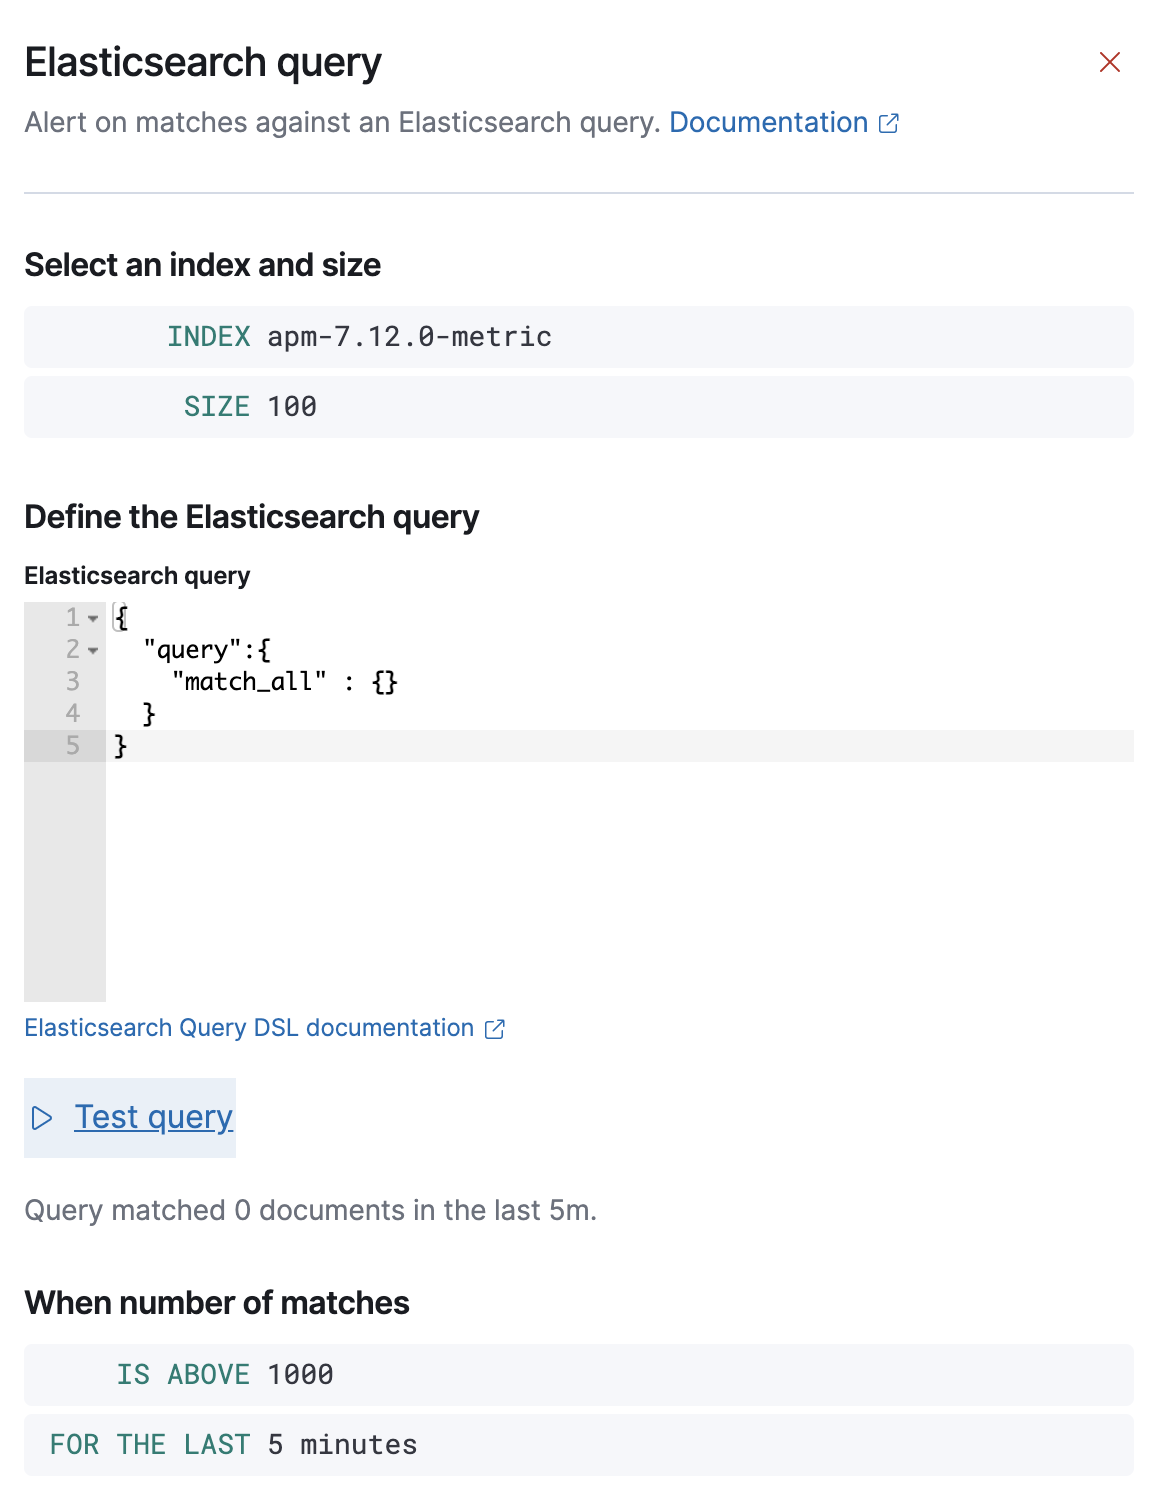
Elasticsearch query alert
editThe new Elasticsearch query alert allows you to create alerts using DSL queries. Use this alert with any of your indices and get alerted on the number of matching documents. The Elasticsearch query alert is especially good for advanced use cases where you want to create custom alerts with custom DSL queries.
Maps—location-based alerts and polygon labels
editThe 7.12 release brings the tracking containment alert to GA. This alert allows you to monitor an entity’s location as it relates to a boundary, triggering a notification while contained, or when entering or leaving a boundary. Also known as “geo-fencing”, this feature is common for tracking the movement of devices, such as vehicles within a fleet. The tracking containment alert is a subscription feature.
If you are using the Maps app, you are now able to add labels to the polygons and lines in your map. This feature can give anyone working with your map the right context for analysis.
URL drilldowns generally available
editURL drilldowns, which enable you to navigate from a dashboard to internal or external URLs, are now generally available. For more information, refer to URL drilldowns.
Lens—functions, interactions, and table improvements
editLens now supports even more functions to meet your visualization needs, including percentiles, cumulative sum, moving average, counter rate, and differences. To give the new functions a try, take a look at the new Lens tutorial.
To significantly speed up the visualization creation process, Lens now has a fully accessible drag and drop system. For more information, refer to Lens.
To customize the data table, Lens now has options for column resize, text alignment, and the ability to hide columns.
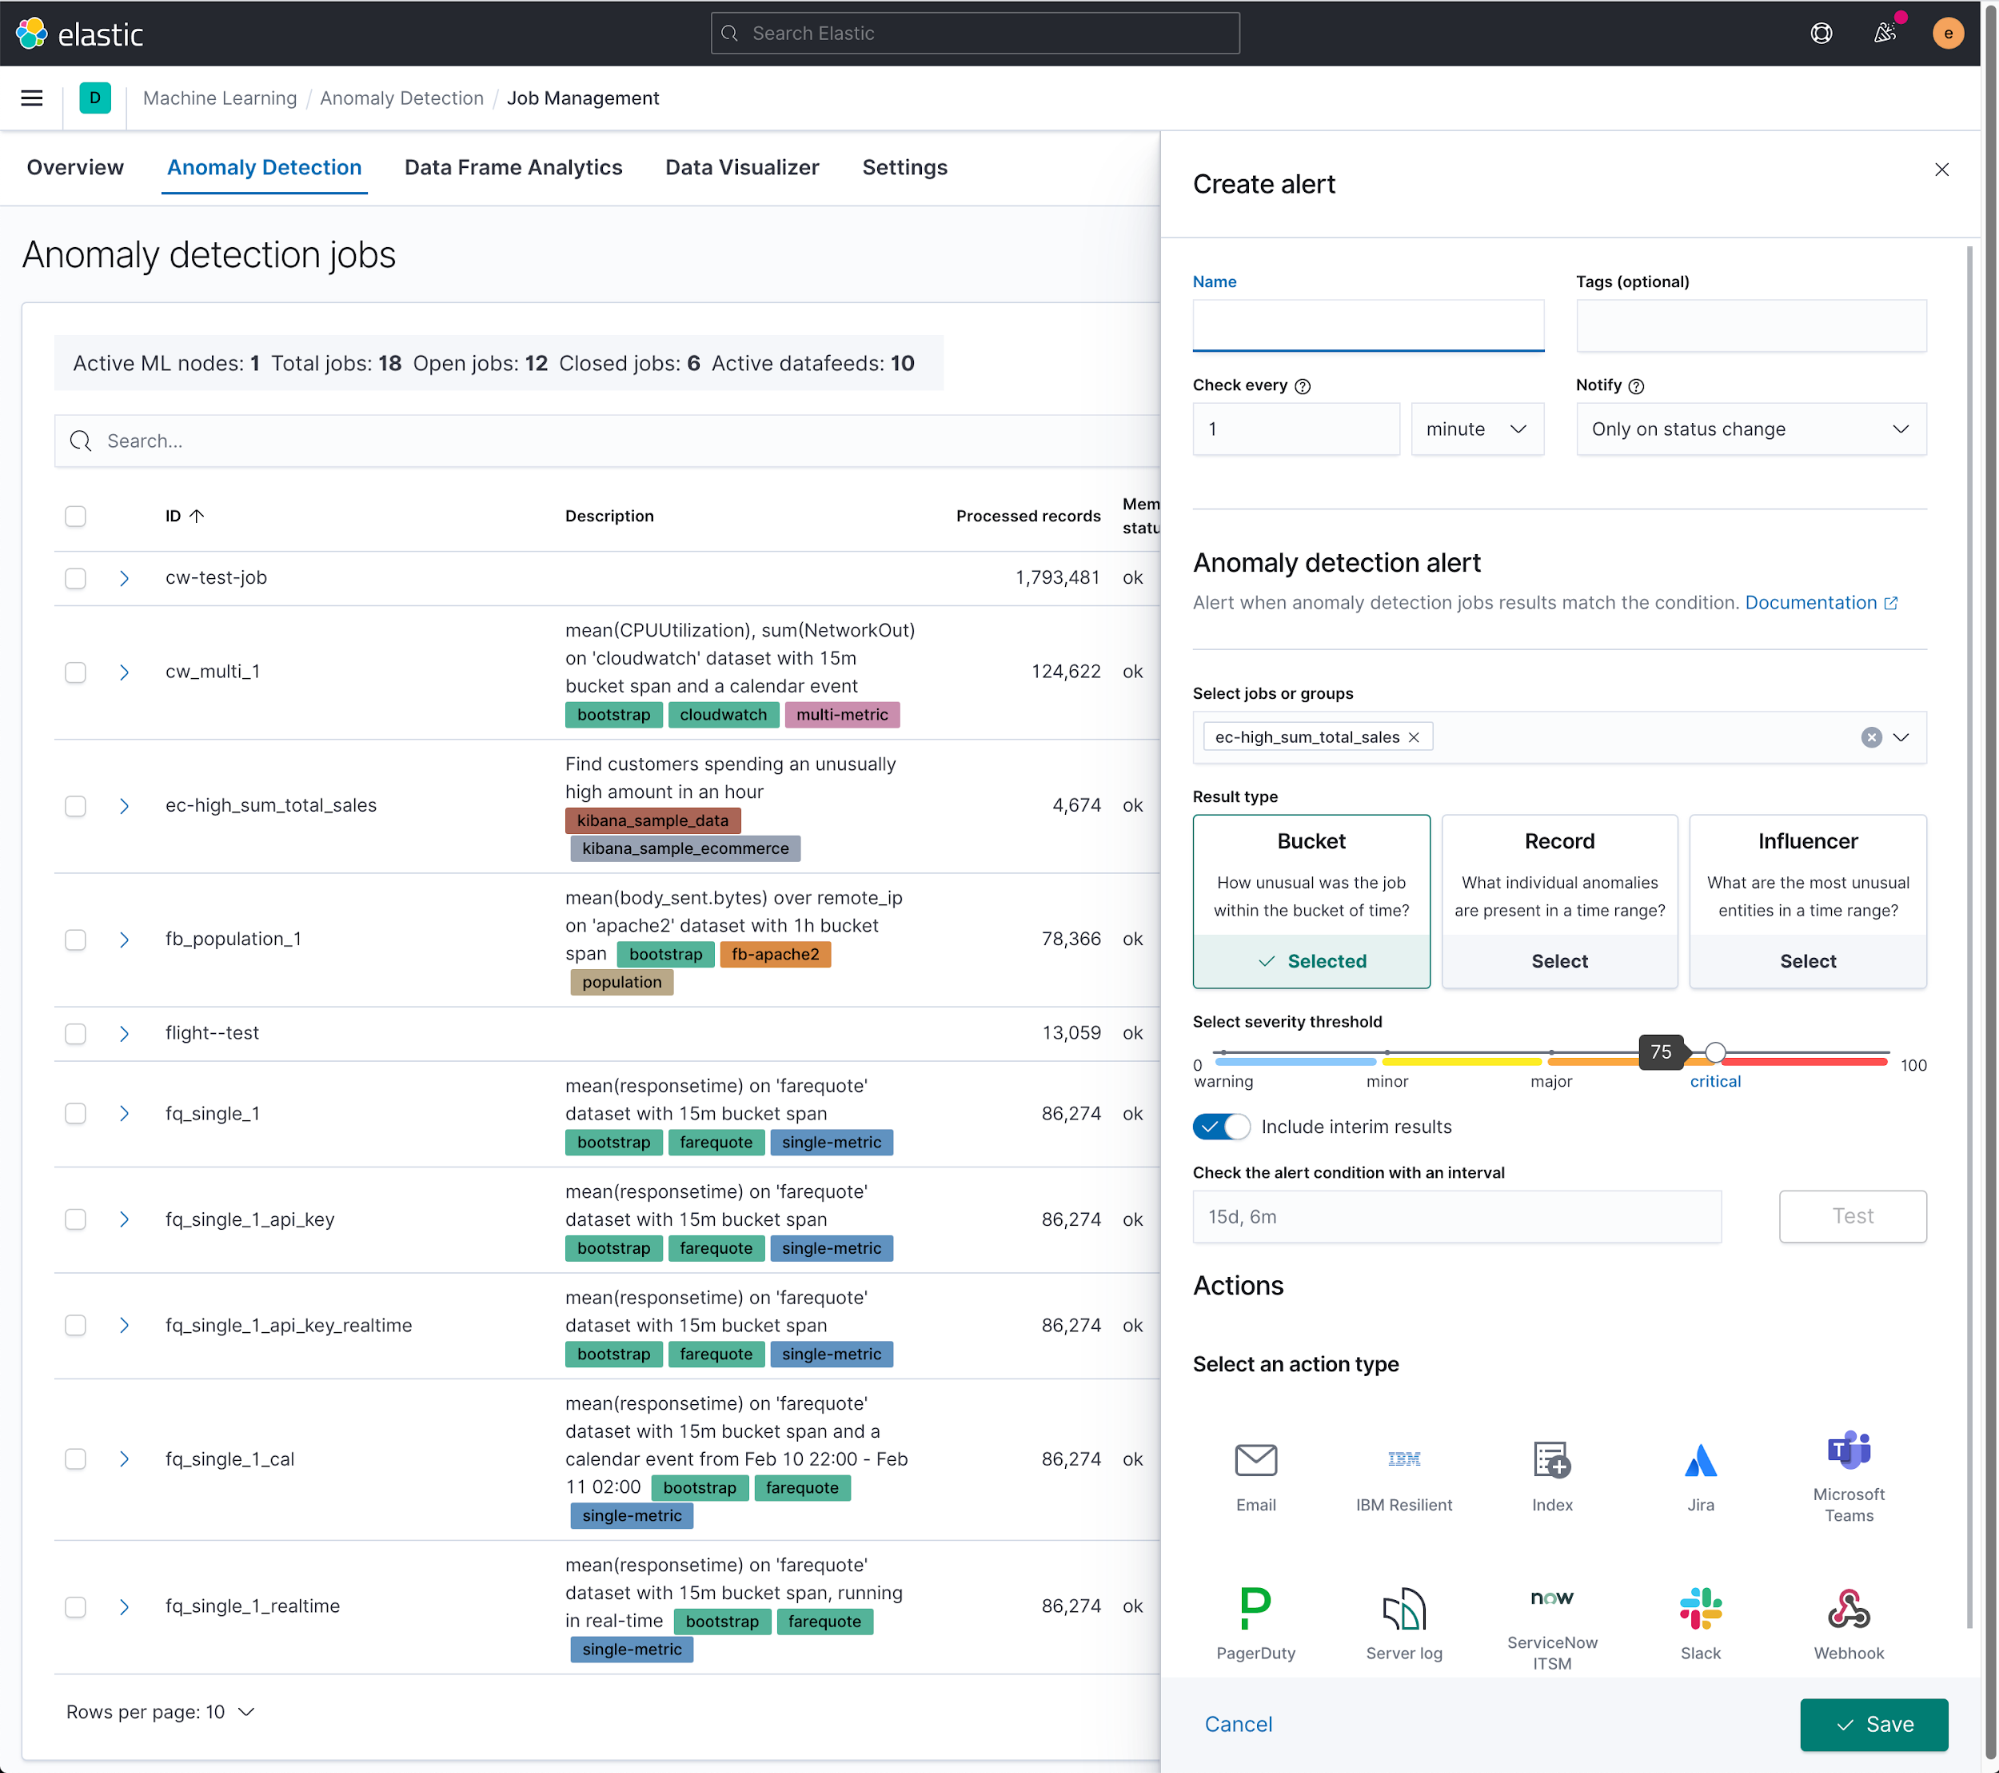
Anomaly detection alerts (beta)
editThis release provides more flexible, more intuitive, easier to set-up alerting for anomaly detection. Anomaly detection alerts are integrated with the Kibana alerting framework, so you can quickly create alerts for your anomaly detection jobs. This new type of alert can be created for existing jobs from the Alerts page under Stack Management or from the machine learning job list, or at the end of the Anomaly Detection job wizard.
You can pick the type of results you want to be alerted on, depending on whether you are interested in the overall anomaly score for the job, individual anomalies, or entities behaving unusually over time. The new alert type replaces the current machine learning integration with Watcher.
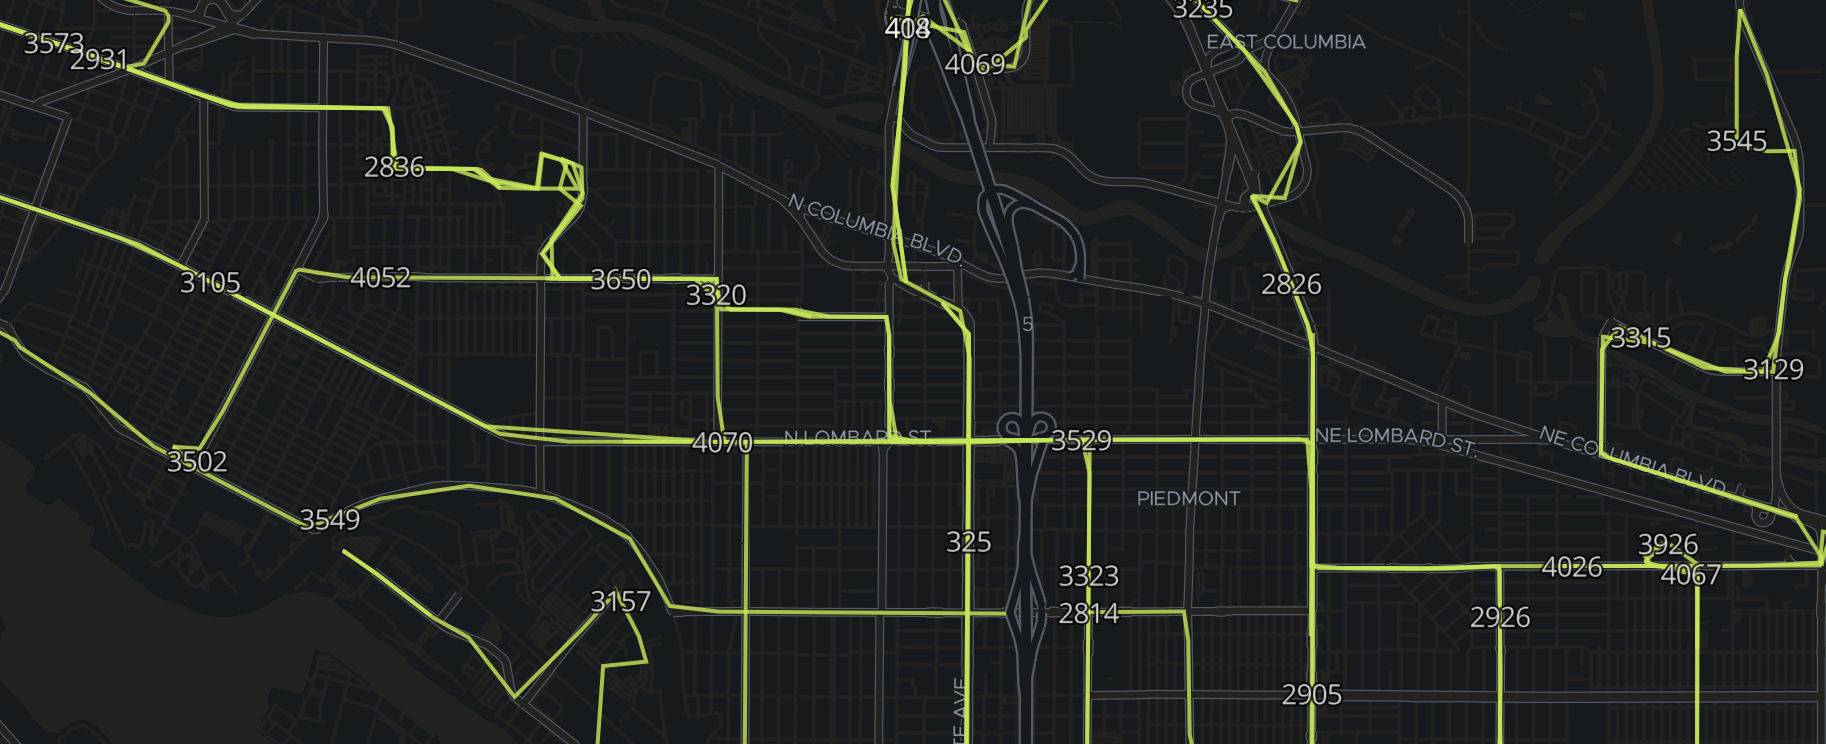
Machine learning integration with Maps
editThis integration enables you to view geographic data inside the Machine Learning and anomaly data inside Maps. The redesigned Data Visualizer shows the distribution of values for geo_point field types.
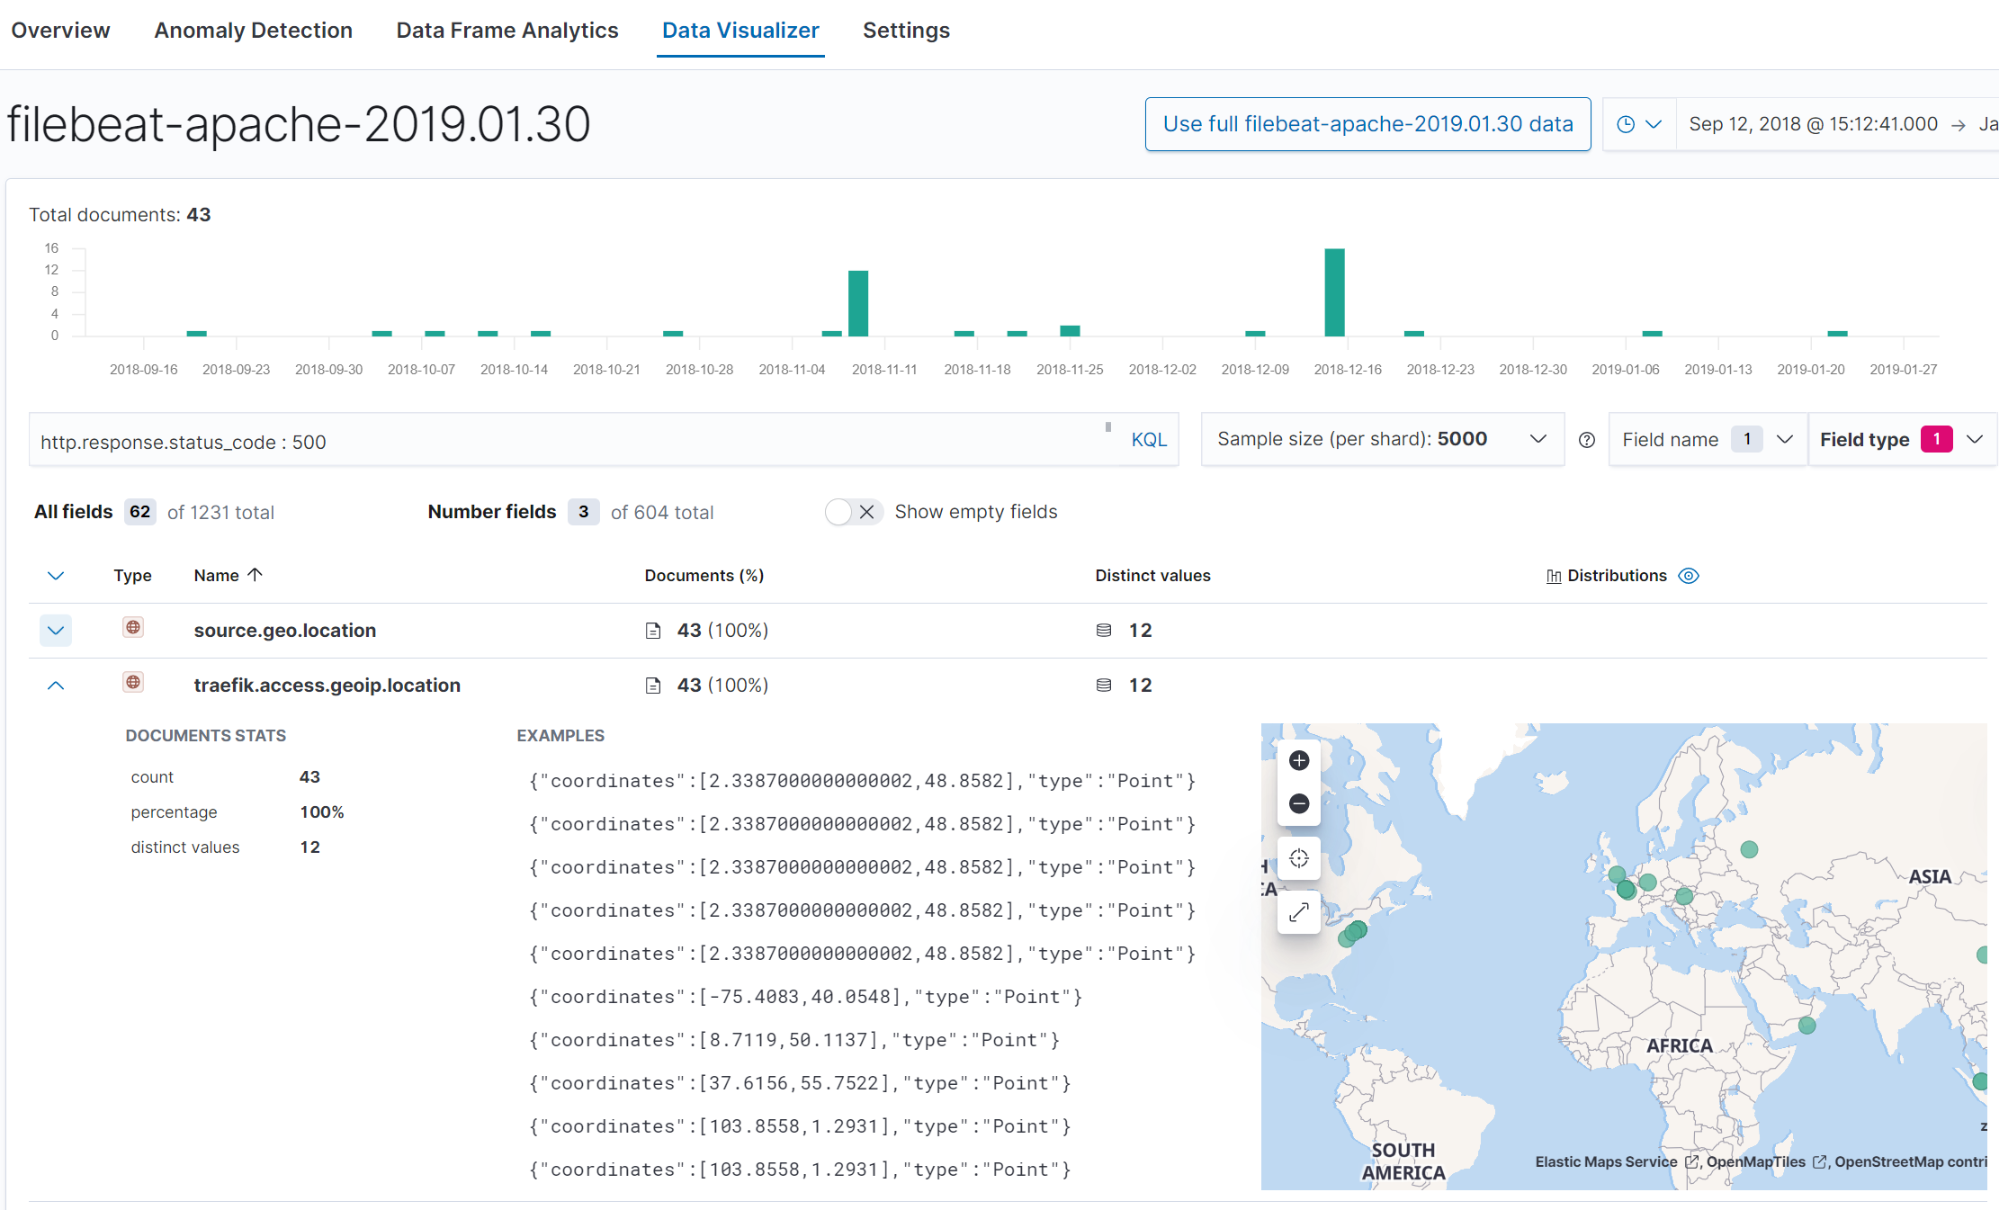
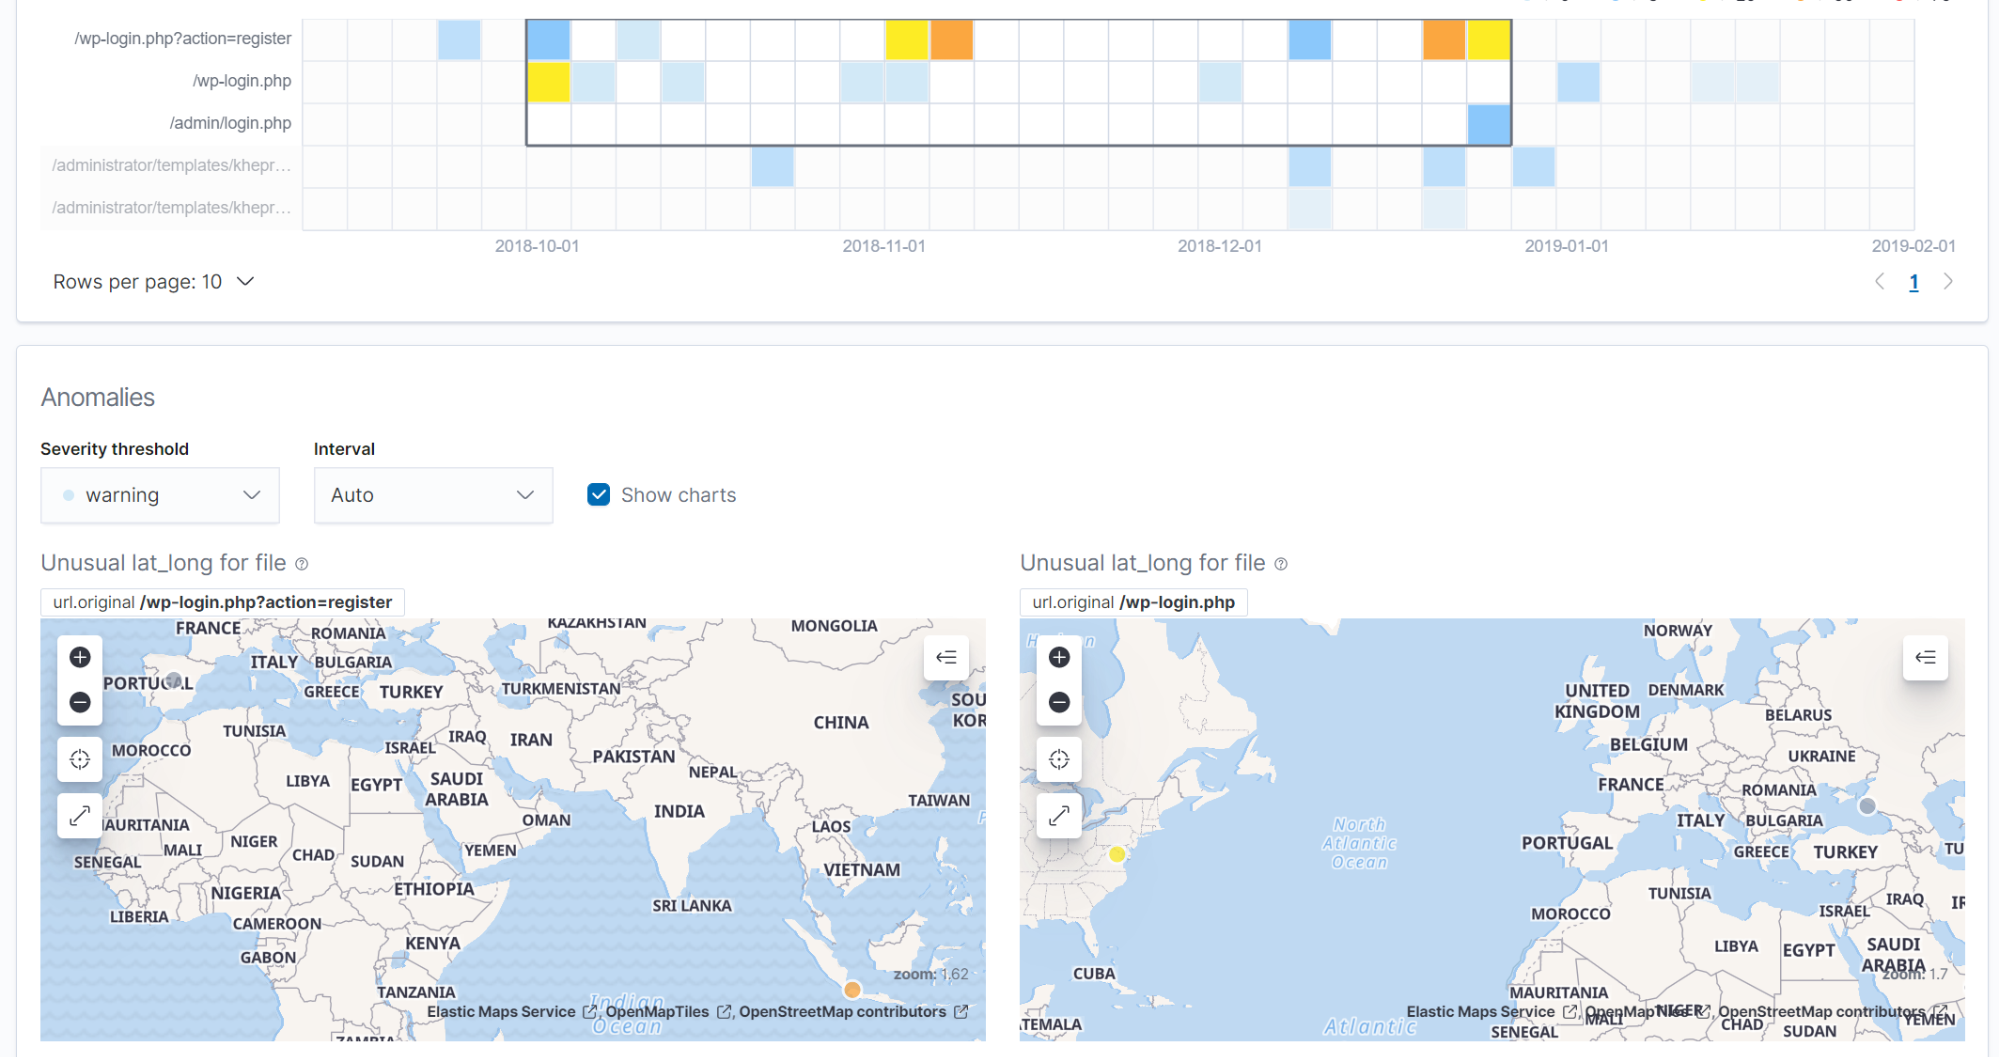
For jobs that use the lat_long function to detect anomalies in the geographic location of the input data, the Anomaly Explorer shows the actual and typical locations on maps.
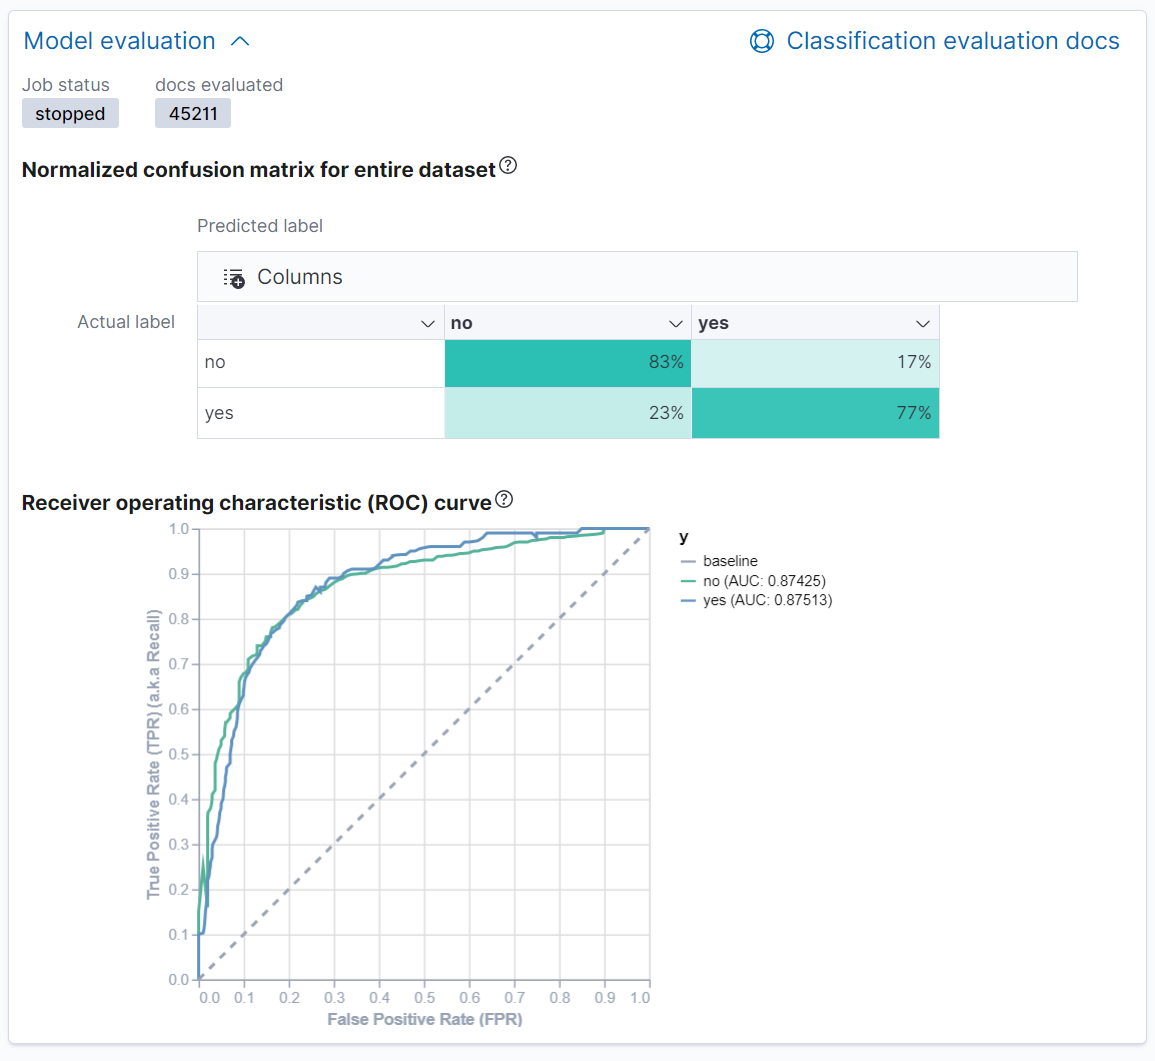
AUC ROC visualization for classification jobs
editPerformance measurement is an essential part of machine learning, and for classification models, the AUC ROC (Area Under the Curve of Receiver Operating Characteristics) is one of the most important evaluation metrics for checking model performance. You can view the ROC curve in the data frame analytics job results in Kibana. The AUC value is calculated from this curve, as a number between 0 and 1. A higher value means the model is more precise in predicting the class correctly.