Create custom dashboard actions
editCreate custom dashboard actions
editCustom dashboard actions, also known as drilldowns, allow you to create workflows for analyzing and troubleshooting your data. Drilldowns apply only to the panel that you created the drilldown from, and are not shared across all of the panels. Each panel can have multiple drilldowns.
Third-party developers can create drilldowns. To learn how to code drilldowns, refer to this example plugin.
Supported drilldowns
editKibana supports two types of drilldowns.
Some drilldowns are paid subscription features, while others are free. For a comparison of the Elastic subscription levels, refer the subscription page.
Dashboard drilldowns
editDashboard drilldowns enable you to open a dashboard from another dashboard, taking the time range, filters, and other parameters with you, so the context remains the same. Dashboard drilldowns help you to continue your analysis from a new perspective.
For example, if you have a dashboard that shows the overall status of multiple data center, you can create a drilldown that navigates from the overall status dashboard to a dashboard that shows a single data center or server.
URL drilldowns
editURL drilldowns enable you to navigate from a dashboard to internal or external URLs. Destination URLs can be dynamic, depending on the dashboard context or user interaction with a panel. For example, if you have a dashboard that shows data from a Github repository, you can create a URL drilldown that opens Github from the dashboard.
Some panels support multiple interactions, also known as triggers. The variables you use to create a URL template depends on the trigger you choose. URL drilldowns support these types of triggers:
- Single click — A single data point in the visualization.
- Range selection — A range of values in a visualization.
For example, Single click has {{event.value}} and Range selection has {{event.from}} and {{event.to}}.
To disable URL drilldowns on your Kibana instance, add the following line to kibana.yml config file:
url_drilldown.enabled: false
URL drilldown also respects the global External URL service, which can be used to deny/allow external URLs.
By default all external URLs are allowed. To configure external URL policies you need to use externalUrl.policy setting in kibana.yml, for example:
externalUrl.policy:
  - allow: false
    host: danger.example.com
  - allow: true
    host: example.com
    protocol: https
The above rules allow external URLs only to example.com domain with https scheme, except for danger.example.com sub-domain,
which is denied even when https scheme is used.
Supported panels
editThe following panels support dashboard and URL drilldowns.
| Panel | Dashboard drilldown | URL drilldown |
|---|---|---|
Lens |
X |
X |
Area |
X |
X |
Controls |
||
Data Table |
X |
X |
Gauge |
||
Goal |
||
Heat map |
X |
X |
Horizontal Bar |
X |
X |
Line |
X |
X |
Maps |
X |
X |
Markdown |
||
Metric |
||
Pie |
X |
X |
TSVB |
X |
|
Tag Cloud |
X |
X |
Timelion |
X |
|
Vega |
X |
|
Vertical Bar |
X |
X |
Try it: Create a dashboard drilldown
editTo create dashboard drilldowns, you create or locate the dashboards you want to connect, then configure the drilldown that allows you to easily open one dashboard from the other dashboard.
Create the dashboard
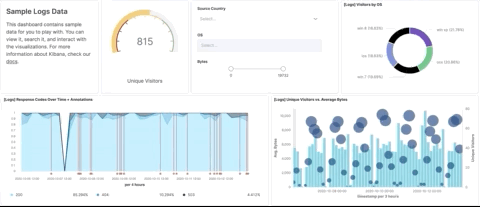
edit- Add the Sample web logs data.
-
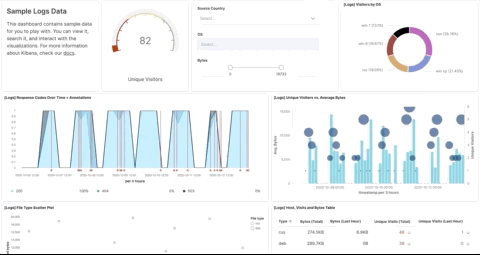
Create a new dashboard, then add the following panels:
- [Logs] Heatmap
- [Logs] Host, Visits, and Bytes Table
- [Logs] Total Requests and Bytes
-
[Logs] Visitors by OS
If you don’t see data for a panel, try changing the time filter.
-
Save the dashboard. In the Title field, enter
Host Overview. - Open the [Logs] Web traffic dashboard.
-
Set a search and filter.
Search:
extension.keyword: ("gz" or "css" or "deb")
Filter:geo.src: CN
Create the drilldown
edit- In the toolbar, click Edit.
- Open the [Logs] Visitors by OS panel menu, then select Create drilldown.
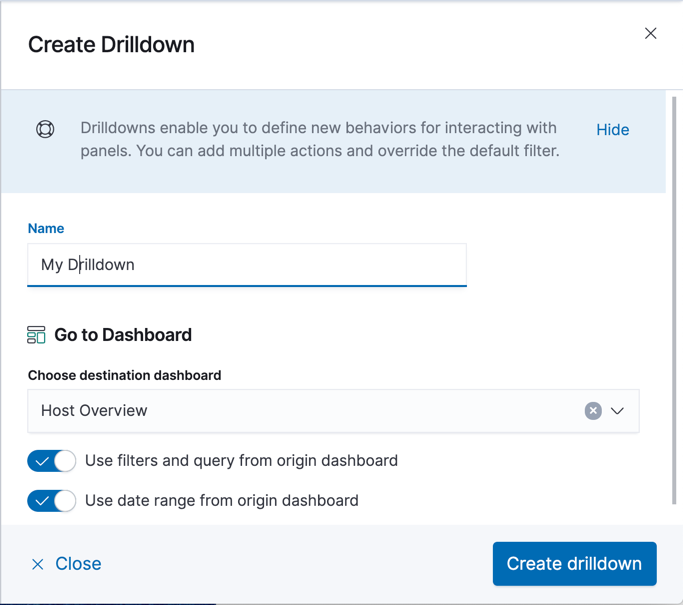
- Give the drilldown a name, then select Go to dashboard.
- From the Choose a destination dashboard dropdown, select Host Overview.
-
To carry over the filter, query, and date range, make sure that Use filters and query from origin dashboard and Use date range from origin dashboard are selected.
-
Click Create drilldown.
The drilldown is stored as dashboard metadata.
-
Save the dashboard.
If you fail to save the dashboard, the drilldown is lost when you navigate away from the dashboard.
-
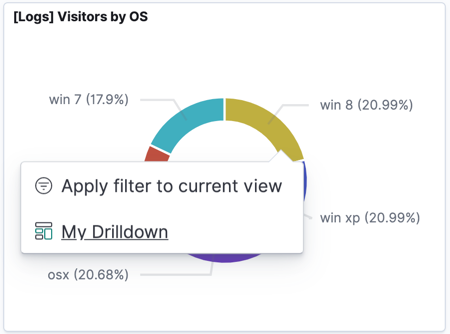
In the [Logs] Visitors by OS panel, click win 8, then select the drilldown.
- On the Host Overview dashboard, verify that the search query, filters, and date range are carried over.
Try it: Create a URL drilldown
editTo create URL drilldowns, you add variables to a URL template, which configures the behavior of the drilldown.
- Add the Sample web logs data.
- Open the [Logs] Web traffic dashboard. This isn’t data from Github, but works for demonstration purposes.
- In the toolbar, click Edit.
-
Open the [Logs] Visitors by OS panel menu, then select Create drilldown.
-
In the Name field, enter
Show on Github. - Select Go to URL.
-
Enter the URL template:
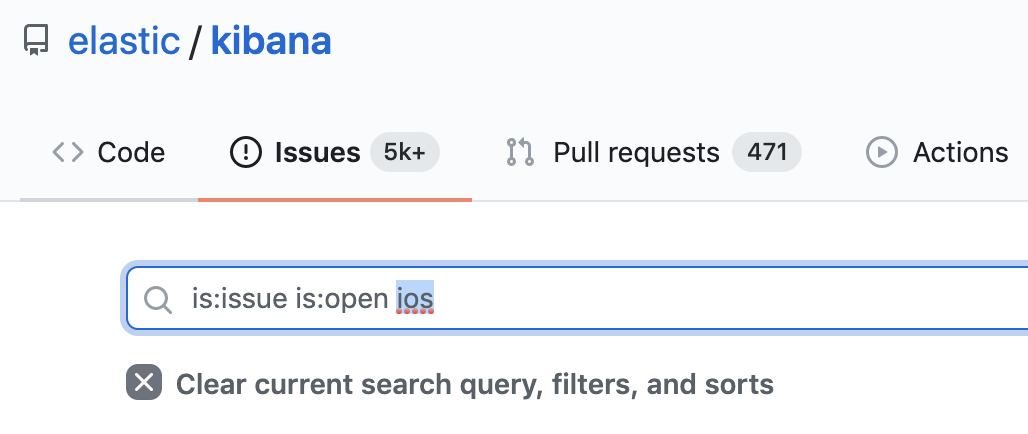
https://github.com/elastic/kibana/issues?q=is:issue+is:open+{{event.value}}The example URL navigates to Kibana issues on Github.
{{event.value}}is substituted with a value associated with a selected pie slice.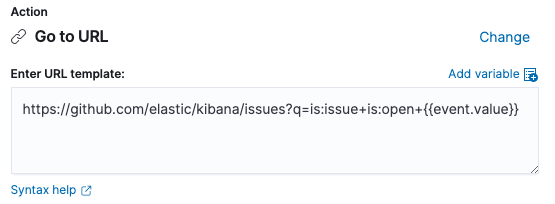
-
Click Create drilldown.
The drilldown is stored as dashboard metadata.
-
In the Name field, enter
-
Save the dashboard.
If you fail to save the dashboard, the drilldown is lost when you navigate away from the dashboard.
-
On the [Logs] Visitors by OS panel, click any chart slice, then select Show on Github.
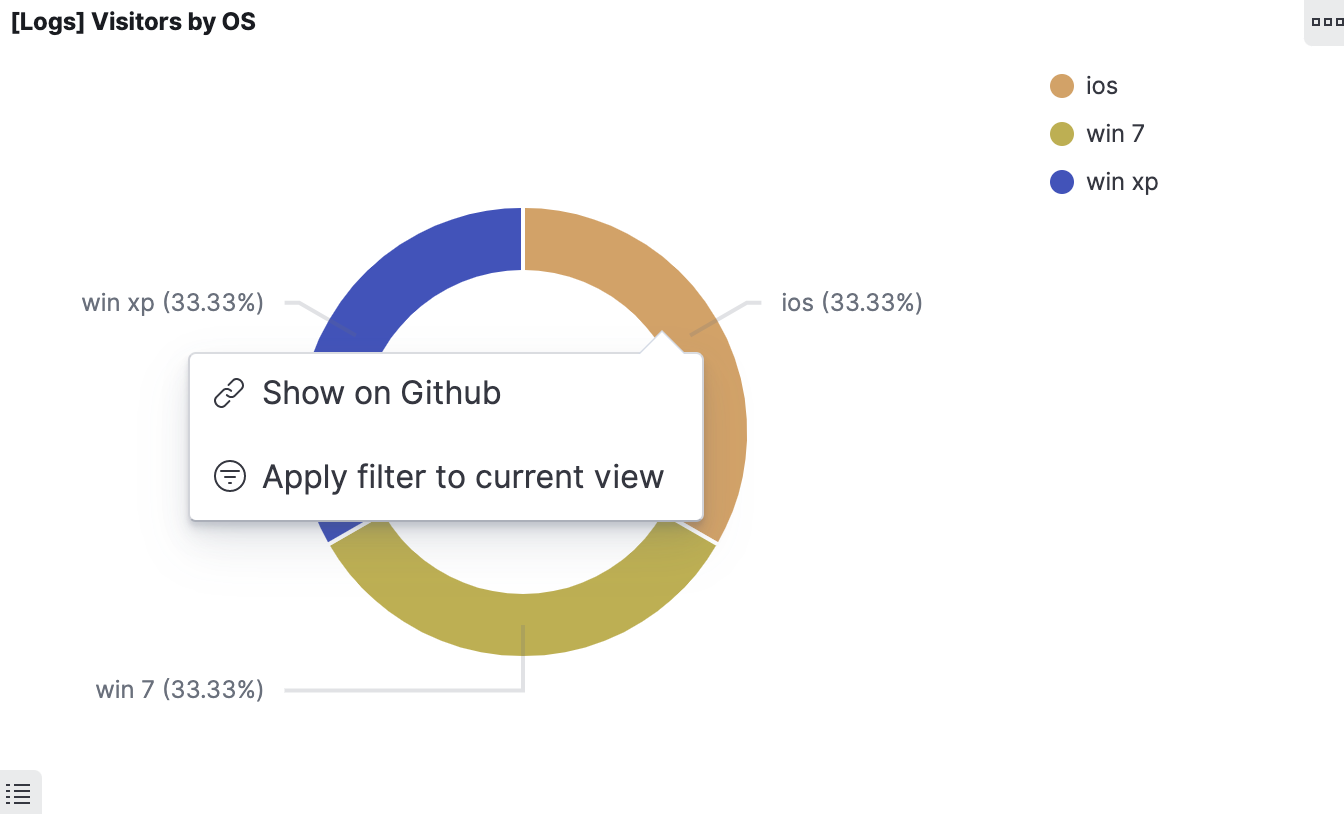
-
On the page that lists the issues in the Kibana repository, verify the slice value appears in Github.