You know, for visualizing your Logstash pipelines
Logstash's strength is its flexibility. With its minimalist syntax and rich set of plugins, users have been able to conjure up all kinds of Logstash pipelines — from very simple ones to fairly complex ones.
As you create increasingly sophisticated pipelines, you may have discovered that understanding these pipelines becomes harder. You might want to see the overall shape of your pipeline, understand where branches in data flow might be, and how the various parts of your pipeline perform under actual production conditions.
To help you answer some of these questions, we have introduced the Logstash Pipeline Viewer UI.
Concepts and Terminology
Before we talk some more about the Pipeline Viewer, it's necessary to understand some associated concepts and terminology first.
Every Logstash pipeline has an ID. If you define your pipelines using the -e or -f command-line options, your pipelines will have their ID set to "main". If you define your pipelines using pipelines.yml or Centralized Pipeline Management, you will be able to set your own pipeline IDs to something more descriptive like, say, "Apache Access Logs Processing".
For every (uniquely ID'd) pipeline, there can be multiple versions of that pipeline. What differentiates one version of a pipeline from another version of that pipeline are its contents. For instance, say you created a pipeline with ID = "p1" containing one input, one filter, and one output plugin. At this point, only one version of "p1" exists. At some point in the future, say you modified "p1" so it contained the same plugins as before but also included an additional filter plugin. Now "p1" would have two versions in existence - the original one and the changed one.
Since the version of a pipeline is based on its contents, Logstash will automatically calculate a version for you. It will look something like this: 2bcdb90830c2b1f6115a46769f3bf8e281540a53ba48b1c54db98ec486cf0cdb. This version currently only shows up in the Monitoring UI in Kibana (where the Pipeline Viewer feature lives), and even there it often shows up in a shortened form for ease of readability.
The Tour
Great! Now that you understand pipeline IDs and versions, let's dive into the Pipeline Viewer UI itself.
We assume that you have one or more Logstash pipelines currently running and sending monitoring data to Elasticsearch. Navigate to the Monitoring tab in Kibana and scroll down to the Logstash section. You might notice that there is a new item in this section called "Pipelines".
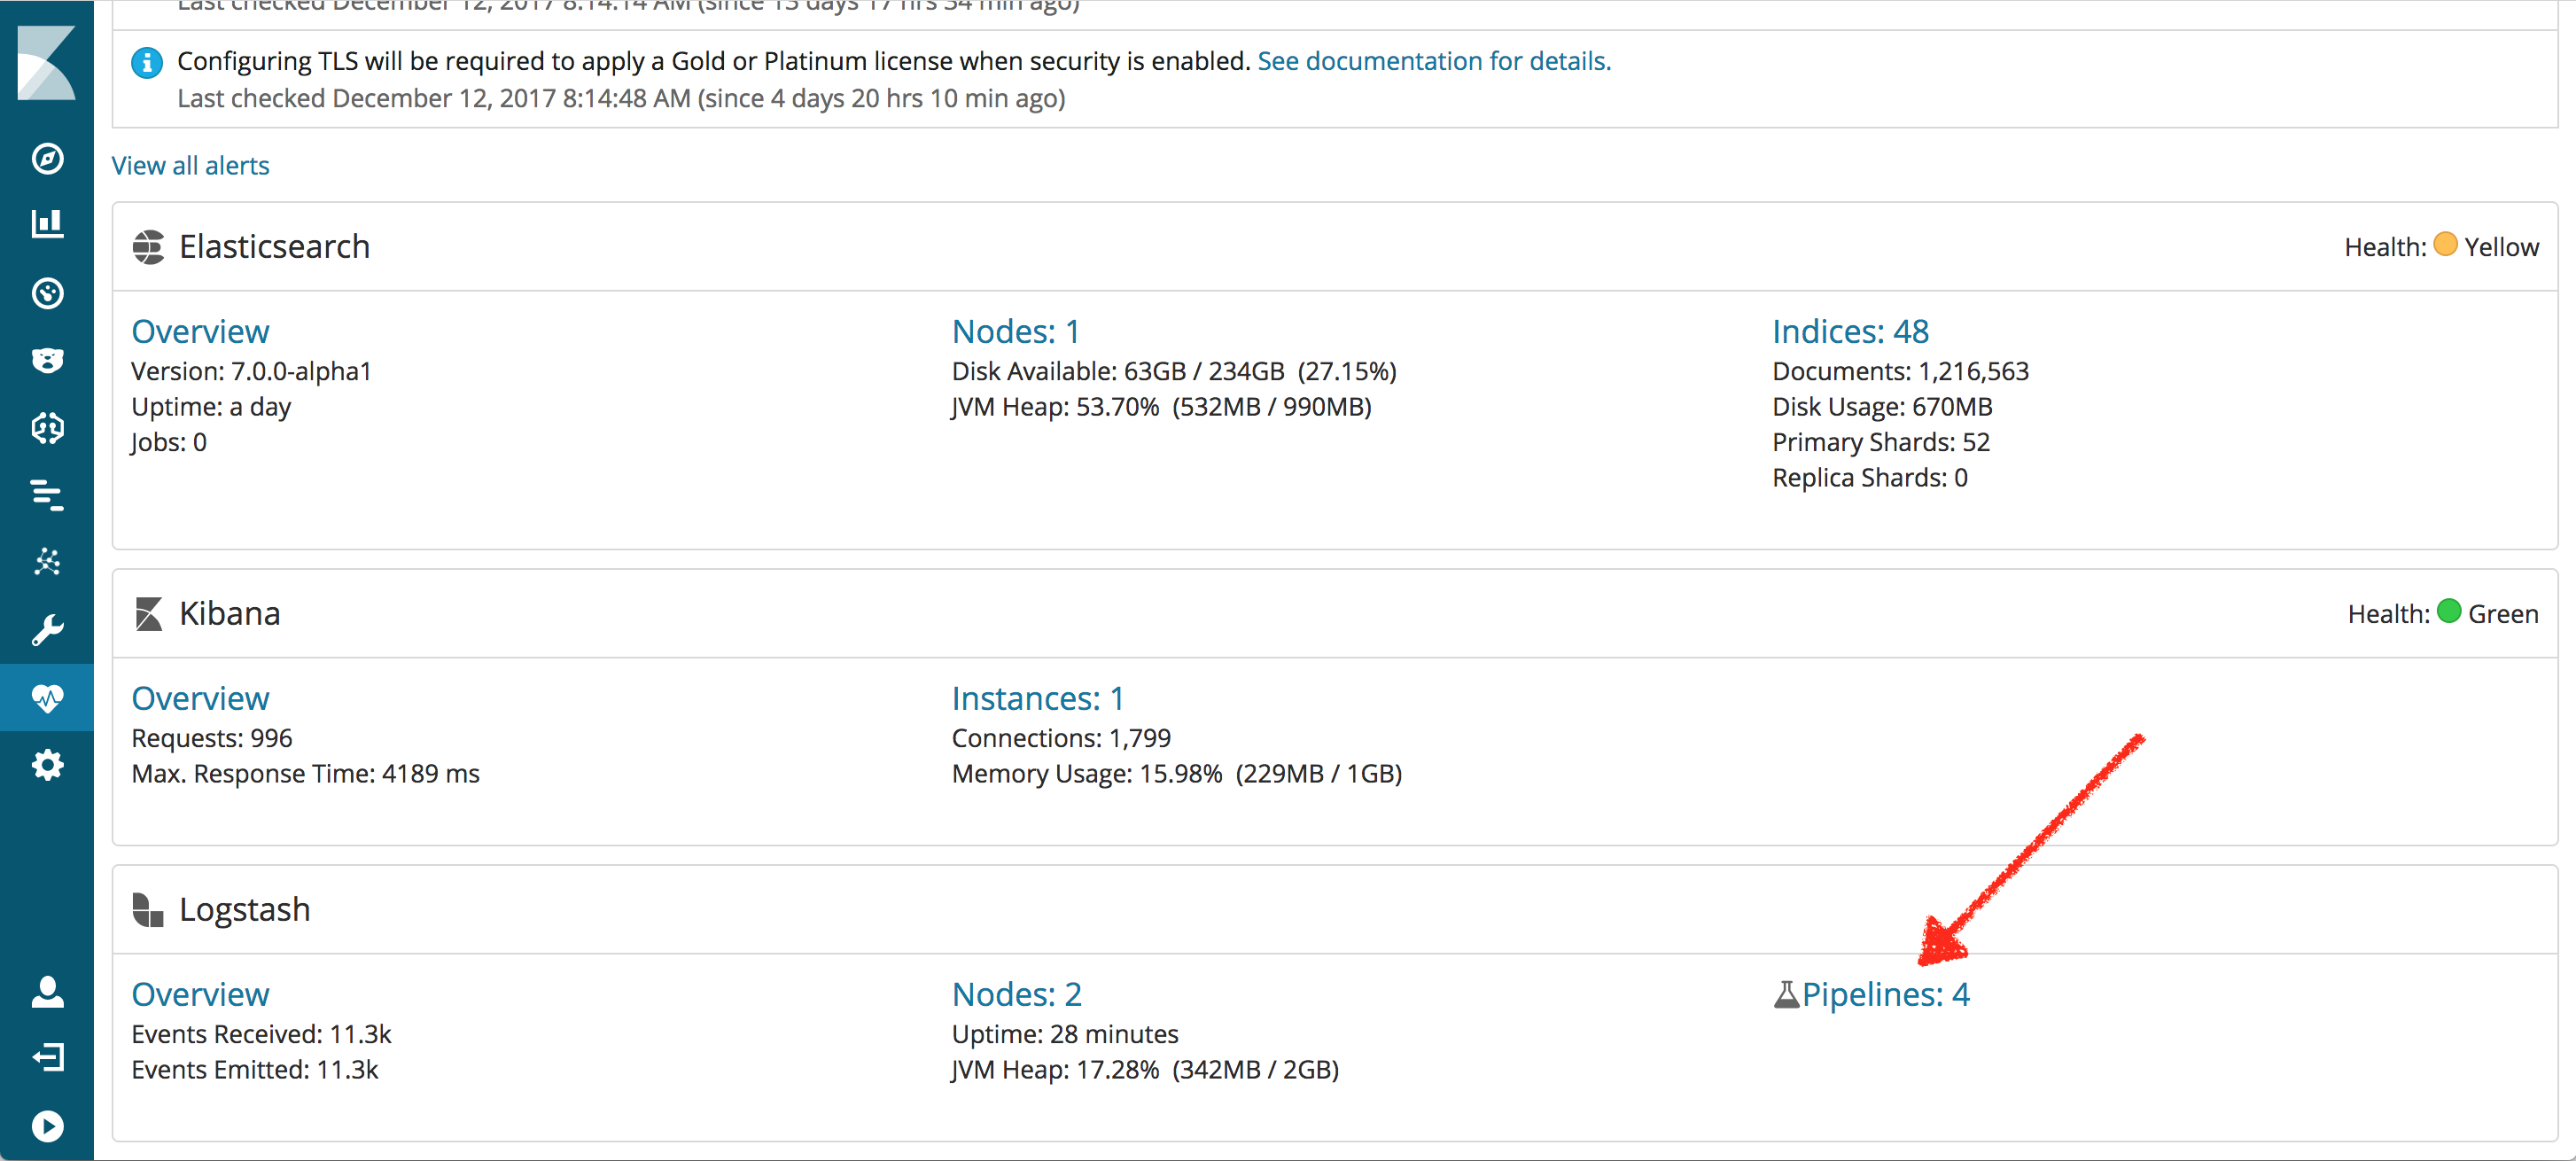
Clicking here shows you all pipelines across your Logstash deployment that have been running during the time window set by the Kibana Time Picker (top right of screen). For each pipeline the list of its versions that existed during the Kibana Time Picker time window are shown.
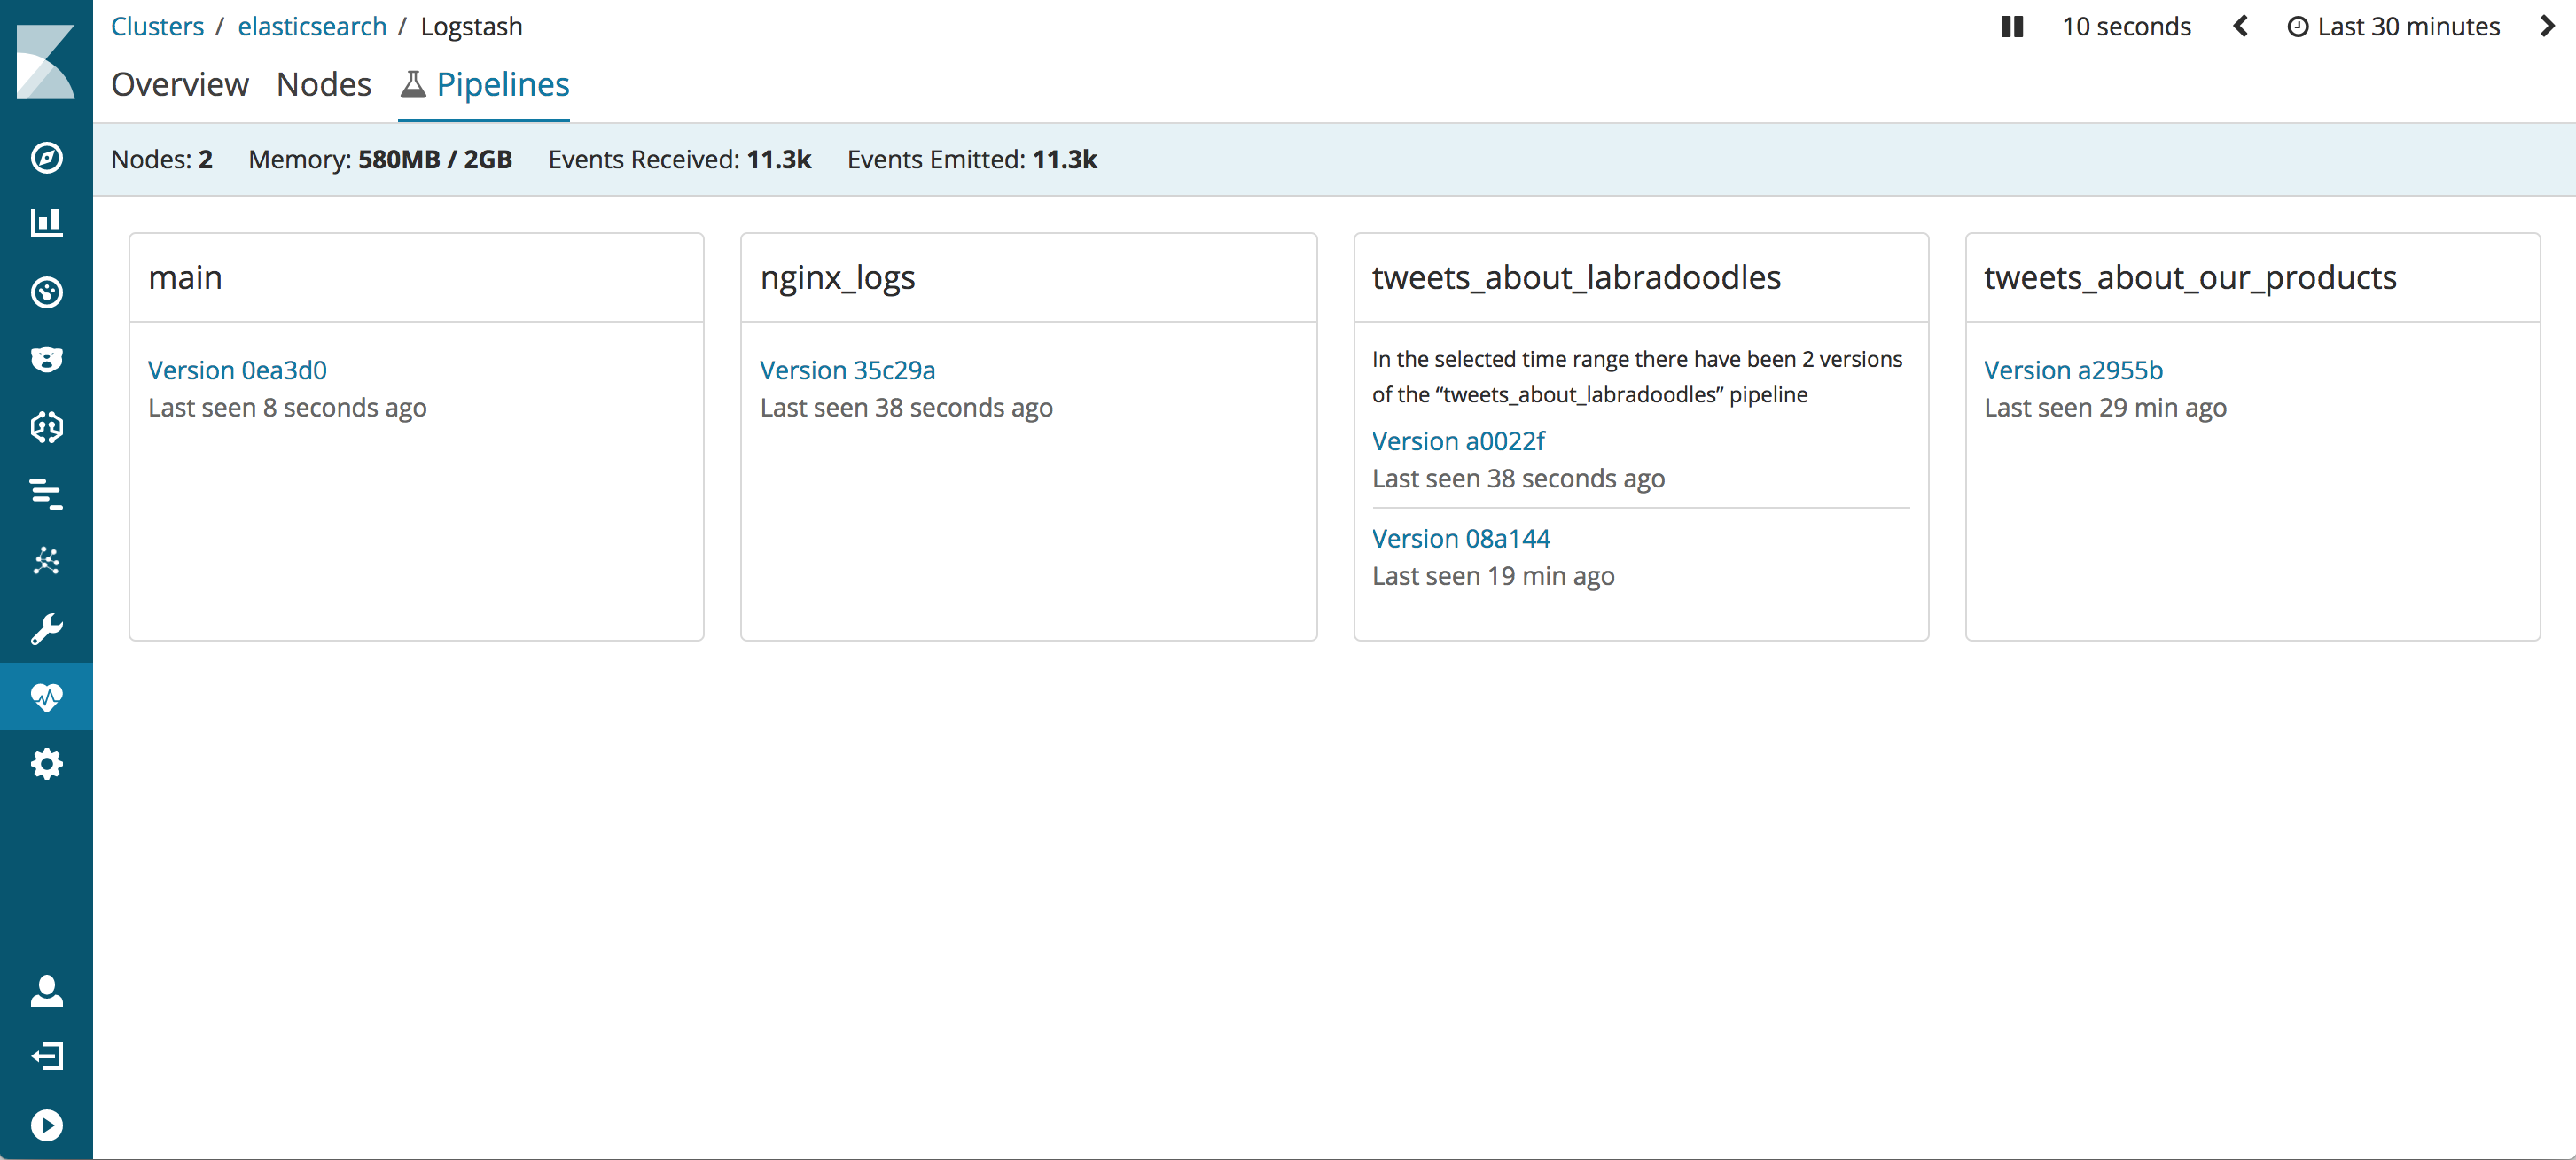
Clicking on a pipeline's version takes you to the Pipeline Viewer, the centerpiece of this blog post. It shows a rendering of that specific version of the pipeline.
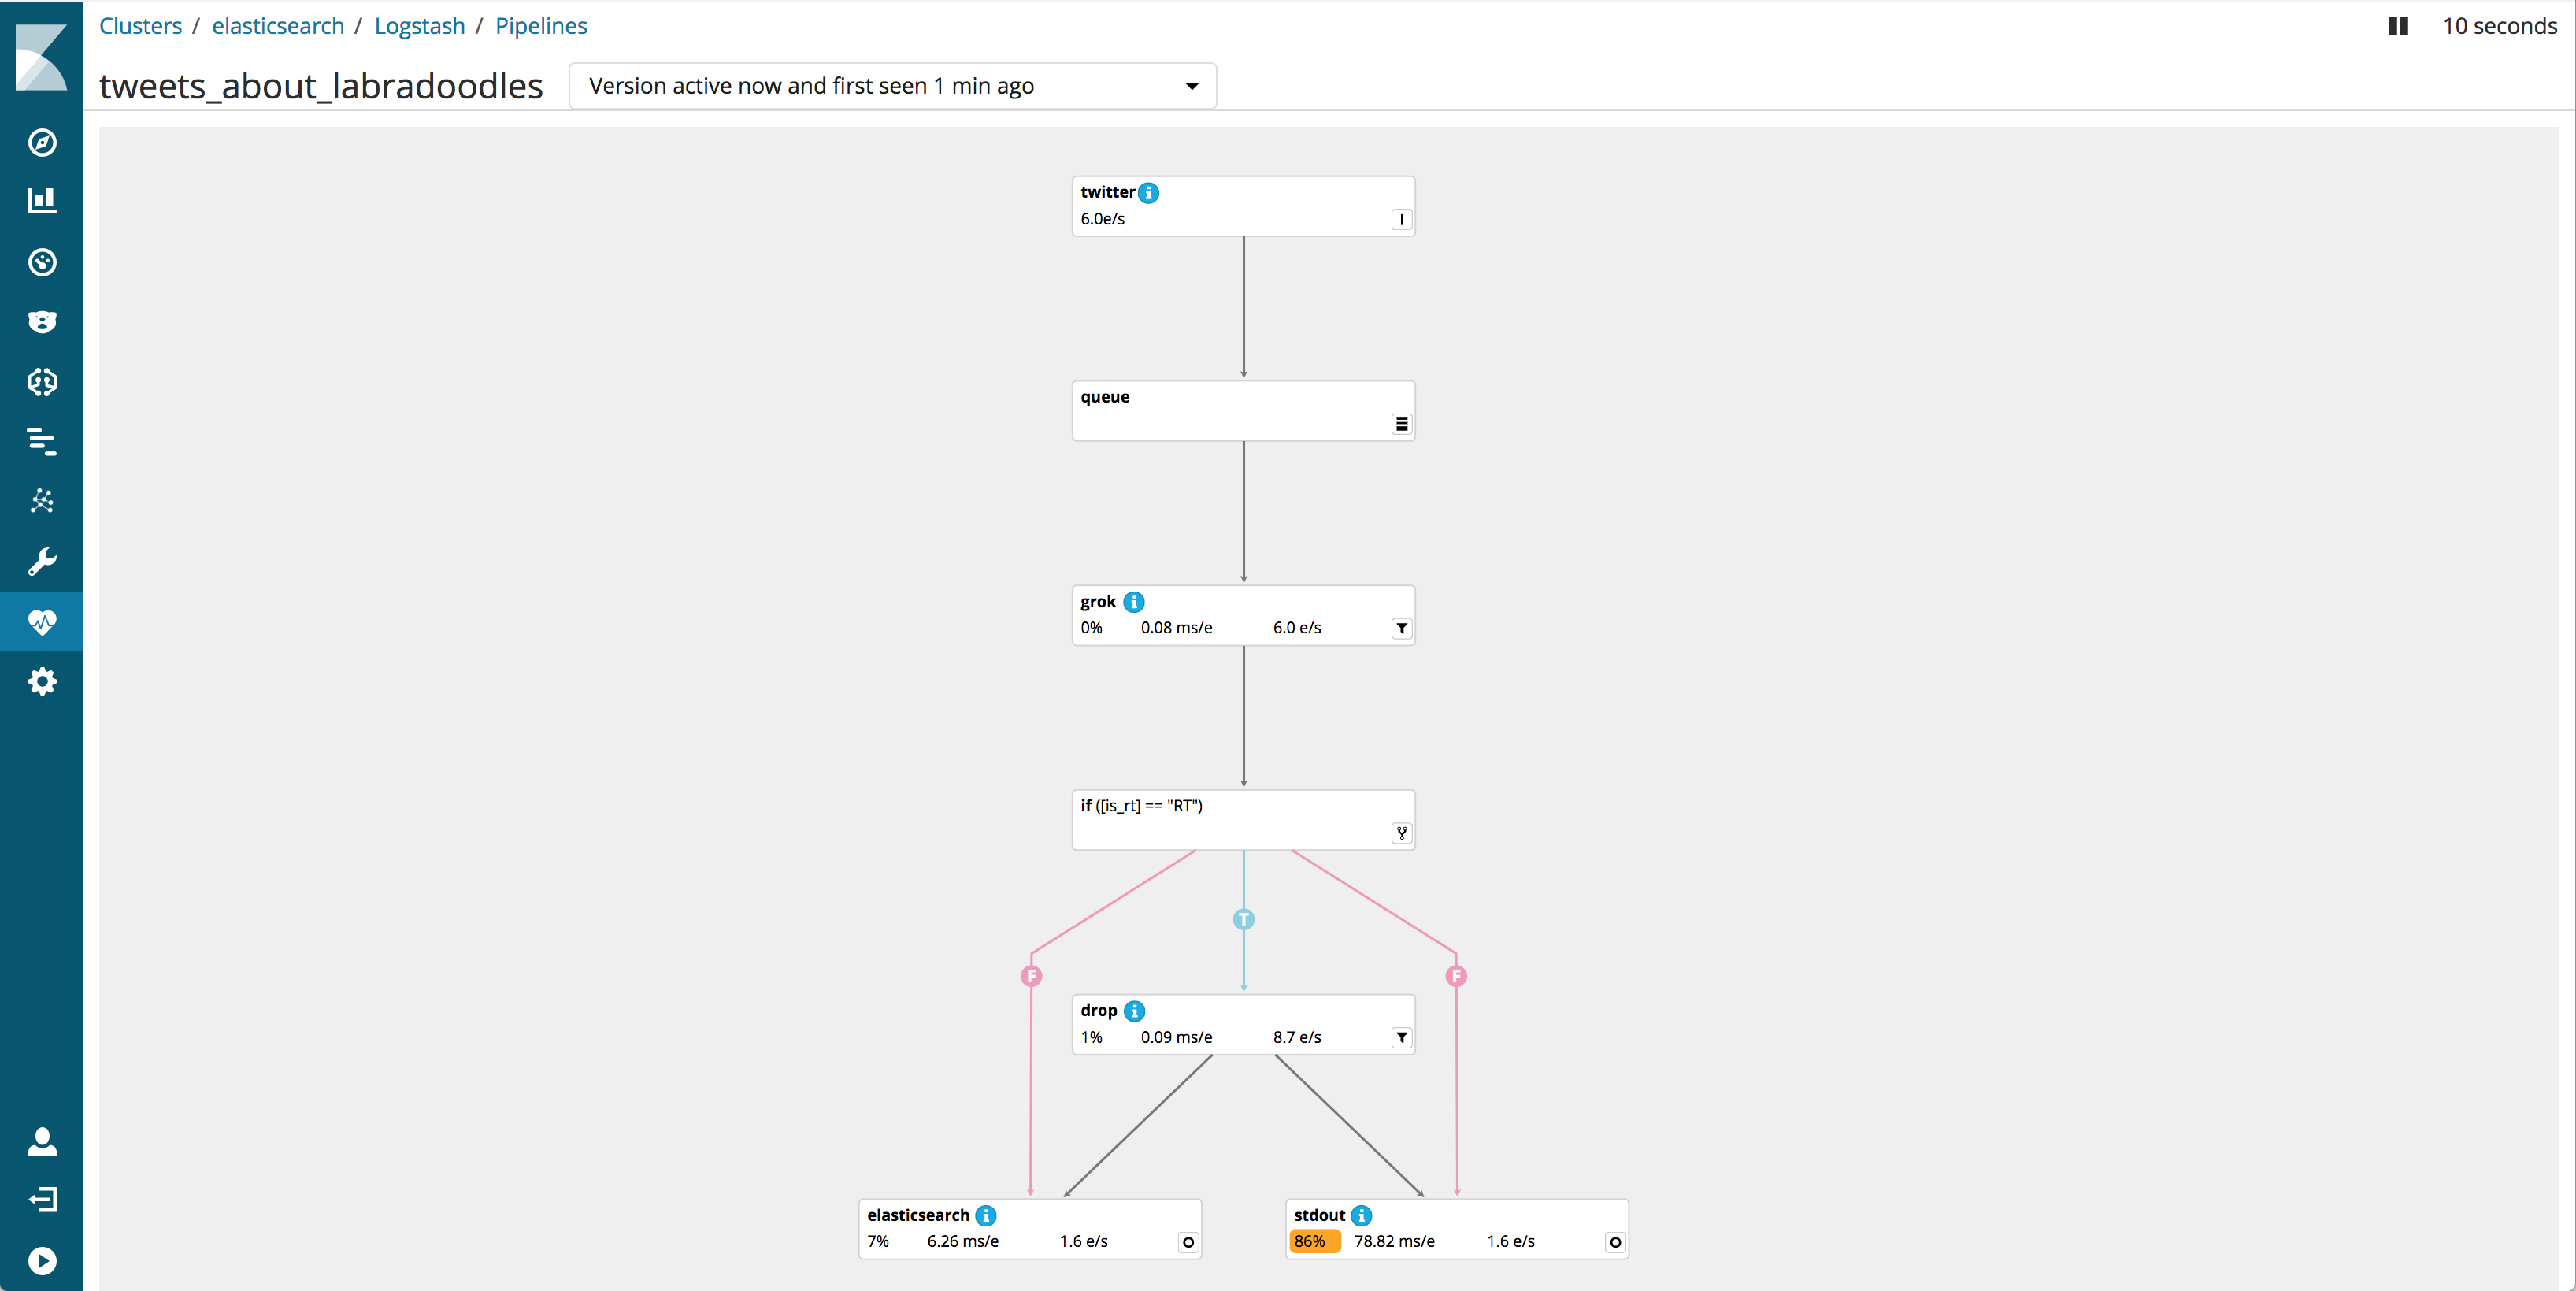
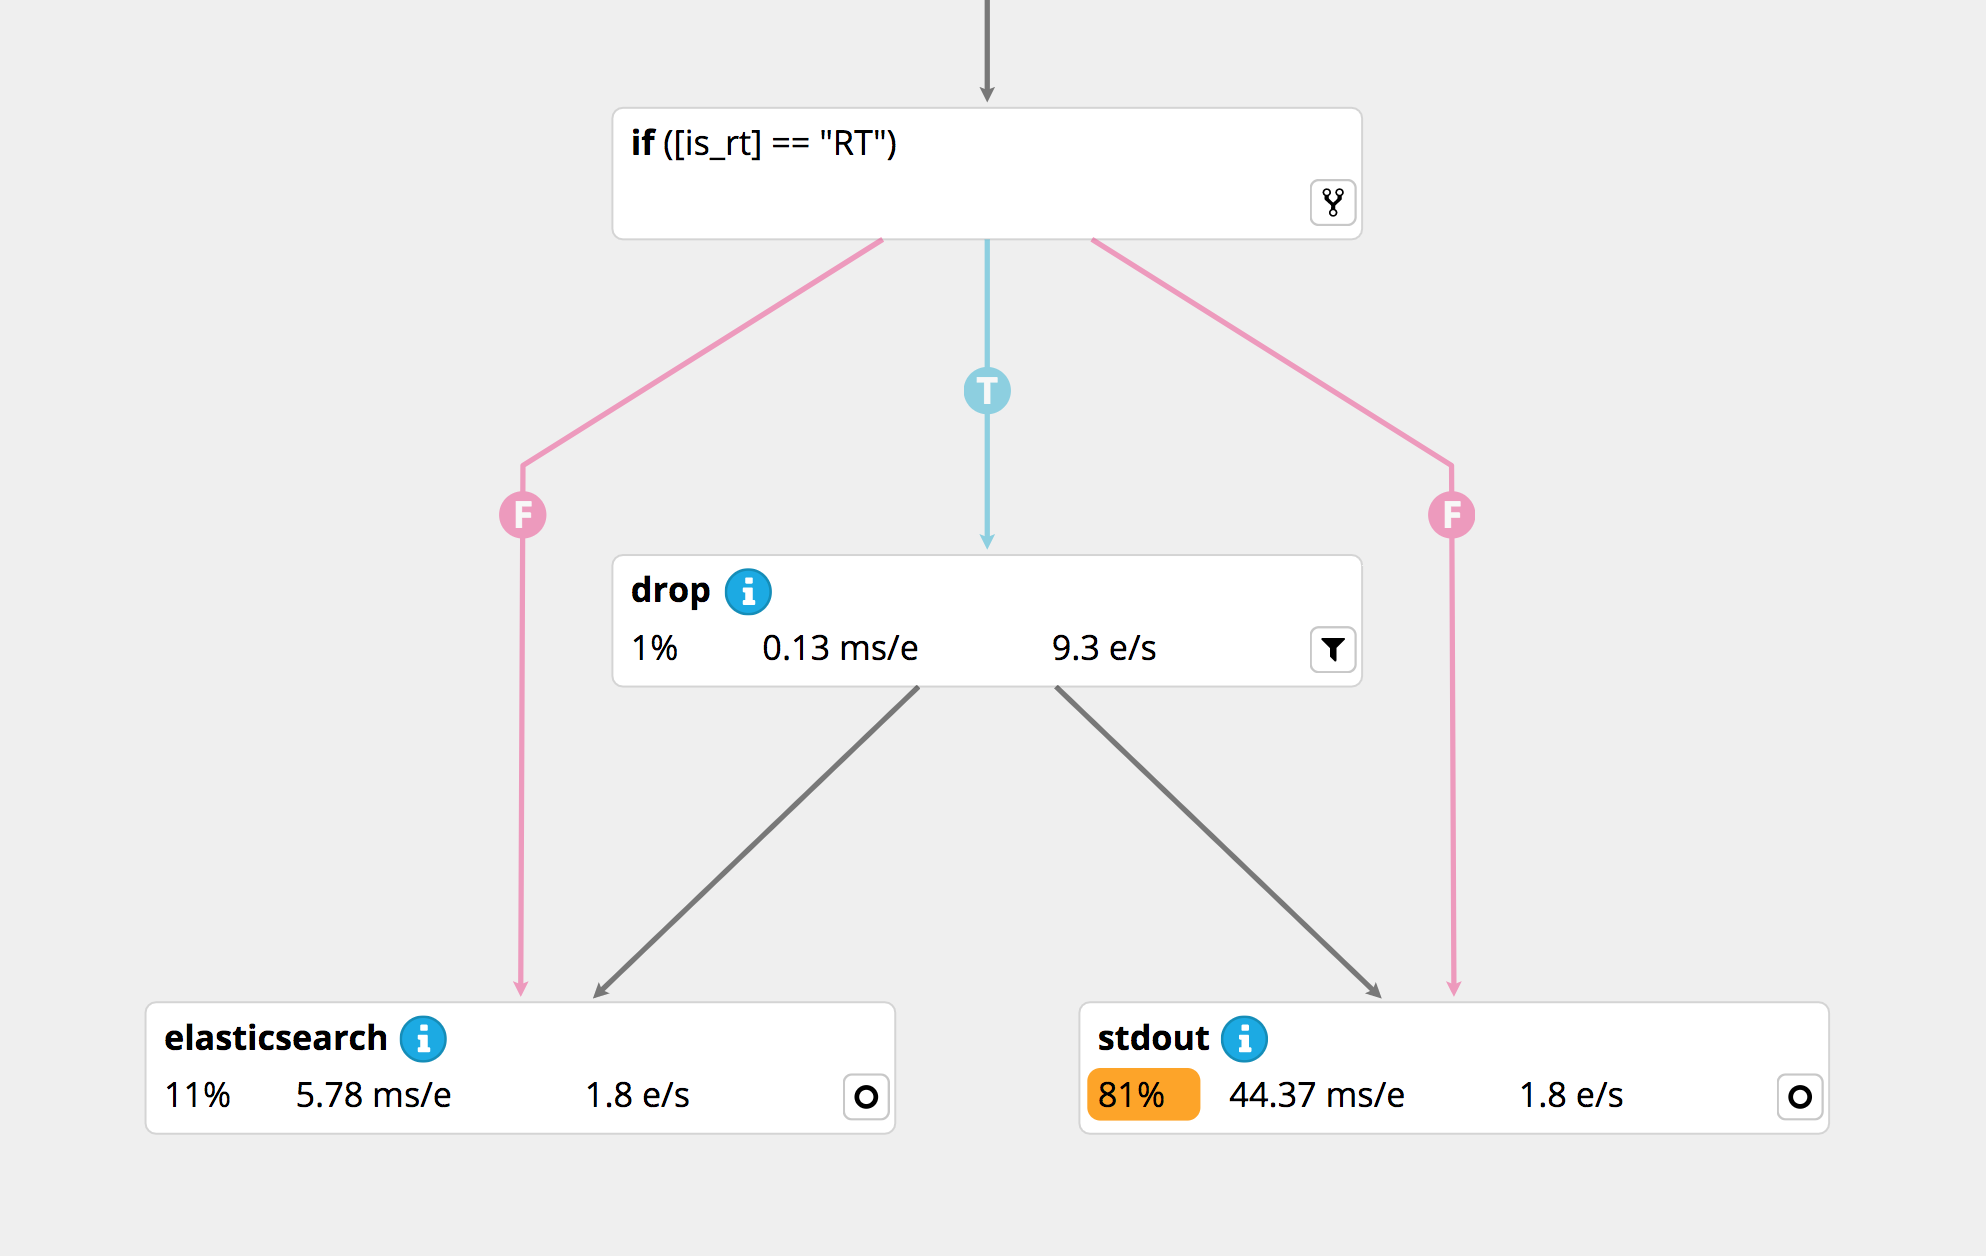
The pipeline is visualized as a directed acyclic graph, with vertices and edges.
Vertices in the graph can represent one of three elements in a Logstash pipeline: plugins, if conditions, or the queue in Logstash that exists between the input and filter stages of a pipeline.
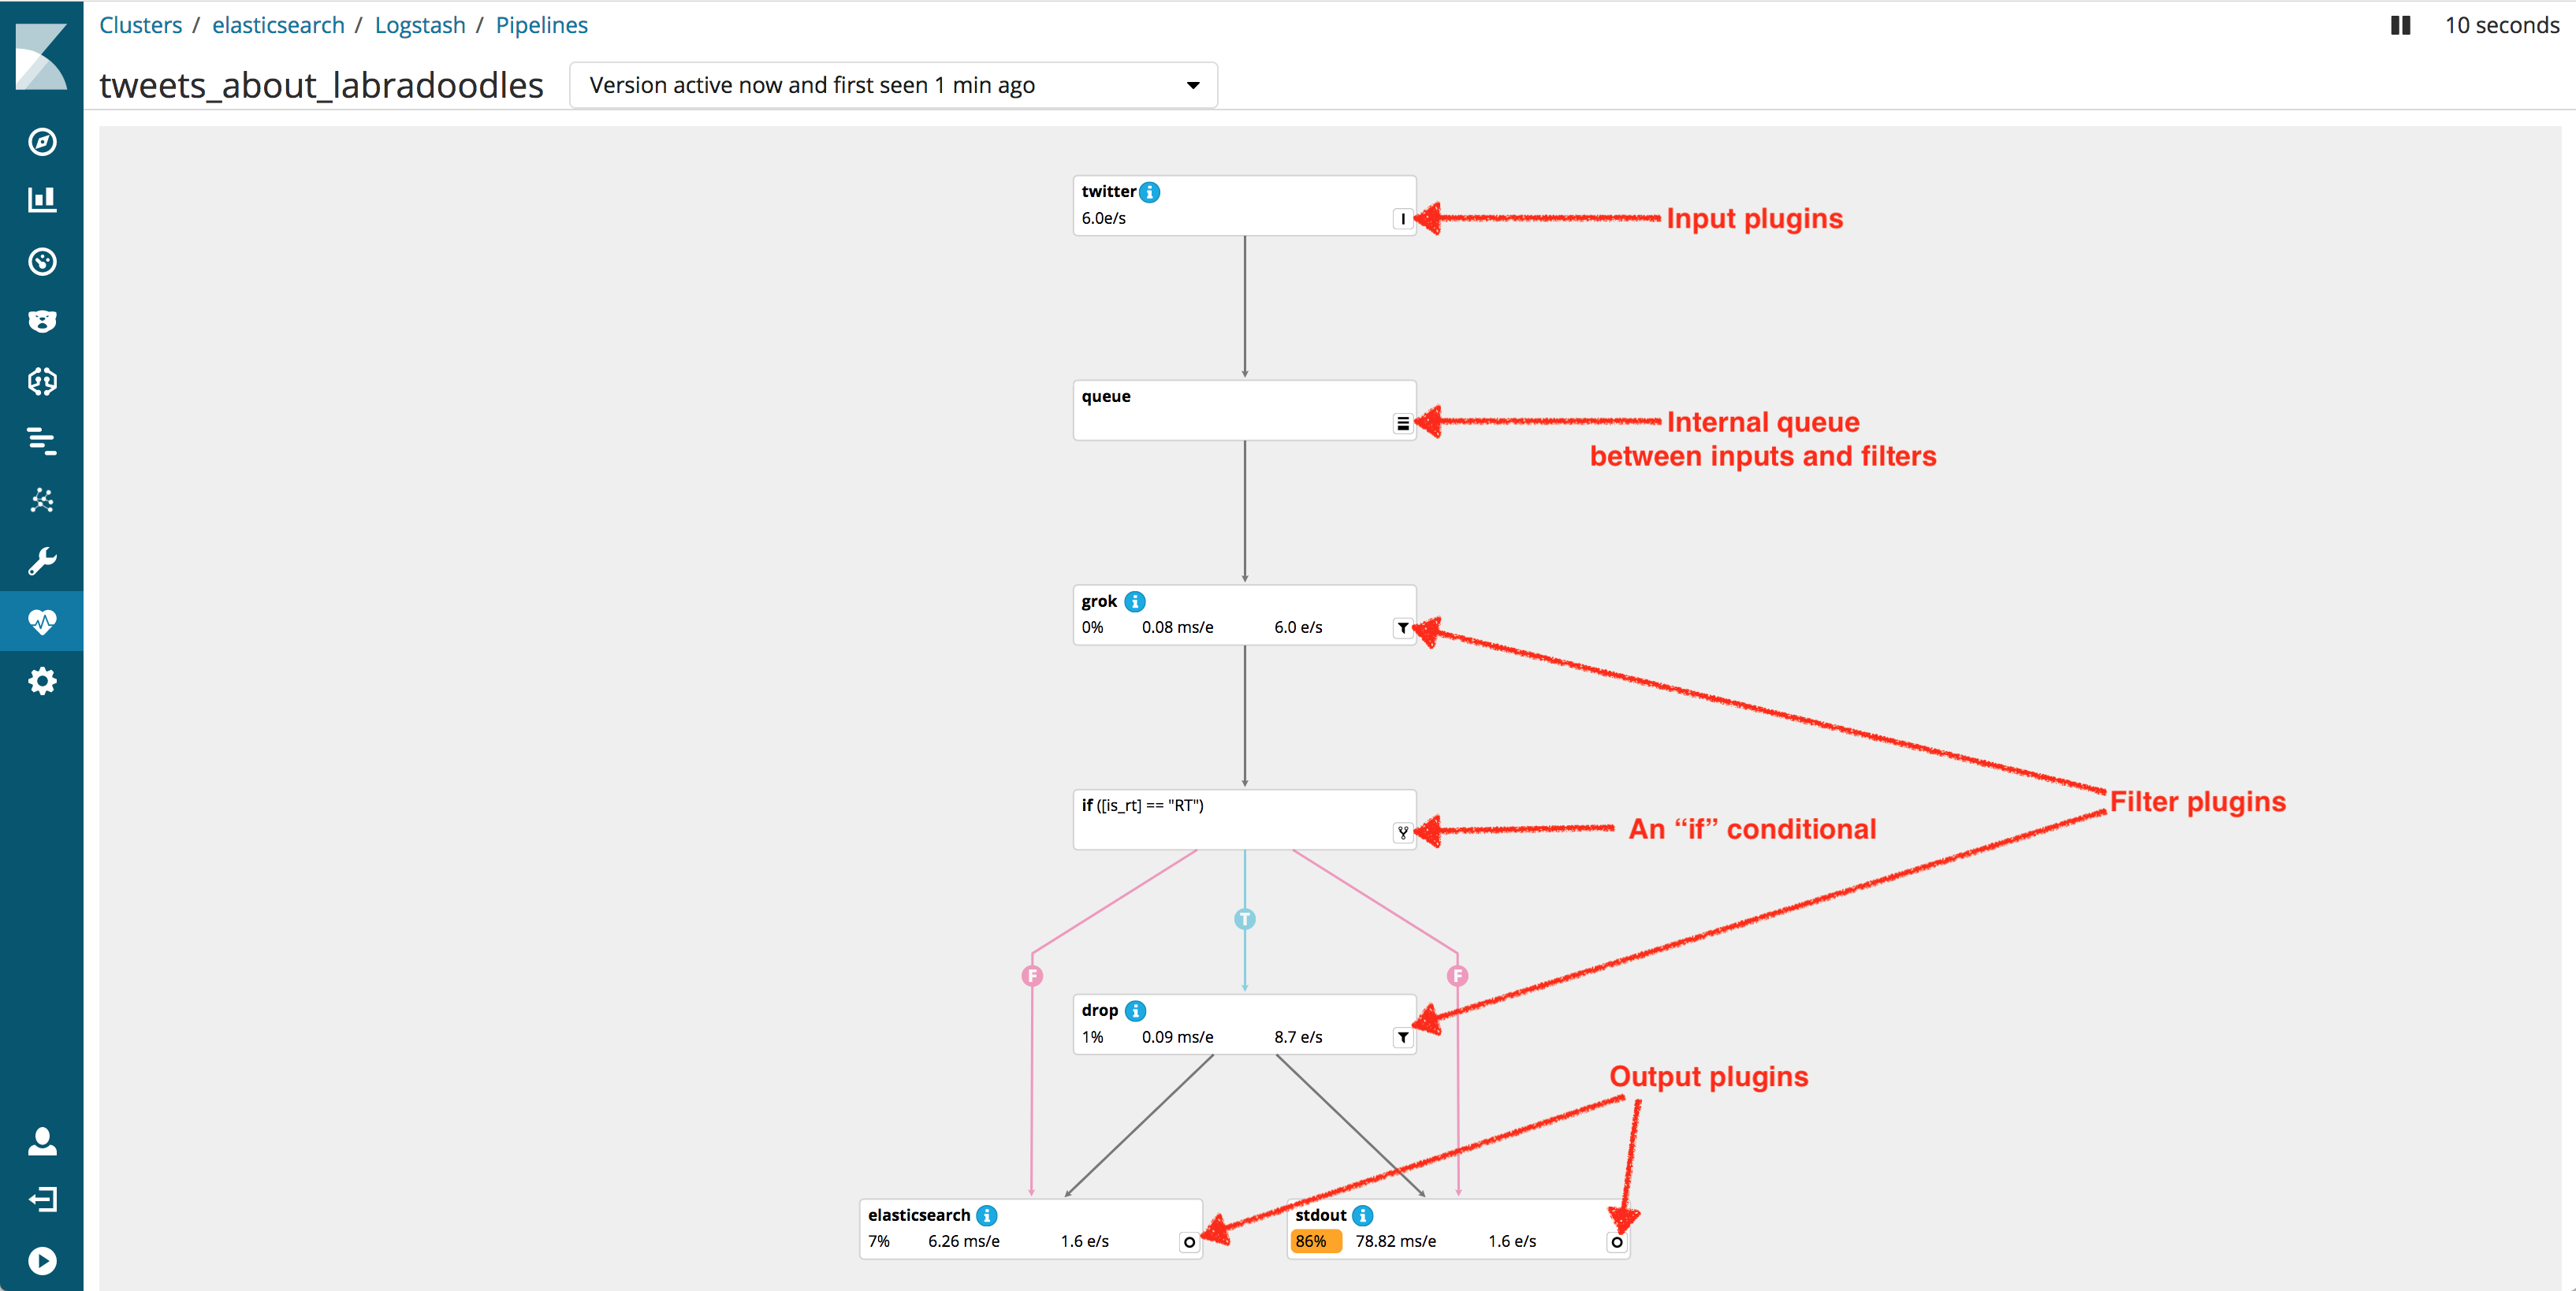
Edges represent paths that events can take as they travel through the pipeline.
Plugin vertices show the ID of the plugin (if one is specified by the pipeline creator via the id property), the plugin's throughput (in events per second), and the latency (in milliseconds) introduced by the plugin as it processes events passing through it.
If condition vertices show the condition being tested. They have two types of edges emanating from them: "true" or "T" edges, representing the path an event would take if the condition is met, and "false" or "F" edges, representing the path an event would take if the condition is not met.
Today we do not show metrics for if condition vertices or the queue vertex but this is something we plan to add in the future.
Applications
Now that you know your way around the Pipeline Viewer, here are some of its practical applications.
As mentioned at the start of this blog post, you can use the Pipeline Viewer to get a bird's eye view of your pipelines. This is especially helpful for more sophisticated pipelines.
From this view you can also zoom in closer and inspect specific plugins. This will help you identify performance bottlenecks so you can work towards alleviating them.
Finally, as the Pipeline Viewer visualizes a specific version of a pipeline at a given time, you can make changes to the pipeline and compare the effects of these changes with the version prior.
Limitations and Future Plans
The Pipeline Viewer uses a force-directed graph layout algorithm to optimally lay out the vertices and edges representing the pipeline. For clarity, the algorithm tries to prevent overlap of vertices and minimize overlap of edges. It tries to solve for these constraints in a reasonable amount of time, a few seconds.
Turns out that such an algorithmic layout problem is a tough one to solve! So the algorithm comes up with a "best effort" solution. What this means for you, the user, is that depending on the complexity of your pipeline, you may see layouts ranging from obvious to downright messy.
We are continually tweaking this algorithm and even considering alternatives to make layouts more readable and therefore useful for users in the future.
In addition to better layouts, you can also expect to see metrics for the queue and if conditions in the future. We also plan to add a detail panel for each vertex. This panel will let you see the vertex's complete configuration as well as charts visualizing the vertex's performance metrics over time.
We hope you are as excited about the Pipeline Viewer as we are. Please play with it (requires an X-Pack Basic license, which is free) and send us your feedback so we can continue to make the right improvements to it. And watch this space for an "under the covers" look at the Pipeline Viewer UI, in which we'll talk about the engineering aspects of how it's built, the challenges we faced building it, and some of the options we've explored over the course of its evolution.