CDL: Visualising the power of data with Canvas and Elasticsearch
CDL is a top UK tech firm, listed in the Financial Times Future 100. Its customer base comprises high volume retail operations, including over 100 major Internet brands, meaning it processes vast amounts of consumer data in milliseconds.
It does this by unlocking the potential of data to help financial services and other industries combat fraud and learn consumer habits. Harnessing CDL's innovative data solutions to drive success and growth, they are able to use data in real time during any type of customer journey.
They rely on CDL's innovative data solutions to drive success and growth, and integral to this is the ability to use data in real time during any type of customer journey. To deliver this, we selected the Elastic Stack to power our high speed data analytics solution, Hummingbird. This ground-breaking data intelligence solution provides insights into consumer habits and helps tackle fraud before it happens. With real-time insights, decision makers need a way to visualise billions of documents in order to improve key performance indicators such as pricing, contact centre management and customer feedback. We had been using Kibana for some time, but we were often asked to present data in a more business-friendly way, whilst keeping the real-time element. Having been following the progress of Canvas, we jumped at the chance to check out its capabilities as soon as it became available in beta.
Setting up KPIs for the Service Management Team
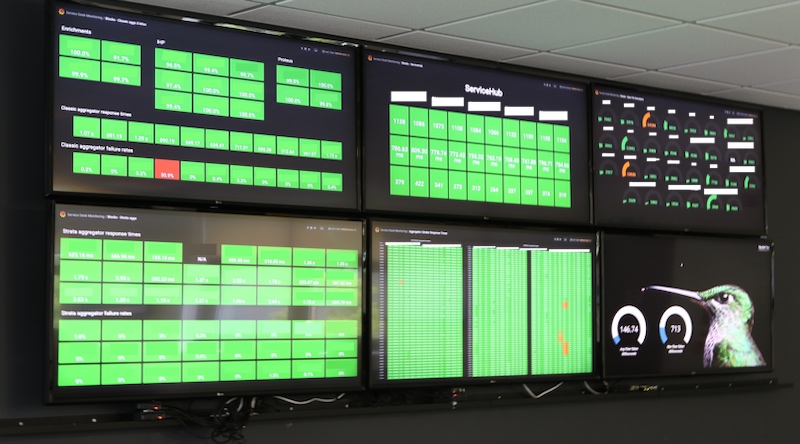
First of all, we looked at our own data in CDL to prove the use case for Canvas. Our Service Management team had previously asked for better visibility of Hummingbird service KPIs. Our Hummingbird DevOps team had a Kibana dashboard (below) and we wanted to shift its focus from purely showing the technical components of the solution to monitoring the business indicators relevant to a management audience.
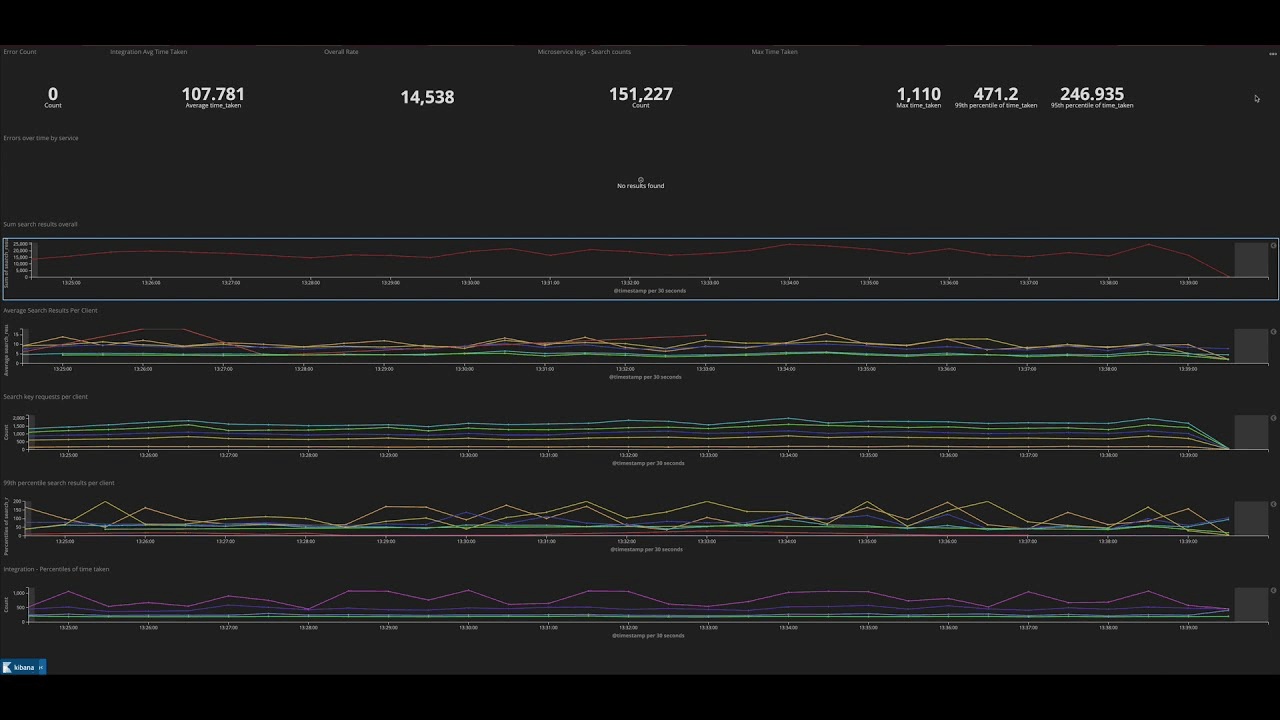
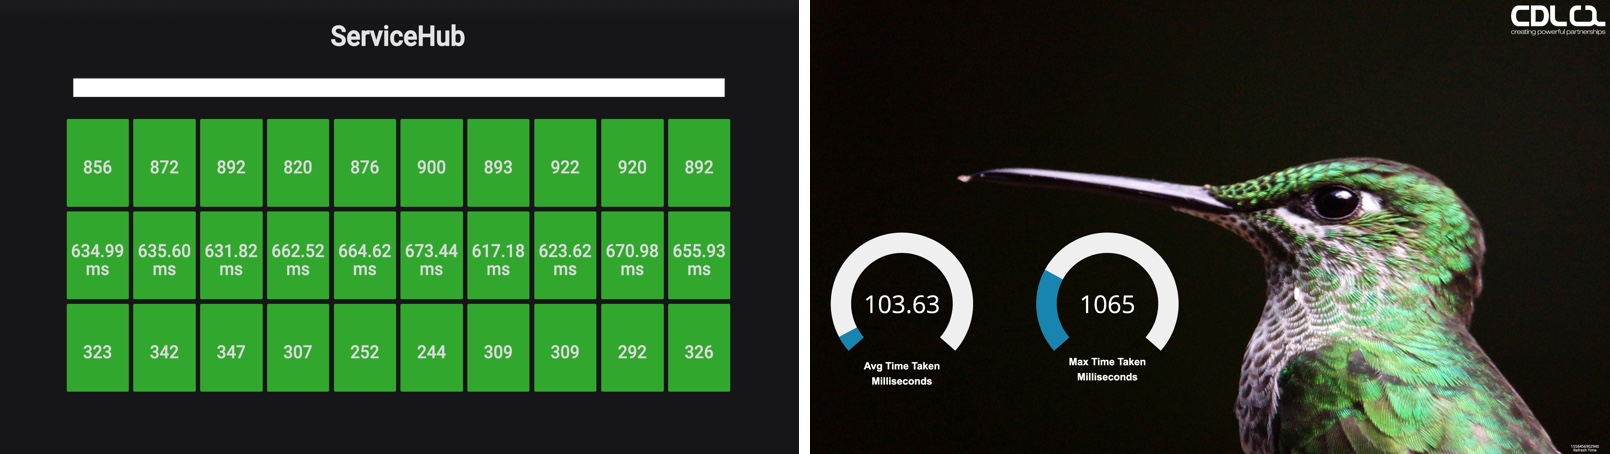
Breaking this down further with the Service Management team, we agreed there were two KPIs: average speed of response and maximum speed of response.
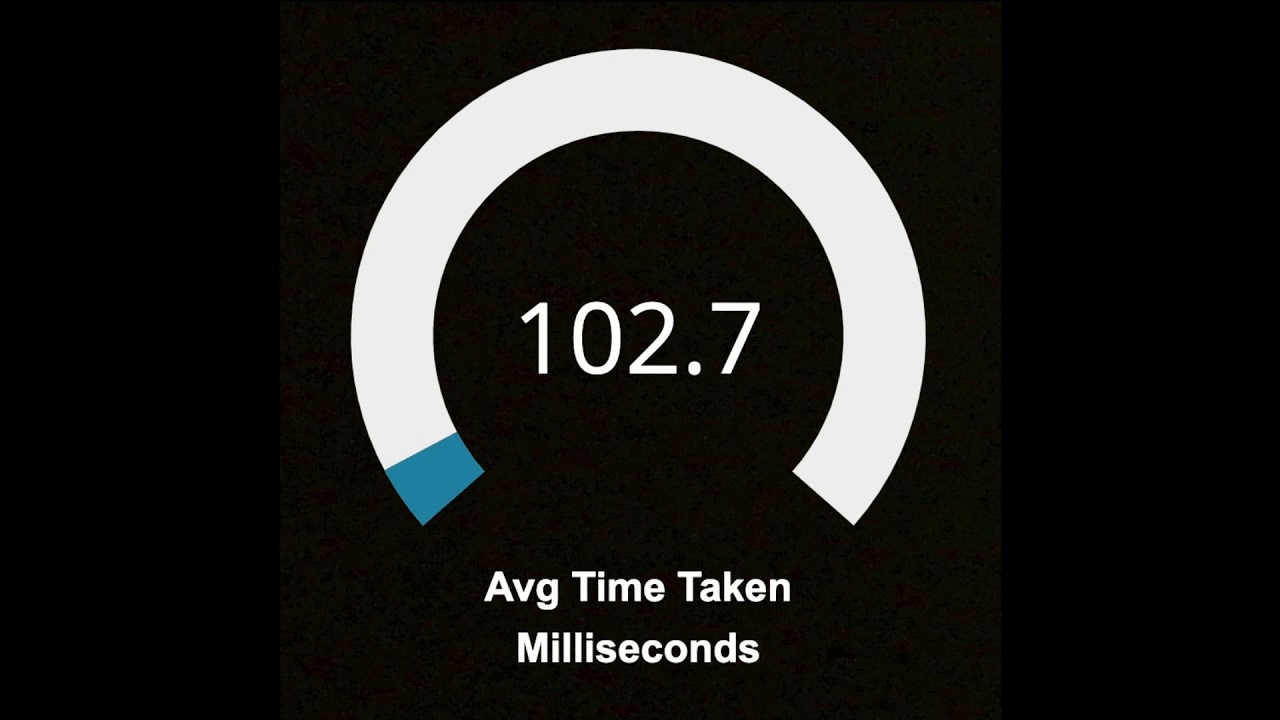
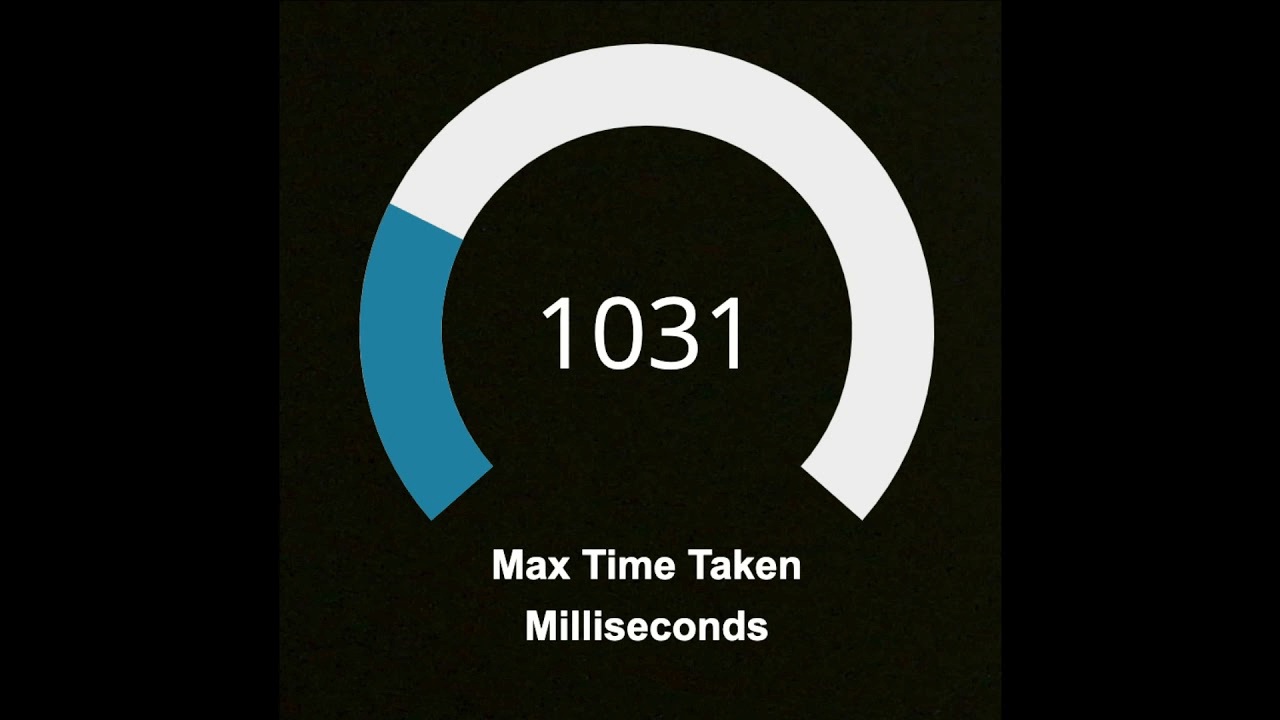
In Canvas we created two gauges for these KPIs.
filters
| esdocs index="microservices-*" fields="time_taken"
query="@timestamp:[now-1m TO now] AND time_taken: >=0 AND log_message:\"returning results to the client\" AND service_name:INTEGRATION"
| math "mean(time_taken)"
| progress shape="gauge" label=true
font={font family="'Open Sans', Helvetica, Arial, sans-serif" size=24 align="center" color="#FFFFFF" weight="normal" underline=false italic=false} max=2000
| render
containerStyle={containerStyle backgroundColor="rgba(255,255,255,0)" padding="0px" opacity="1" border="0px none "}
filters
| esdocs index="microservices-*" fields="time_taken"
query="@timestamp:[now-1m TO now] AND time_taken: >=0 AND log_message:\"returning results to the client\" AND service_name:INTEGRATION"
| math "max(time_taken)"
| progress shape="gauge" label=true
font={font family="'Open Sans', Helvetica, Arial, sans-serif" size=24 align="center" color="#FFFFFF" weight="normal" underline=false italic=false} max=4000
| render containerStyle={containerStyle backgroundColor="rgba(255,255,255,0)"}
Next, we needed to apply our branding and ensure the team knew these metrics were for Hummingbird rather than for other CDL solutions. We uploaded two static images and moved them until we got the right look.
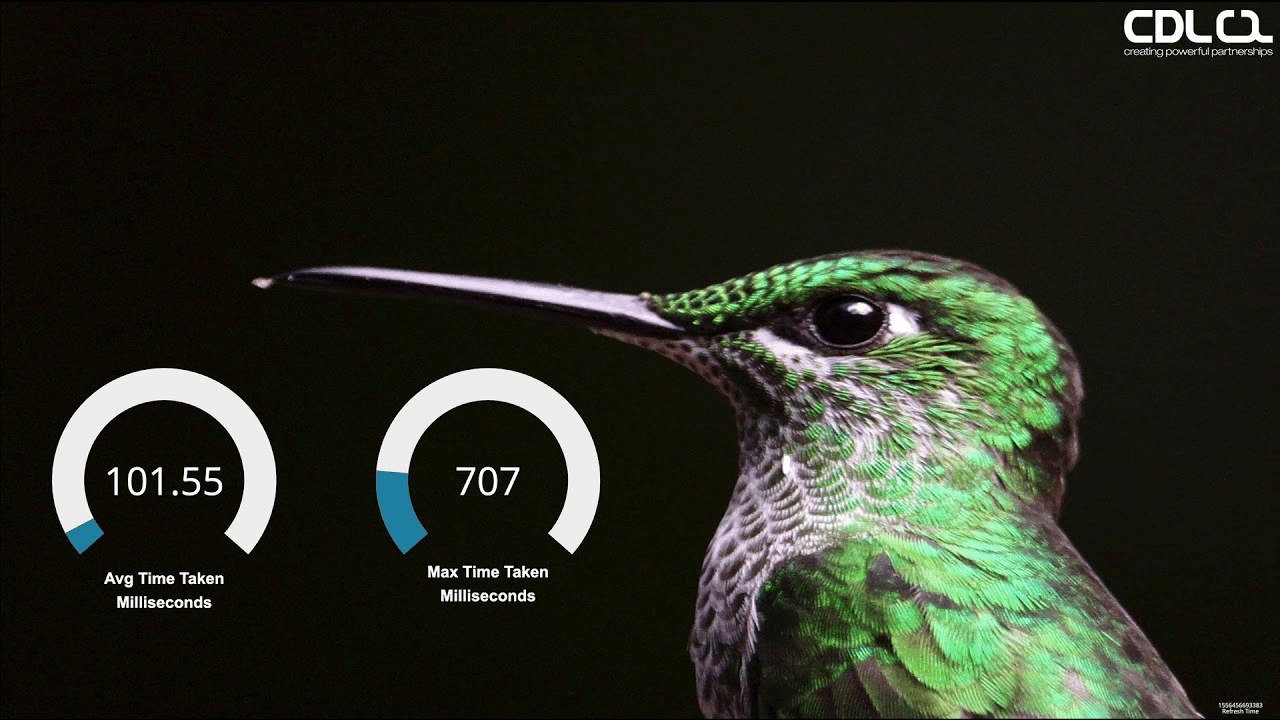
The feedback was instant and very positive. If you compare the existing dashboards with the Canvas version, they look very different and Hummingbird immediately stands out.
Clive Simpson CDL’s Head of Service Management said: “CDL provides business critical systems, and our clients rely on us to facilitate their business transactions. We have service agreements in place, and we are committed to ensuring ‘five nines’ availability (99.999%). The use of the Elastic Stack, in particular Canvas, has provided Service Management with a real time business view of the CDL Hummingbird solution and what it is delivering to clients. It allows us to translate huge amounts of technical metrics into a business context and bring customer experience to the forefront of service delivery
Expanding Canvas, combating insurance fraud
With this quick win, we looked at two other use cases.
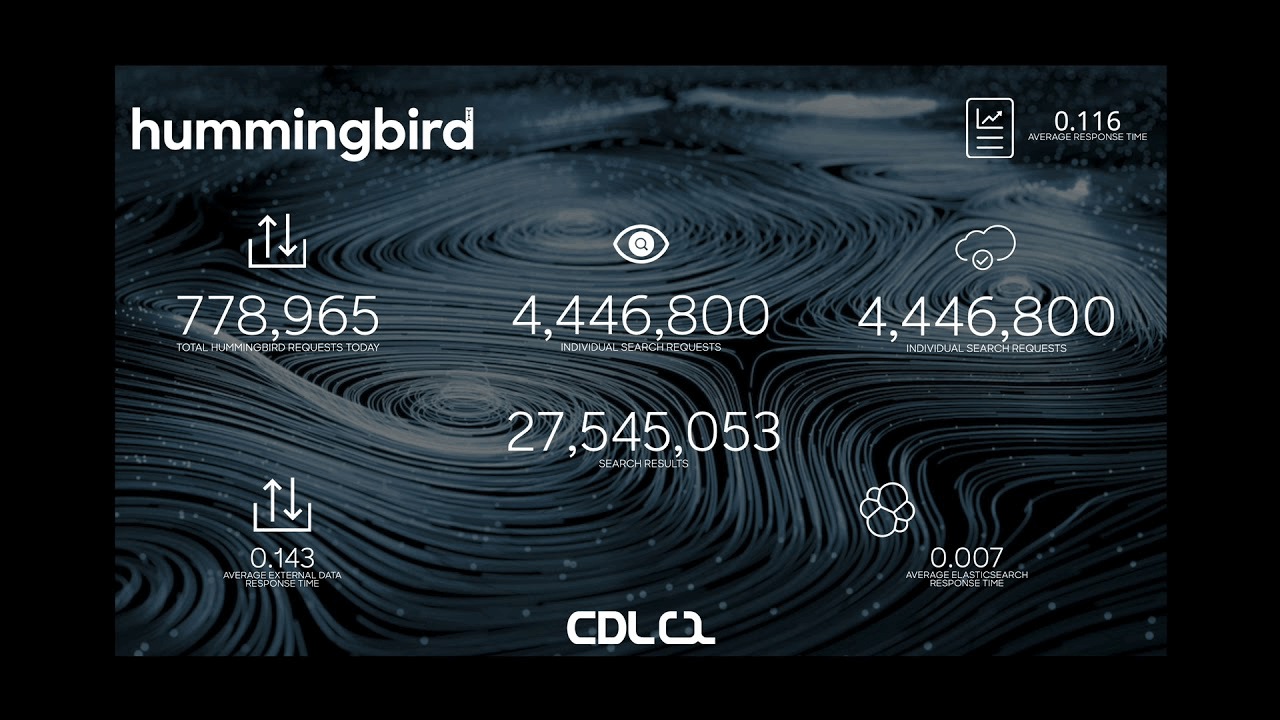
The first was to show the overall journey that transactions were taking through Hummingbird.
The Hummingbird journey goes through a number of microservices. The initial request is a stateful HTTP call. The message is put in a queue and processed by each of the microservices. The microservices perform tasks such as parsing, searching (Elasticsearch), making external API calls to data held by third parties and applying business rules. Our Canvas dashboard needed to show metrics for the current day, i.e., the numbers would increase during the day then reset at 00:00. The dashboard showed the following:
- Number of requests
- Number of searches
- Search results
- Number of documents stored
- Average response time (seconds) for external calls
- Average response time (seconds) for internal calls
We added metric elements for each of the above; an example is shown below.
filters
| escount index="microservices-*"
  query="@timestamp:[now/d TO now] AND service_name:ELASTIC-SEARCH-CLIENT AND log_message:\"Search found results\""
| formatnumber "0,0"
| metric "INDIVIDUAL SEARCH REQUESTS"
  metricFont={font family="'Sharp Sans'" size=96 align="center" color="#FFFFFF" weight="normal" underline=false italic=false}
  labelFont={font family="'Sharp Sans'" size=18 align="center" color="#FFFFFF" weight="normal" underline=false italic=false}
| render
We then added a background image and icons that were relevant to each metric.
By this point, we felt sufficiently confident in our use of Canvas to expand the usage to our customers. One of Hummingbird’s use cases is tackling application misrepresentation or ‘quote manipulation’ which is an increasing problem for the insurance sector. Hummingbird has serviced up to 7 million requests per day in production. Powered by Elastic, we can identify the factors that people are changing in real time. For example, consumers may alter key details such as their annual mileage, no claims bonus, occupation or garaging details between quotations, in an effort to reduce their insurance premiums.
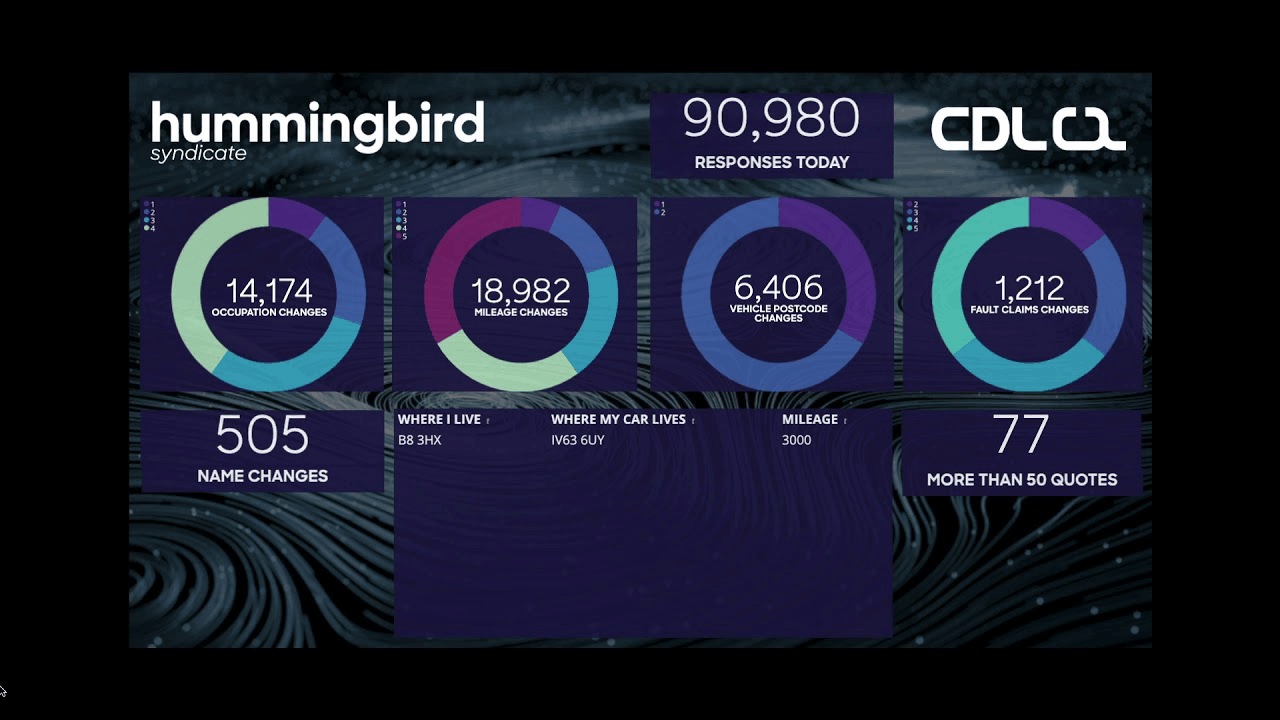
We also engaged our creative team who provided the following design concept for a dashboard.
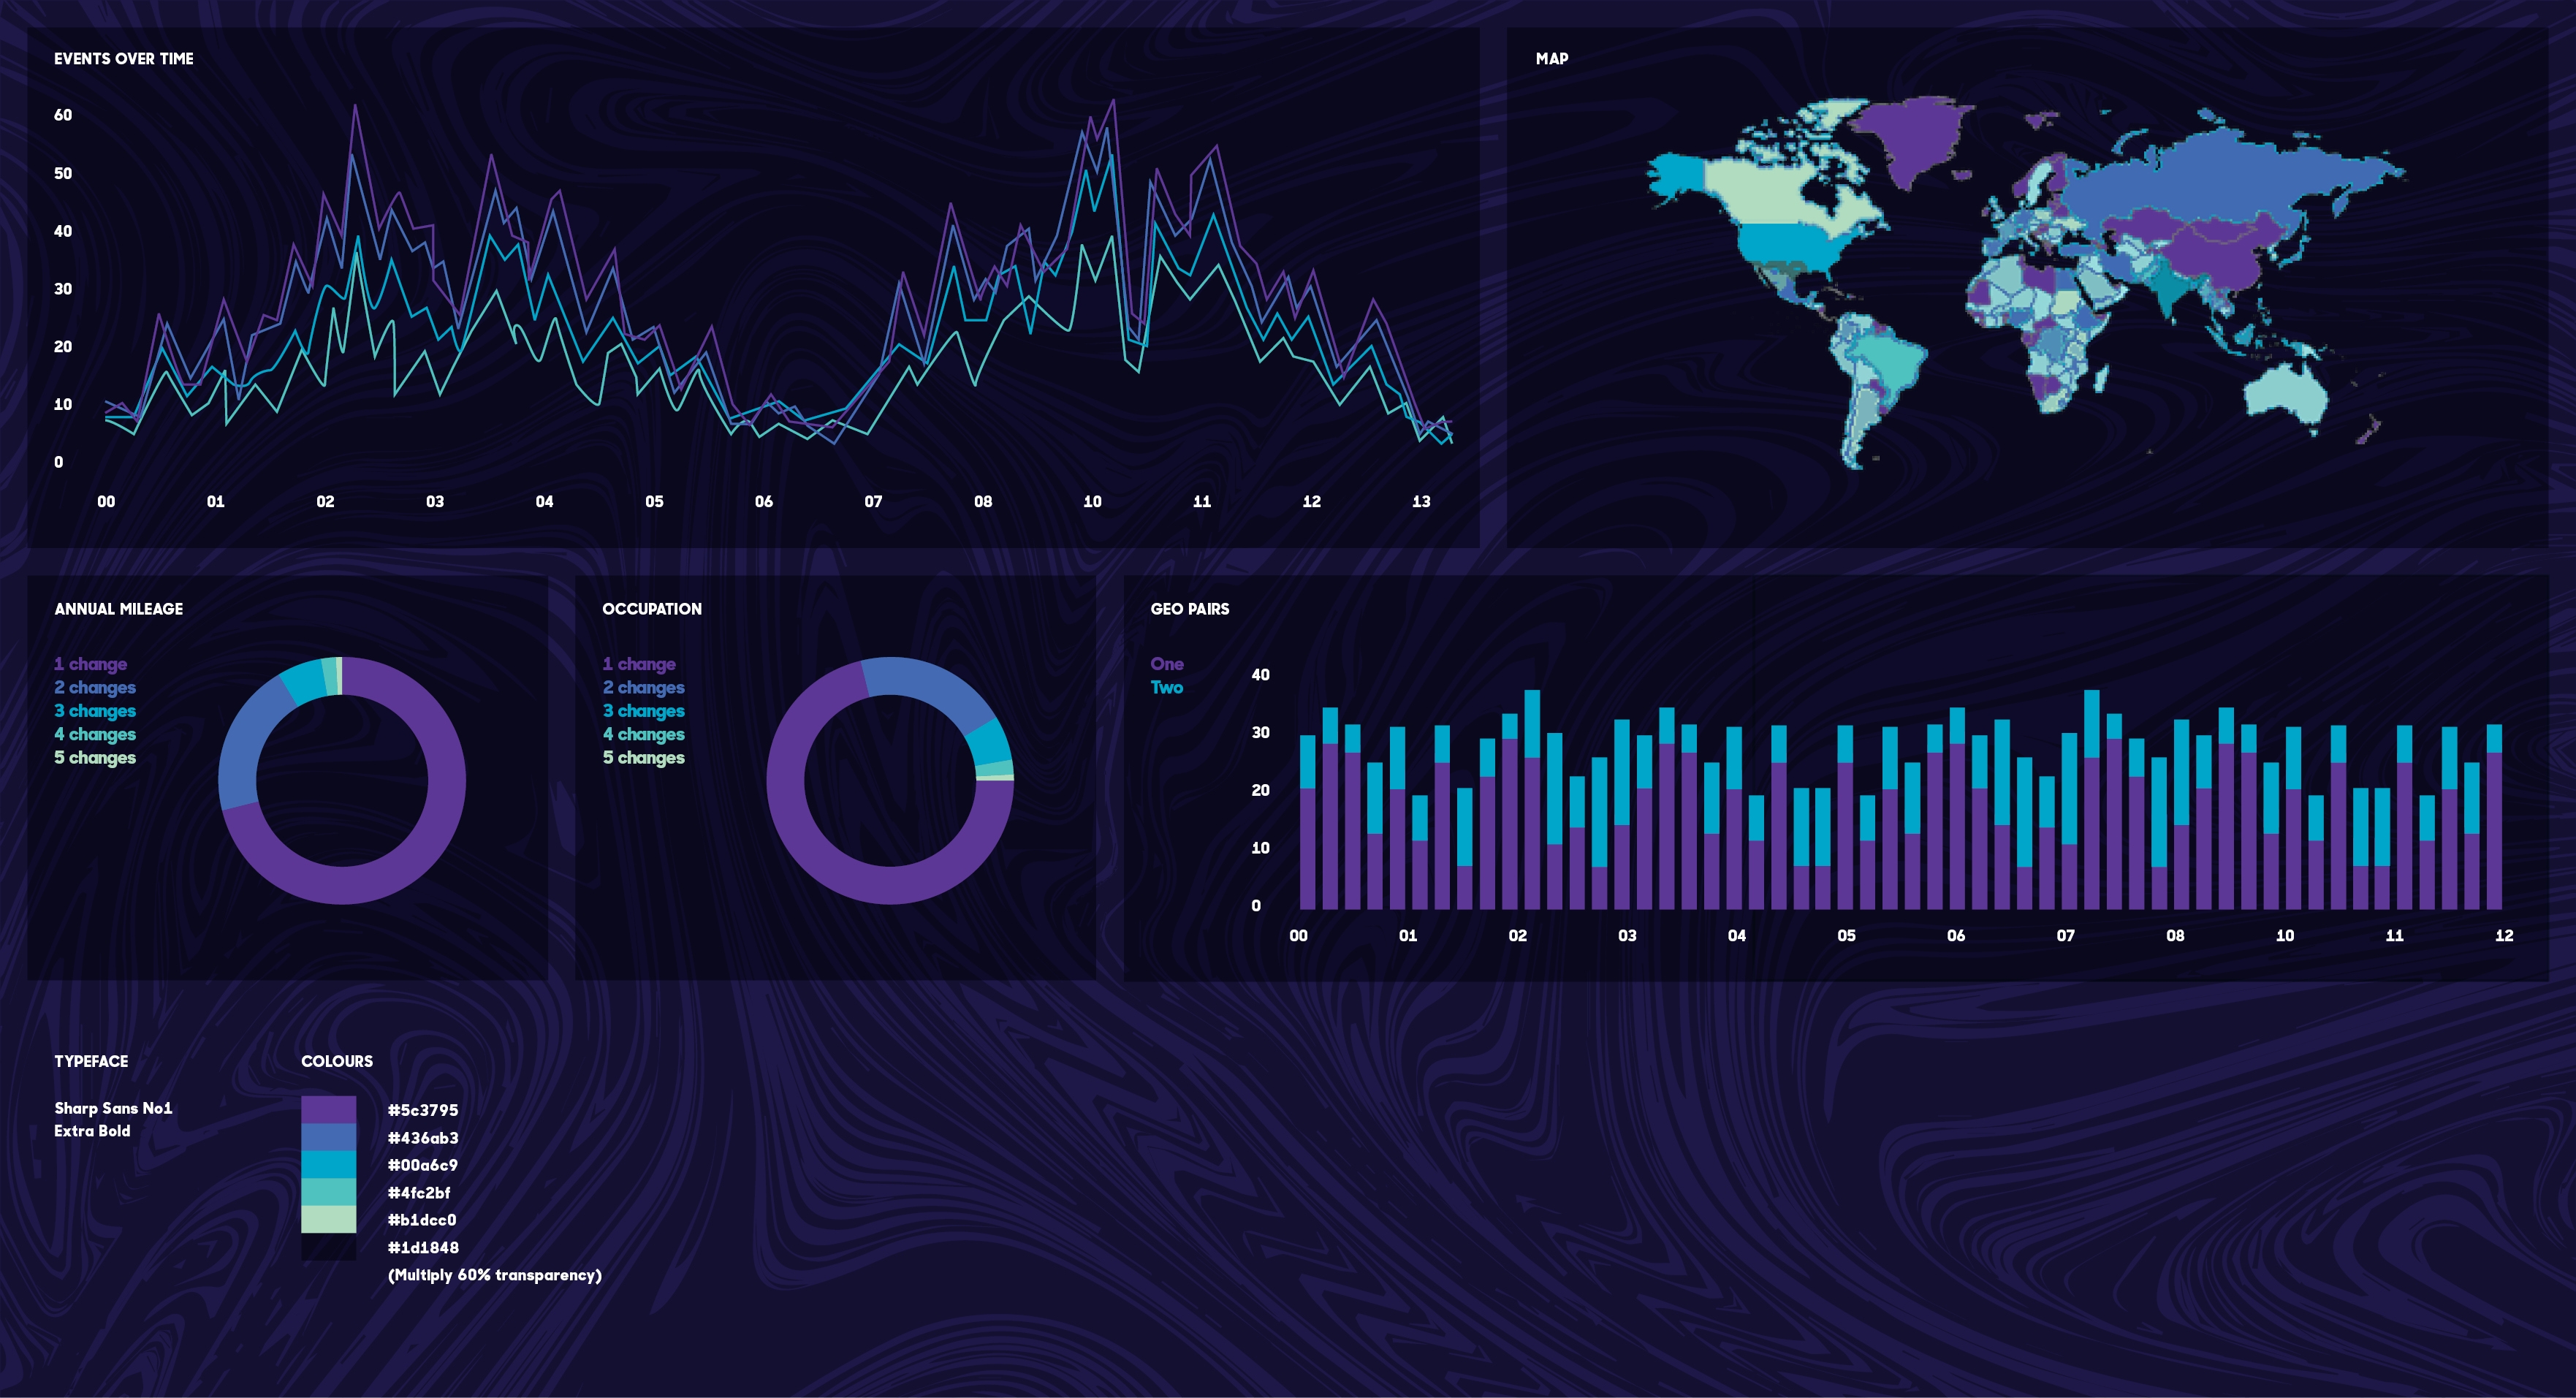
As you can see, design elements such as colour and font were specified to be in keeping with brand image and guidelines.
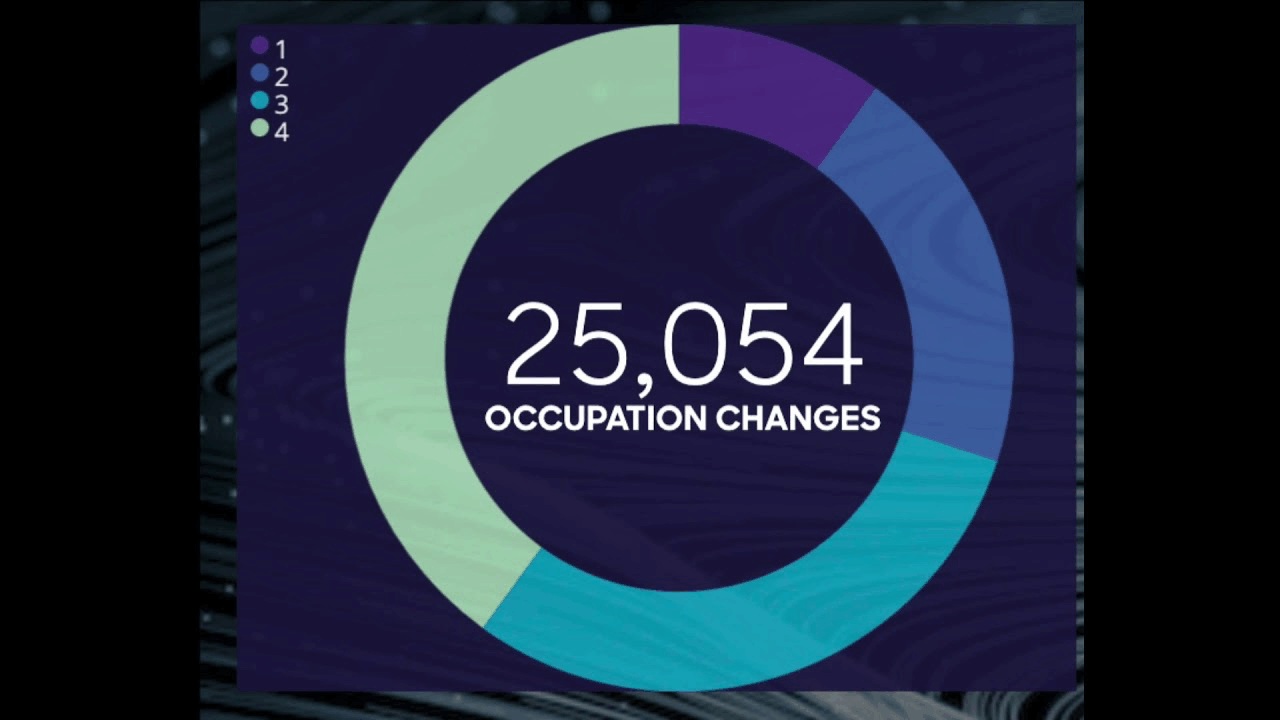
We created pie chart elements for a number of data fields we noted were subject to frequent changes, such as the consumer’s occupation, to monitor the number of different data entries being made.
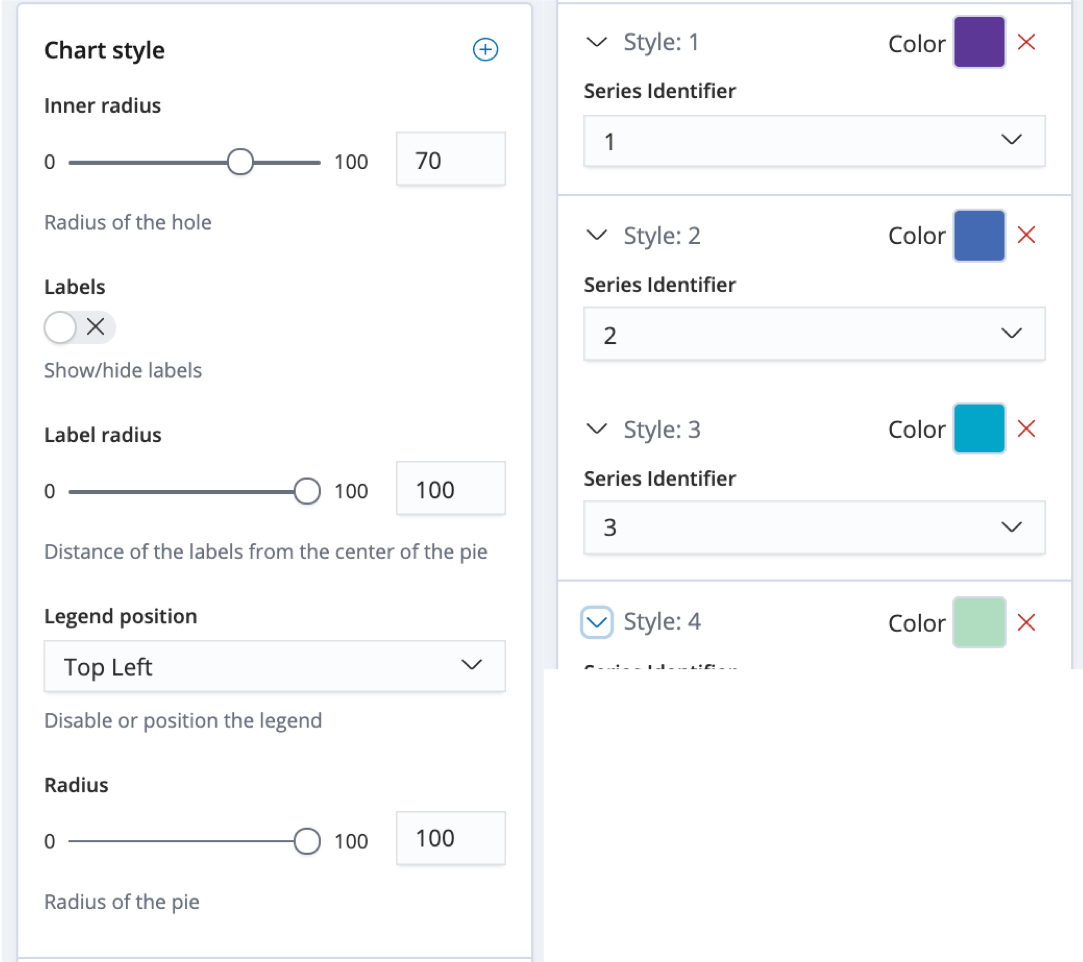
Achieving consistency is important for all brands in how they present themselves. In practical terms this will often mean adhering to branding guidelines. In our case it was important that Canvas provided us with the flexibility to be consistent with:
- The CDL lettering, the graphic CDL symbol and our strapline
- Use of standard fonts
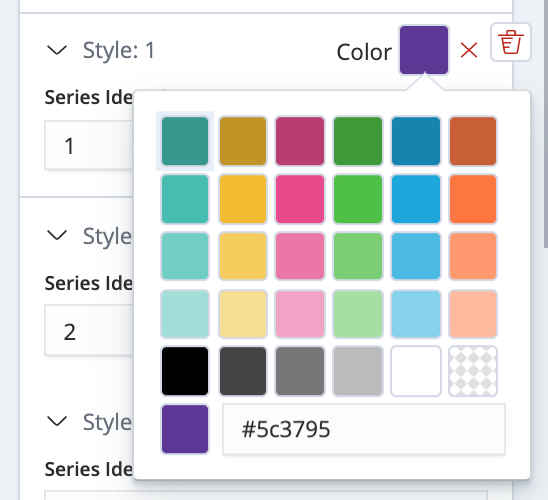
- The use of a consistent colour palette and recognised colour systems such as CMYK or Pantone™
We found most properties to be very customisable. We were able to apply our colour scheme and fonts to the chart, as well as altering its opacity to maintain the visibility of the background image. We also added the CDL logo in white which was appropriate given the dark background with little variation of the colour behind. By achieving this consistency with other customer facing publications we believe that a customer would recognise the dashboard as something we had created even if it did not have the CDL logo on it.
filters
| escount index="responses-*" query="timestamp:[now/d TO now] AND response.fullTimeOccCodeCount:2"
| formatnumber "0,0"
| metric "OCCUPATION CHANGES"
  metricFont={font family="'Sharp Sans" size=60 align="center" color="#FFFFFF" weight="normal" underline=false italic=false}
  labelFont={font family="Sharp Sans" size=18 align="center" color="#FFFFFF" weight="bold" underline=false italic=false}
| render
The finished dashboard looks like this:
Unlocking data and improving customer experience
In conclusion, over a few days, we were able to go from having no hands-on experience with Canvas to having three dashboards up and running. Our initial use case for the technology was proven as we were able to relay business-focused information in a clear, engaging way, whilst retaining the real time capabilities.
Our next steps are to use the technology more widely in CDL and with our customers. For example, we are installing digital signage within our campus and this will be powered by the Elastic Stack and display Canvas dashboards. For customers, we will be including Canvas as an additional module in our data platform so they can continue to unlock the potential of data in visually striking and effective ways.

Technical Consultant at CDL, working on data-driven projects like Hummingbird to personalise and simplify products and transactions for the millennial generation. CDL applies technologies such as machine learning, AI and big data to chat and voice interfaces, transforming the consumer experience to meet the expectations of today's digital consumer.