AMPATH: Providing healthcare in rural Kenya using the Elastic Stack
The Academic Model Providing Access to Healthcare (AMPATH) was founded in 2001 to combat one of the world’s worst epidemics: HIV. AMPATH is a partnership between the Kenyan Ministry of Health, Moi University in Eldoret, Kenya, and a consortium of American universities.
The challenge: Paper charts and paper records
In most parts of the world, reliable patient records are hard to find. Access to patient data in clinics is a critical part of healthcare. However, paper records are hard to read, get lost or damaged, and are inefficient to store and retrieve. Imagine having to pull hundreds of charts daily from this stack of records:

Another problem with paper records is that they make reporting difficult. Separate books, called registers, are used to track patient data for aggregate government reporting. Sometimes several registers must be filled out to collect the information from a single visit.
A register is essentially a spreadsheet. Rows and columns track patient metrics. The results from each page are tallied and transferred to other registers. This is a slow, error-prone, time-consuming, unreliable process that leads to delayed reports.

Making the move to digital
To manage the huge volumes of charts and develop better reports on patient care, AMPATH helped develop an open-source electronic medical record called OpenMRS. Launched in 2006, OpenMRS is currently used in over 60 countries around the world.
By 2015, widespread affordable cellular networks and affordably priced tablets allowed AMPATH to deploy an implementation of OpenMRS designed to run on tablets, called the AMPATH Medical Record System (AMRS), which was designed for use during clinical appointments.
Moving to the Elastic Stack
Every day hundreds of providers across Western Kenya use AMRS. This results in a huge amount of data that needs to be managed and made available to key decision makers such as clinicians, clinic administrators, and the Ministry of Health.
Initially, AMPATH wrote custom code for each new visualization and each new dashboard. The trouble is this took a lot of developer time, the visualizations created were slow to load, and they were hard to debug.
Stakeholders often requested new data visualizations, and it was hard to keep up with the demand using custom code. There was also interest in finding a tool to allow everyone to design their own visualizations, which would help them to better leverage their data and would free up developers’ time.
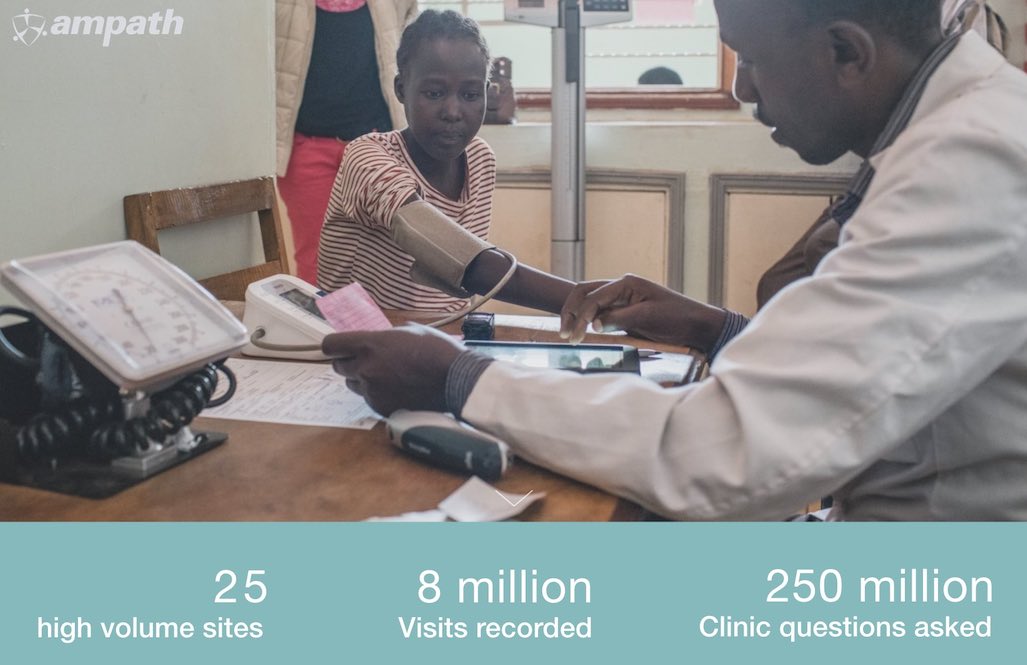
AMPATH required a solution that could handle a lot of data. The database has almost 8 million visit encounters, with 250 million clinical questions asked.
The Elastic Stack stood out as the right tool. It can handle large data sets and has an easy-to-use interface, a wide feature set, a great community with good documentation, and pricing aligned with AMPATH’s needs.
AMPATH’s ETL process
In 2017 AMPATH started development on an extract, transform, load (ETL) process to move data from the electronic medical record MySQL database, through Logstash, into Elasticsearch. Kibana is then used to generate dashboards.
Let's look at the process in the real world.
Data collection
Clinicians use AMPATH’s application on their tablet’s web browser during the clinical visit. The application is built in Angular and stores data in a MySQL database exposed via a REST API in OpenMRS.
Data storage and ETL
To make reporting easier, the relational tables are flattened using the ETL process. SQL scripts extract the desired data by performing joins on several tables. The data is then transformed into a form that answers the questions asked (e.g., is this patient currently on antiretroviral drugs?). A SQL scripts then loads the transformed data into a MySQL table. This is now a flattened table.
Each flattened table represents a report. These reports are distributed to different decision makers and users.
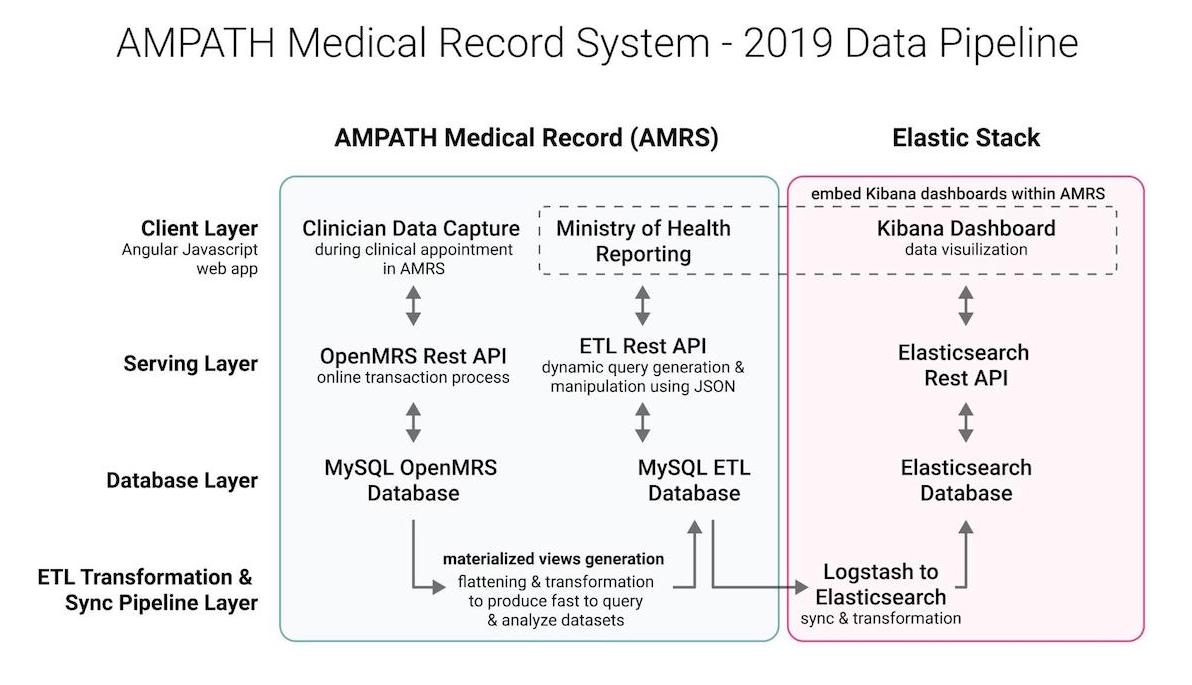
Ingestion into Elasticsearch
After the flattened data is stored in MySQL tables, it is ready to be consumed by Elasticsearch. This is done with Logstash. One of the benefits of Logstash is its ability to consume data from a variety of data sources.
Logstash consumes the MySQL data and pumps it into Elasticsearch in real time using the JDBC input plugin. This plugin supports scheduling and selective data as input by using SQL queries. Each row in the MySQL table is considered a single event, and the columns in each row (event) are considered fields in the event.
AMPATH’s Elastic Stack is set up on a separate server from MySQL using Docker. AMPATH’s Logstash config file is used to query the MySQL tables. Check out this blog post for more details on AMPATH’s Logstash process.
Kibana visualizations
AMPATH started building Kibana visualizations in 2018 with a dedicated team, expanding the visualization component library, building new dashboards, and training new users on how to use Kibana.
These visualizations will be used by clinicians, clinic administrators, and key decision makers in AMPATH and the Ministry of Health.
Below are some examples of system monitoring Kibana dashboards currently in use.
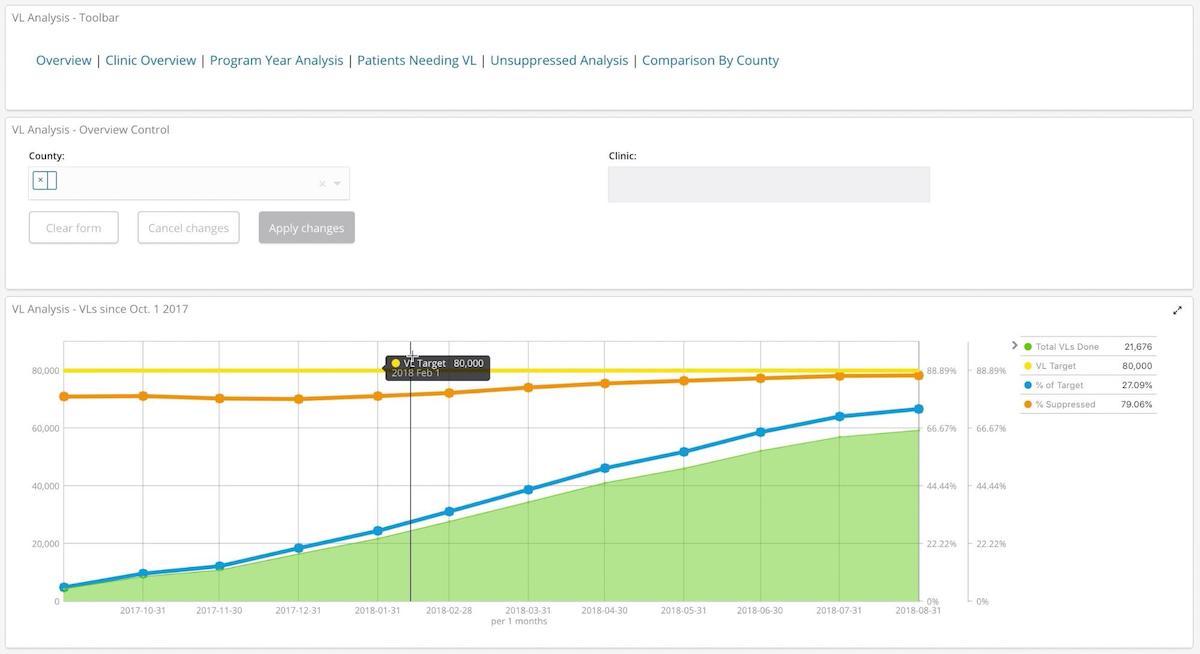
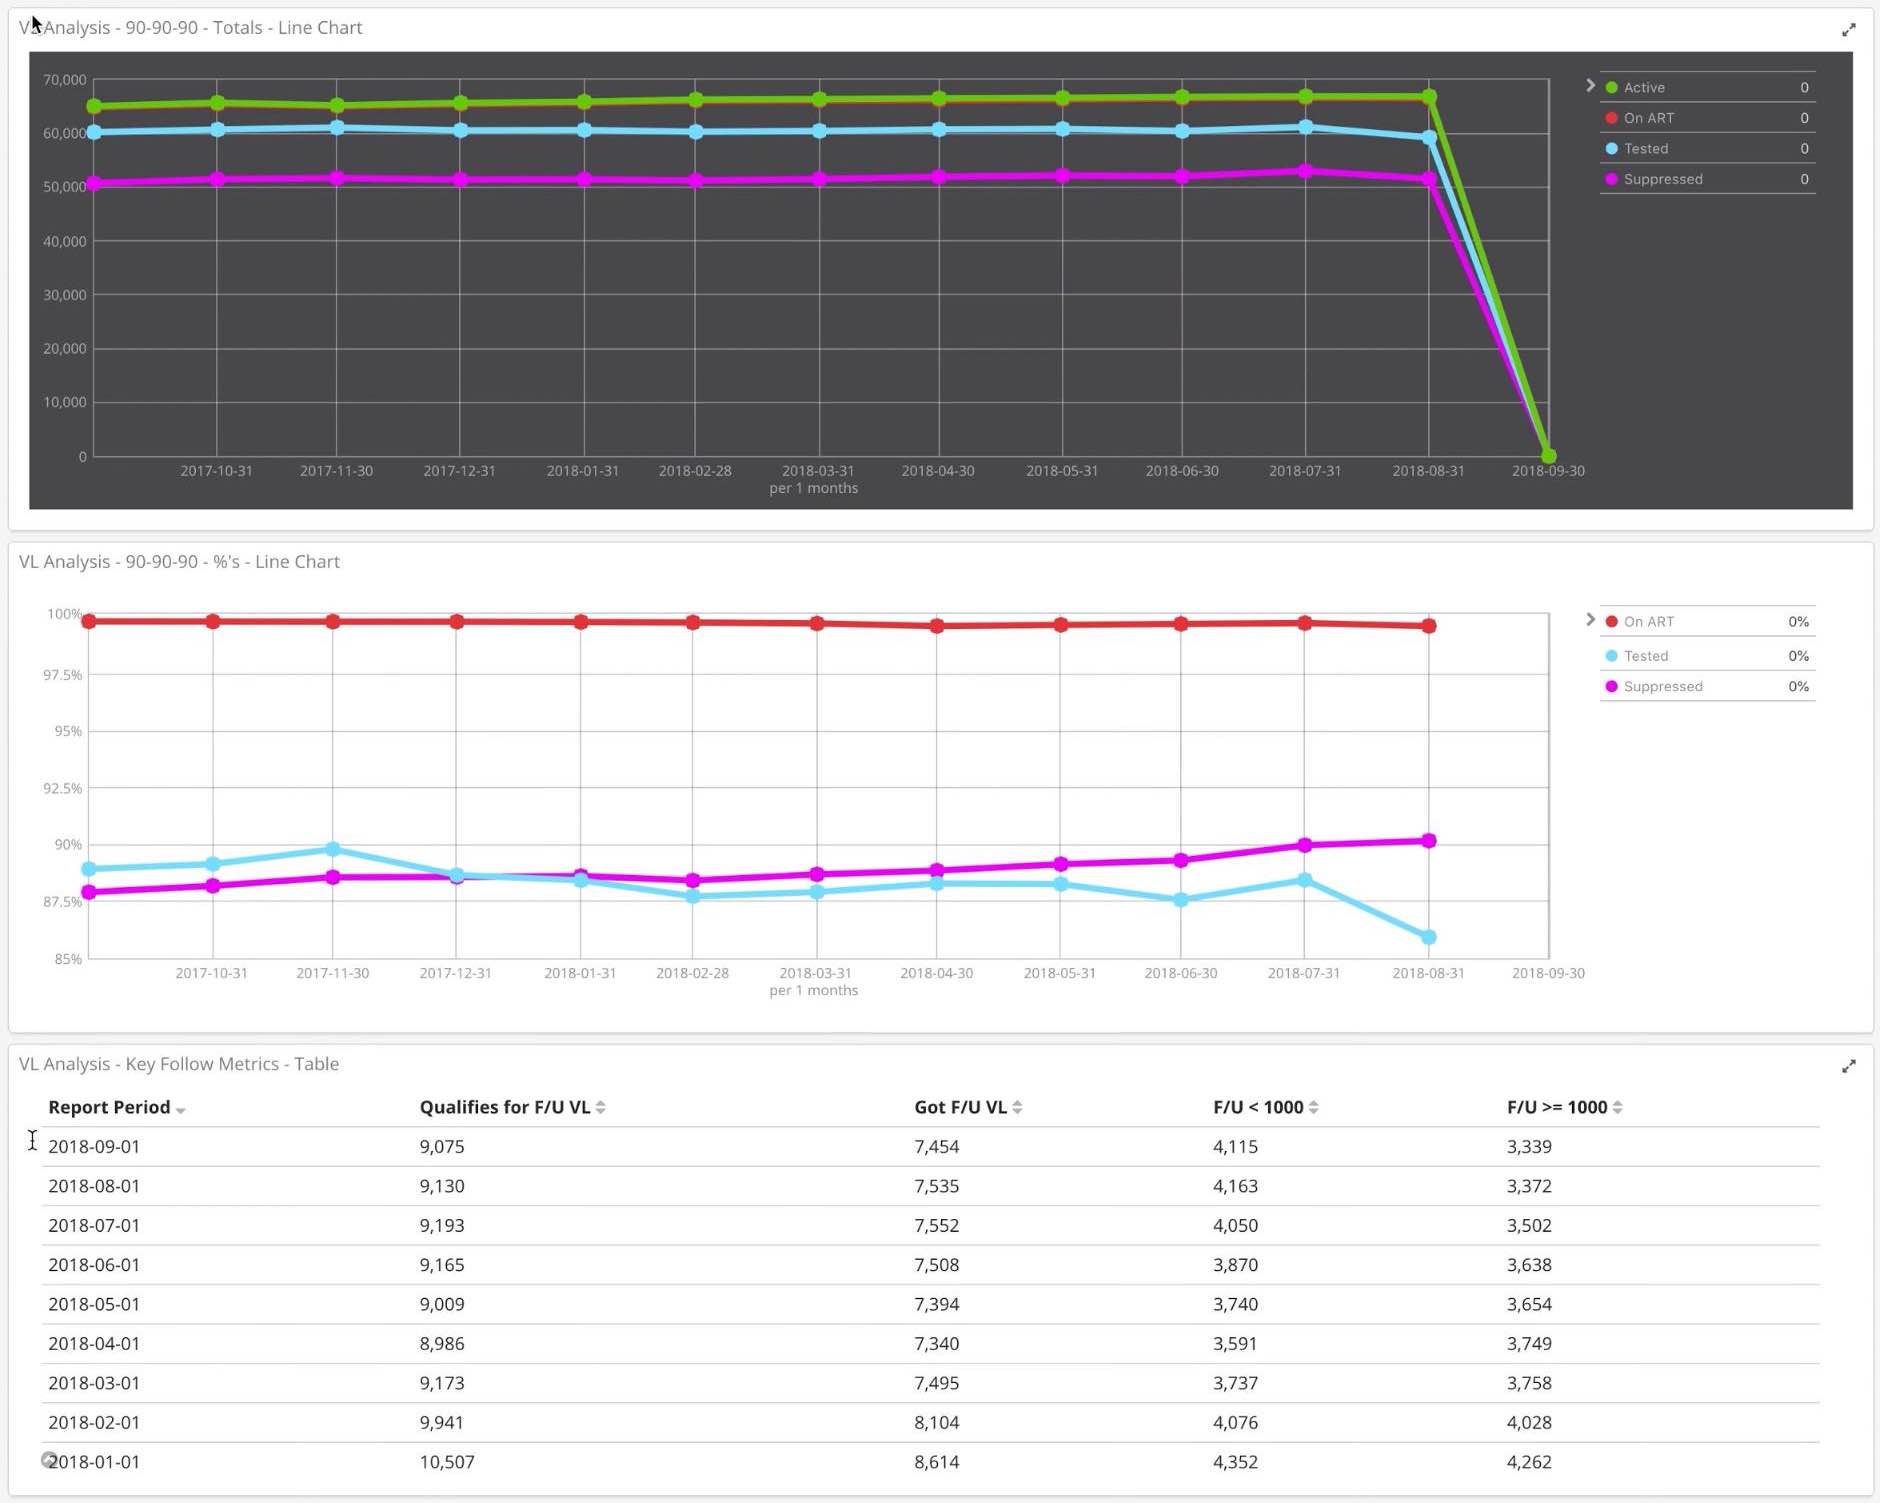
90-90-90 Trend Analysis Dashboard
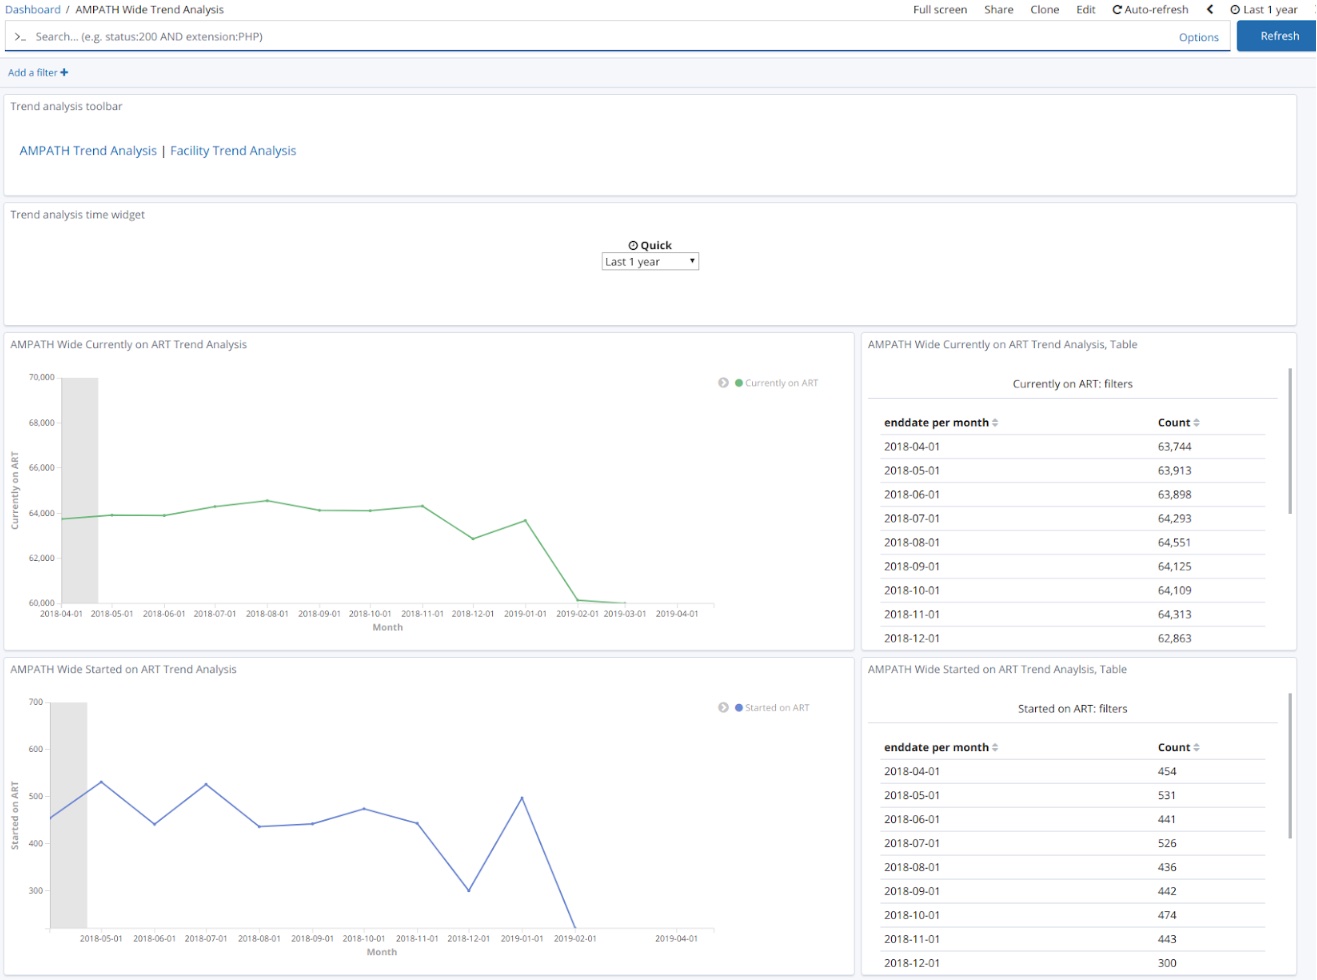
Overview of trends of HIV viral suppression in a clinic
Using these charts to view the trends, the clinicians and the management of a clinic can check if a patient's HIV treatment is meeting international targets. This is a critical indicators for clinics.
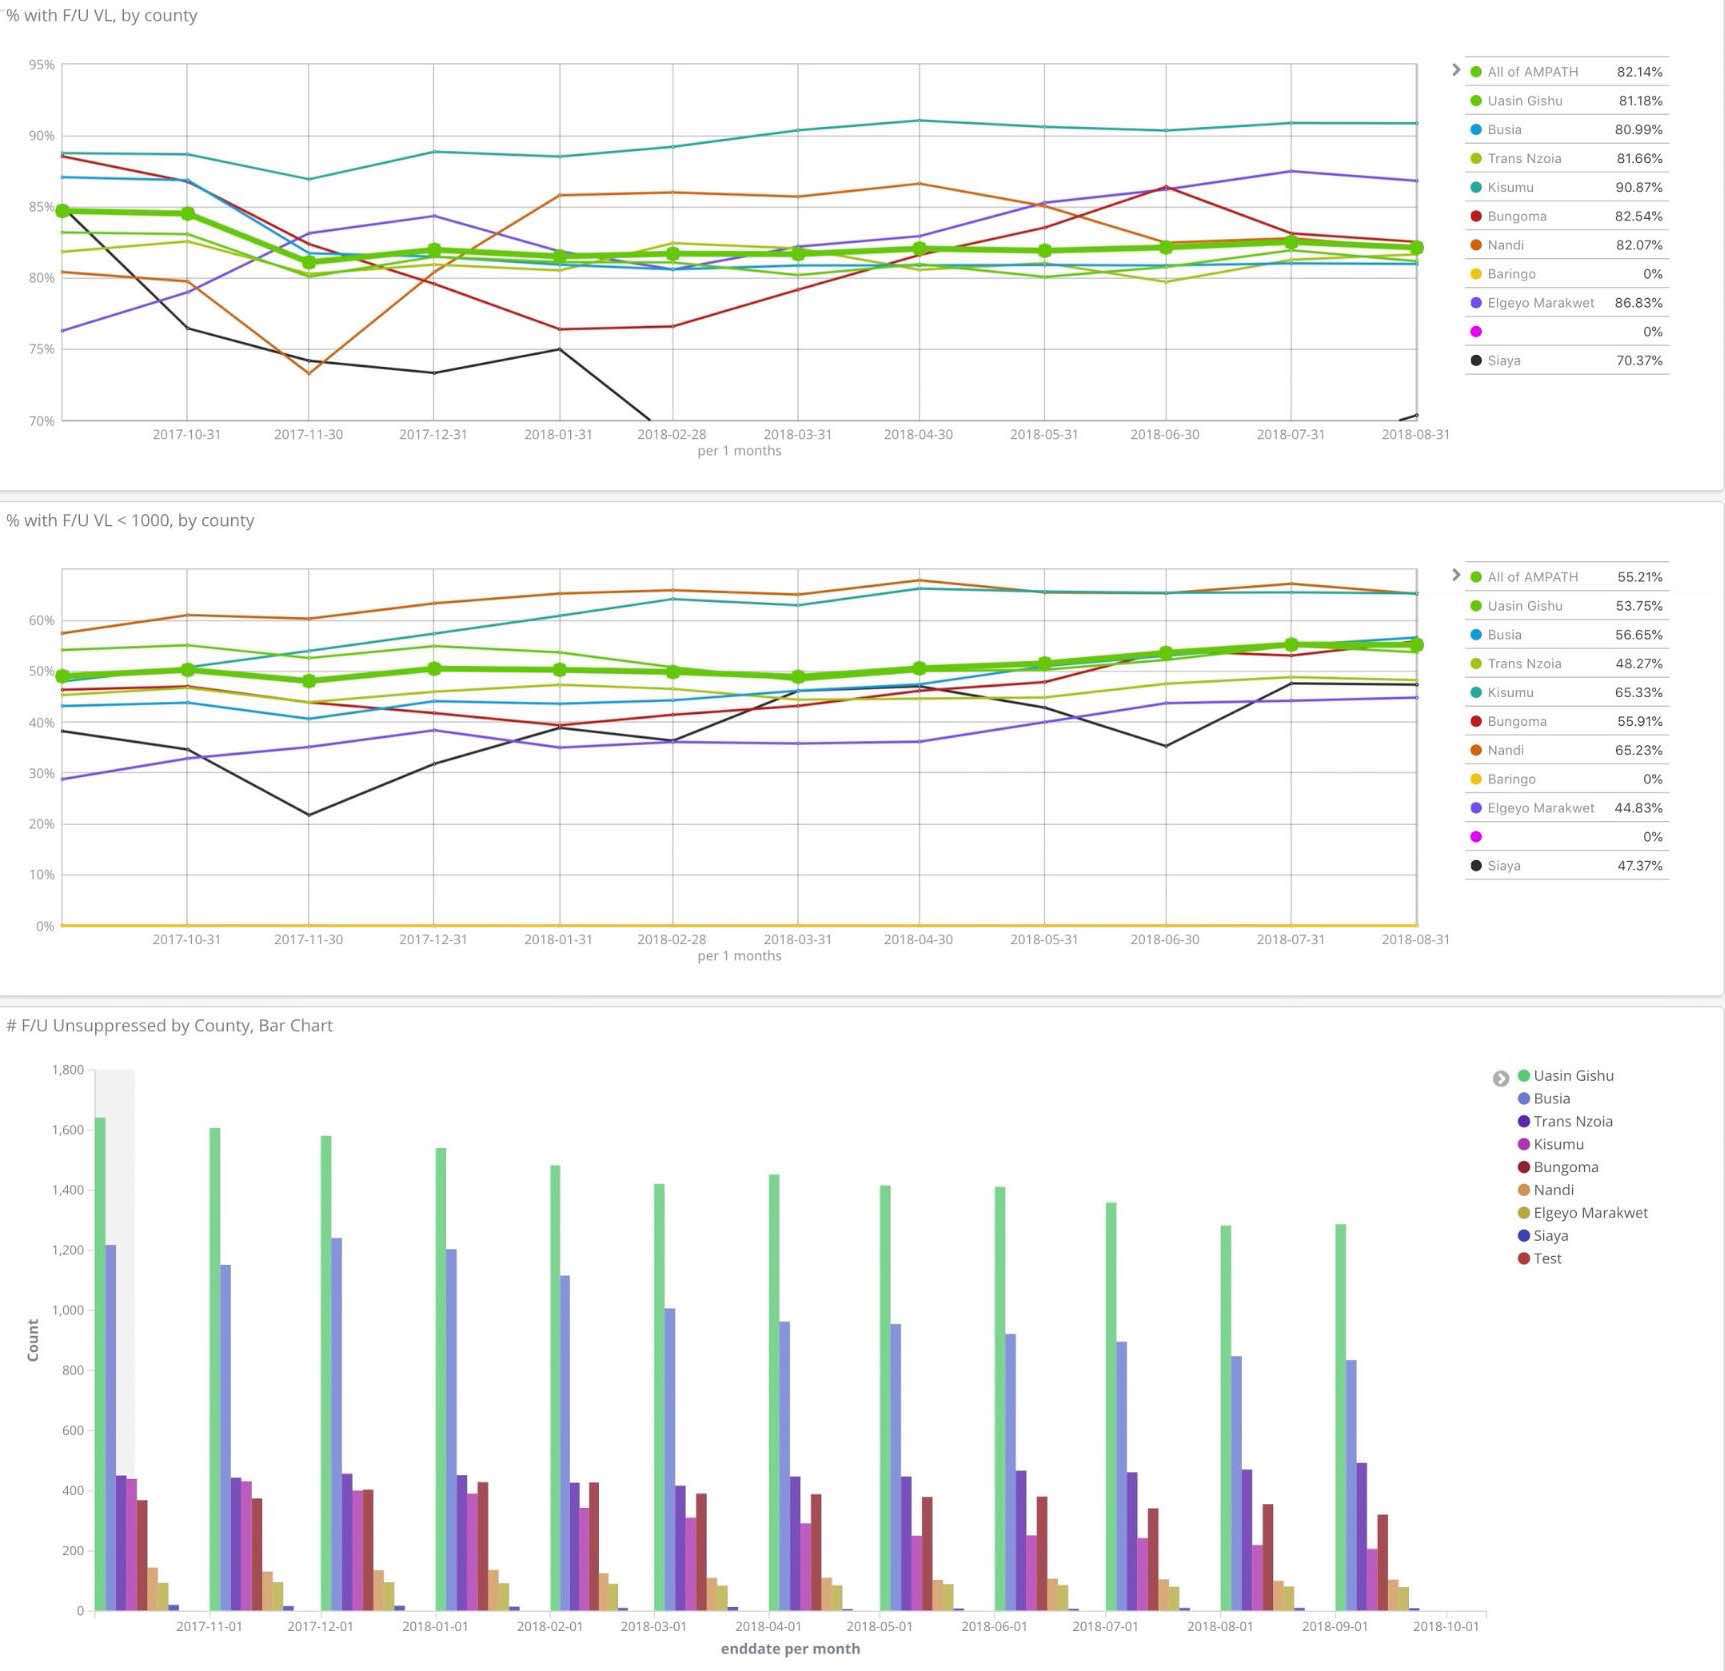
Control of HIV viral load suppression (an indicator of HIV treatment control), compared across multiple counties
Comparison of HIV viral load suppression with target rates
Utilizing anomaly detection in server response times with machine learning
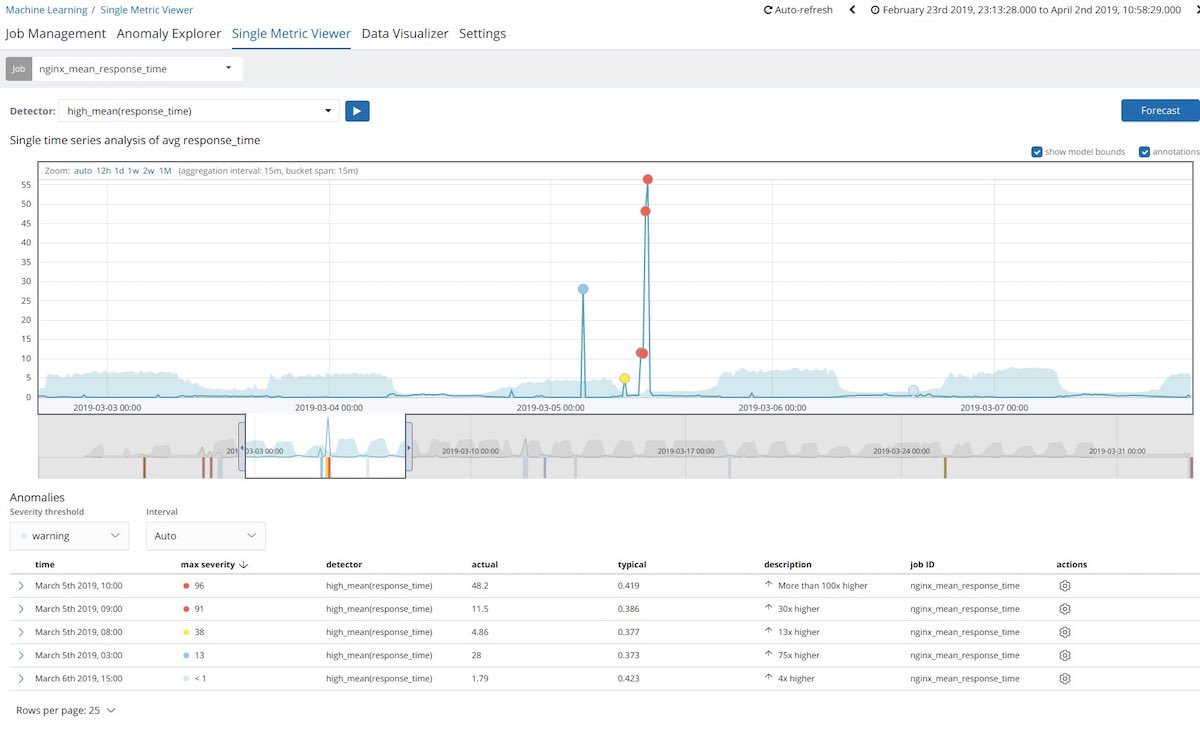
While AMPATH’s primary use case is monitoring and visualizing HIV-related health data, it also use the Elastic Stack for a variety of other uses, including uptime monitoring and log analytics.
Generating dashboards on the fly is a request AMPATH devs face on a daily basis. Before Kibana, this process was long and tedious, taking several weeks to code and produce visualizations that were often slow as they involved fetching data from a relational database. With Kibana, the AMPATH visualization team is able to create visualizations on the fly and embed them to the EMR. Users can then view and query the visualizations efficiently and quickly.
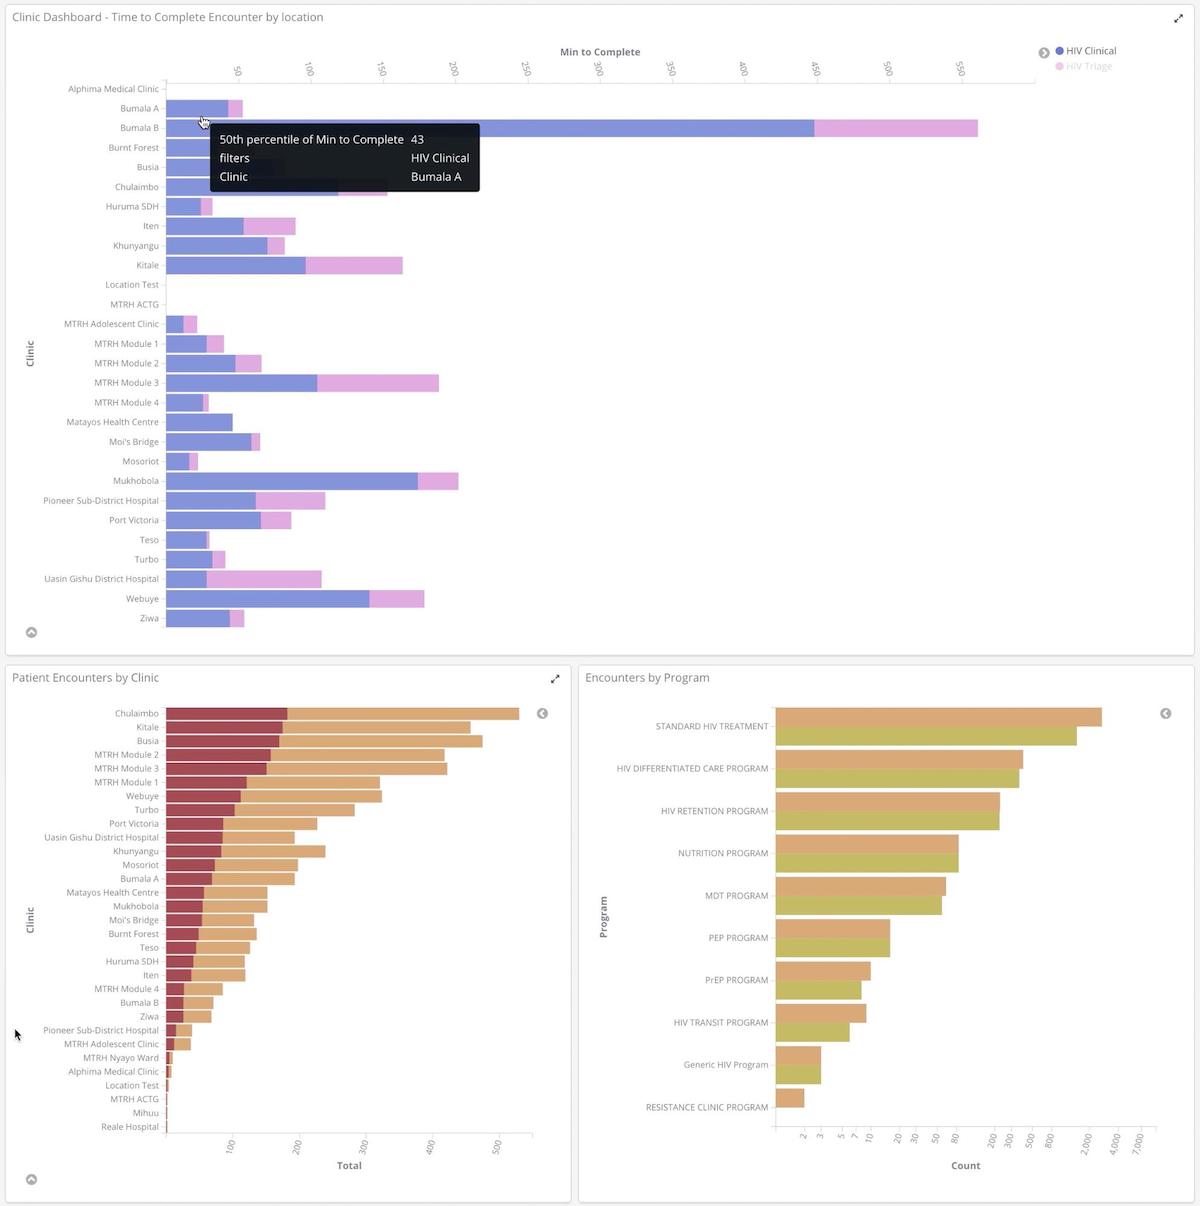
HIV Daily Clinic Overview Dashboard - overview of the HIV care system
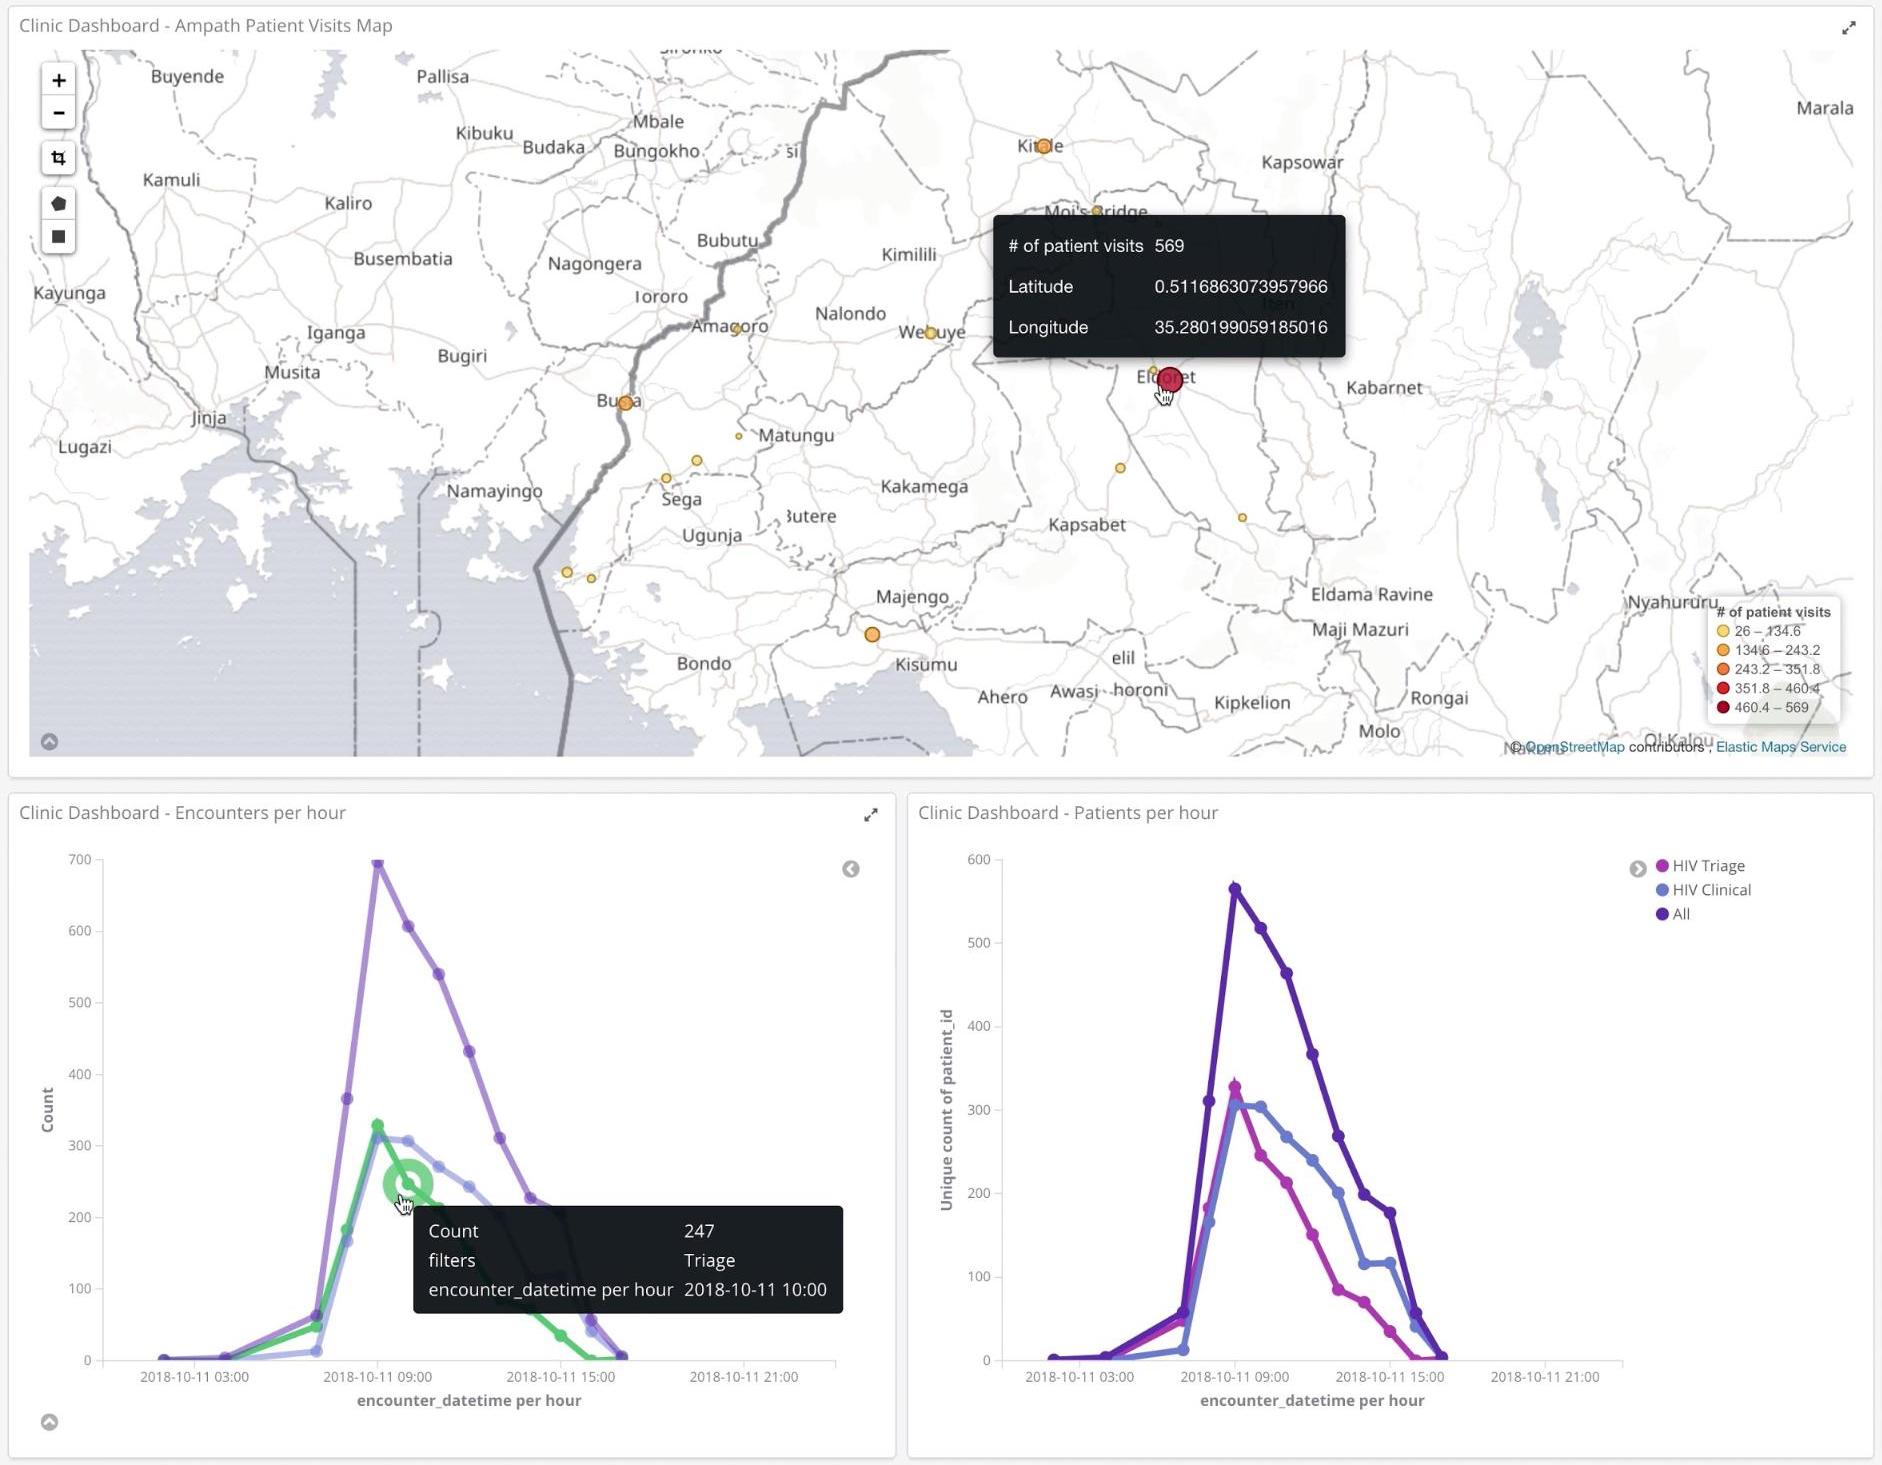
The following dashboard is helpful for administration to know which locations may have long waits.
HIV Daily Clinic Overview Dashboard - comparing the average wait time to see clinicians
Next steps
This coming year AMPATH would like to expand its dashboards to cover new disease verticals, and train users to be able to build their own Kibana visualizations. We also hope to expand the use of Elastic’s machine learning features for monitoring system performance.
Elastic has been an indispensable part of AMPATH’s mission to provide healthcare in low-resource settings. As AMPATH continues to expand its care system, there is no doubt that the success in patient care is linked to timely accessible to data. This is made possible with the Elastic Stack.
Authors’ Bios
Fatma Ali is a full stack developer in Eldoret, Kenya and is AMPATH’s ETL lead (https://medium.com/@fatmali)
Susan Mastamet is AMPATH’s visualization lead in Eldoret, Kenya.
Gregory Schmidt, MD designs medical record systems with AMPATH. (www.gregoryschmidt.ca @_GregSchmidt)
Jonathan Dick, MD is the Chief Medical Information Officer at AMPATH.