A Snapshot of the Elastic Timeline & How It All Came Together
When attendees turned the corner into the airy fishing-pier-turned-conference-venue for Elastic{ON} 2017, most eyes immediately banked left. They looked up. They looked down. Then they looked far away. And then they walked forward, and paused, and pointed, and stared, and stepped back, and pointed some more.
It was exactly what we had hoped for.

An Elastic{ON} attendee stops to look at the timeline wall at the 2017 user conference.
What attendees saw was a massive black wall approximately the length of a blue whale. On it, in white, was nine years of Elastic history going back to the early days (long before there ever was a company) to the latest 5.2 release in January 2017.
The infographic is split into four sections: software downloads per month, product releases, user group formation, and selected boundary-pushing events at the company and beyond. All dates and numbers were quadruple checked using the best sources we could find. The source Illustrator file is painfully accurate (there are 700+ guidelines to prove it!) and a marvel all its own.
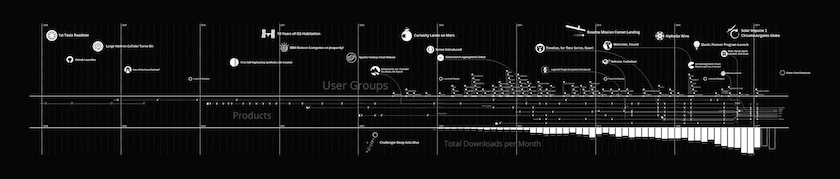
The full Elastic{ON} timeline wall that appeared at the 2017 user conference. Download the file.
To be honest, we didn’t really know how it would turn out in the final environment. We didn’t have the tools to really gauge what the final product might look like.
Would the empty spaces feel too empty? Would it be as readable as we’d hoped? Would the scale play out nicely? Would the dark magic required to print something like this work in our favor?
It’s been said that luck is only as good as the preparation that goes into it. Well, we got lucky.
What struck us most is how it became a conversation piece or a visual to get lost in between sessions. Attendees marked when they first started using each product with neon stickers. They found when their local user groups first came online.

Monica Sarbu, co-creator of Packetbeat and later Beats, marks when she first started using each Elastic product. She's an early adopter, of course.
And there were different ways of looking at the timeline. Up close it tells one story, and from far away, it tells another. It's reminiscent of the Cosmic Calendar: in the beginning, there wasn’t much, but as time passed, more and more happened.
An internal favorite is perhaps the product slice of the timeline. The design was inspired by subway transportation maps. You can see how far back some products go and watch the release cadence evolve from a seemingly random pattern to a more ordered one with Elasticsearch 2.0 in October 2015 and then a tighter integration across all product lines with 5.0 a year later.
There’s plenty more to be said about this infographic. For now, have a look yourself and tell us what you see on Twitter using #elasticstack.