The evolution of Discover in Kibana
Introducing the new enhanced data table, field statistics, and alert rule creation


 Share on Twitter
Share on Twitter

 Share on LinkedIn
Share on LinkedIn

 Share on Facebook
Share on Facebook

 Share by Email
Share by Email

 Print this page
Print
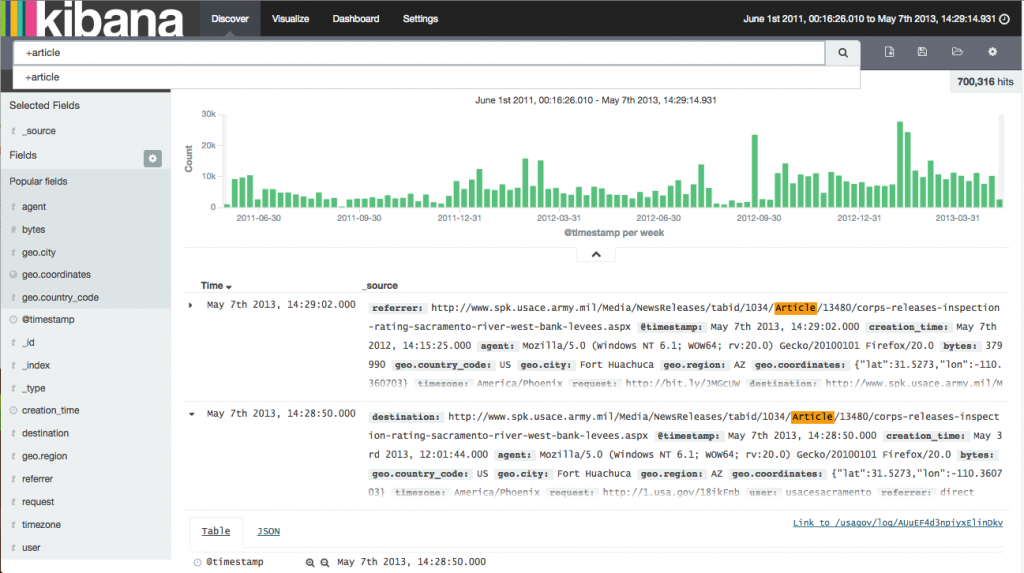
Discover has been around for quite some time. Still, it is one of the most used parts of Kibana, allowing you to search and view the atoms of Elasticsearch: the indexed documents. In 2015, it was released as part of Kibana 4. Let’s have a look at the early days of data discovery:
In 5.6, the last significant change enabling users to view surrounding documents of a selected document was added (it was a separate plugin at that time). During 6.x and 7.x, we focused on removing technical debt, like moving from Angular 1 to React and migrating to Kibana’s new platform.
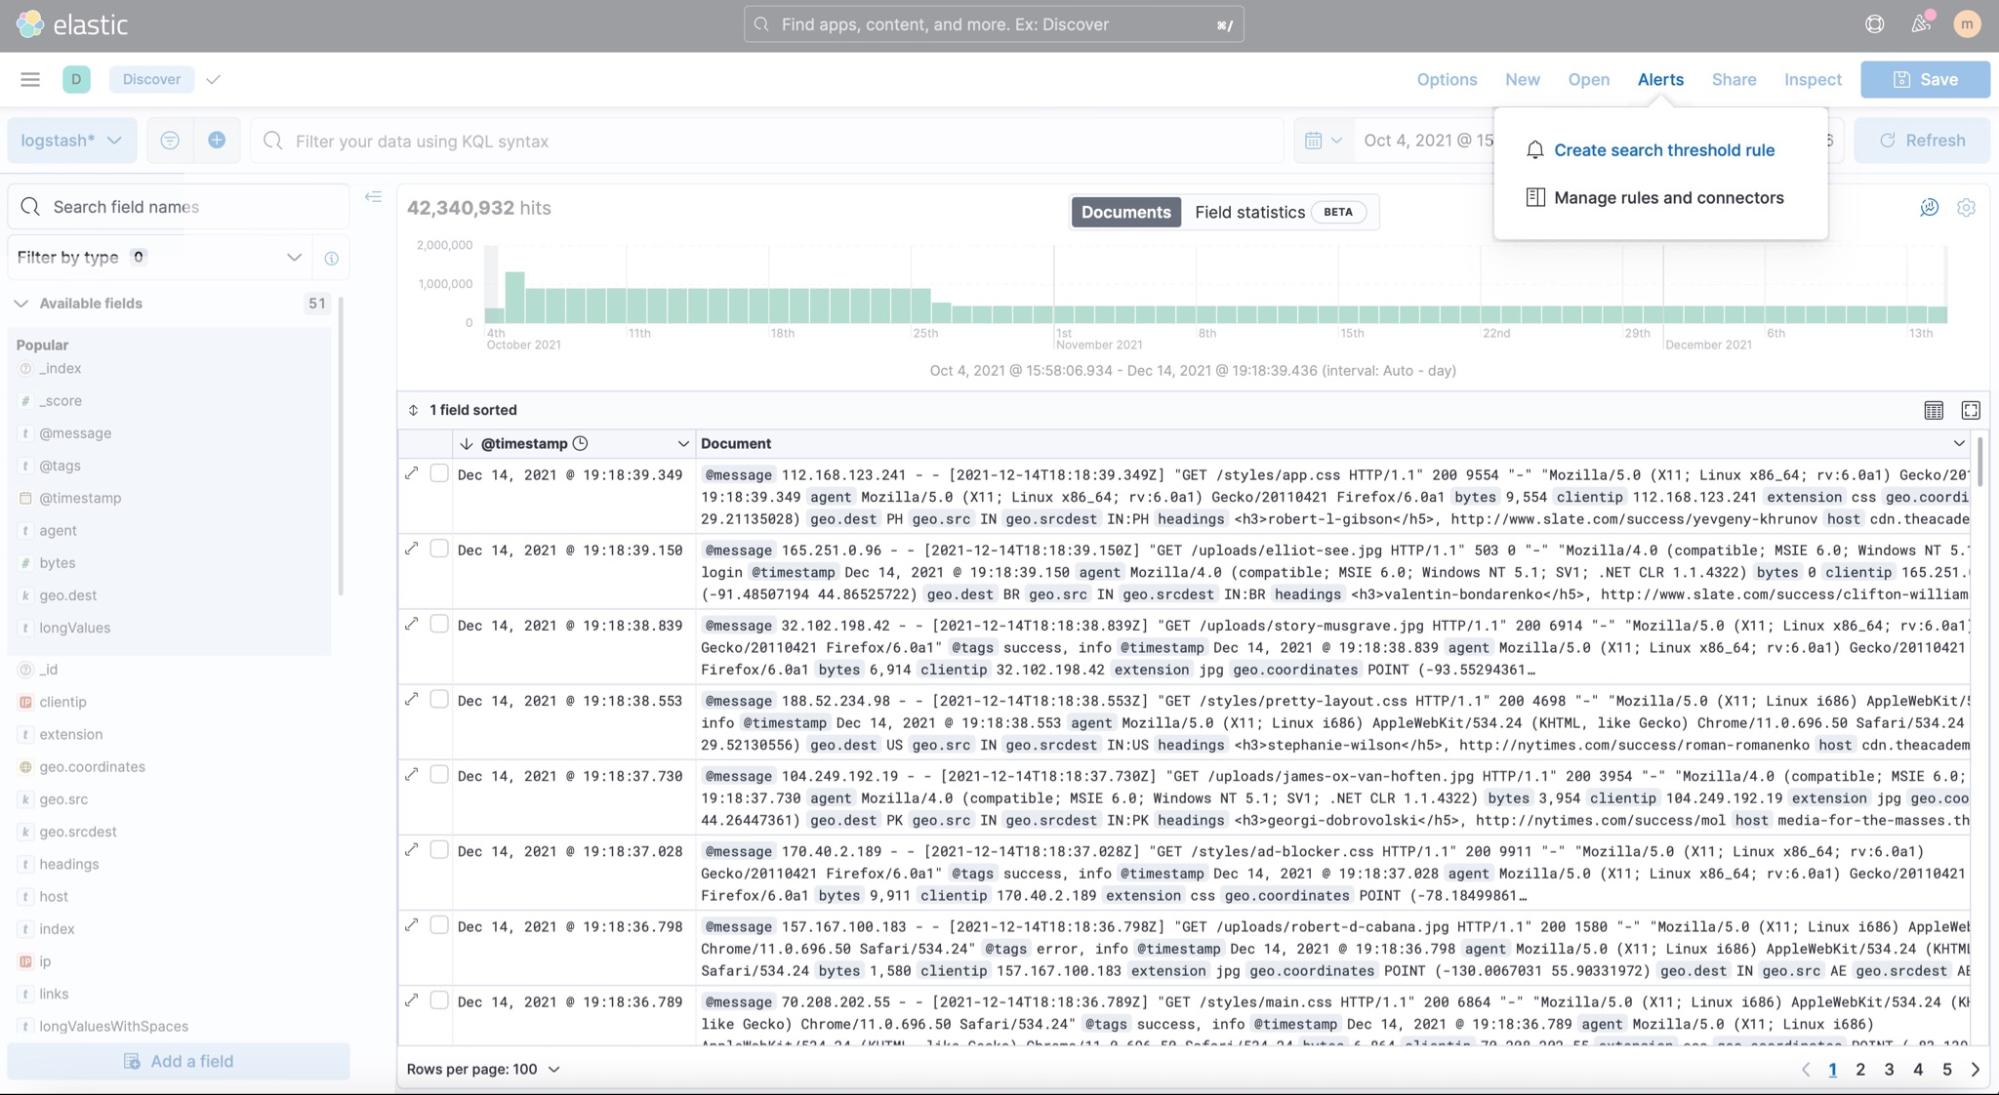
Now in 8.x, we’ve been adding big changes one after another. We recently introduced a new enhanced document table, field statistics, and the ability to create search threshold alerts. The screenshot below shows what has been recently added or changed:
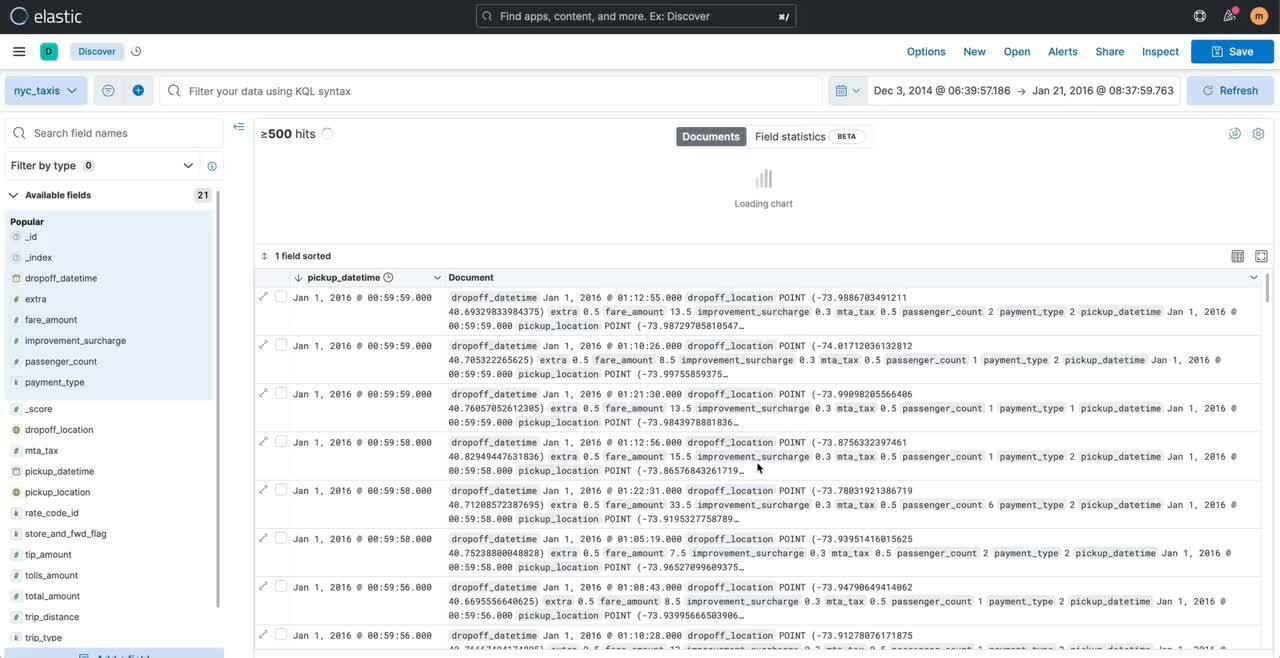
Document explorer — the new enhanced data table
In 8.2, a significant change to our data table, powered by the EuiDataGrid of our excellent design library EUI, became generally available. Lots of users requested to be able to configure the widths of the table’s columns. Now, this is possible using drag and drop.
[Related article: Elasticsearch, Kibana, Elastic Cloud 8.2: Boost insights with data exploration in Discover]
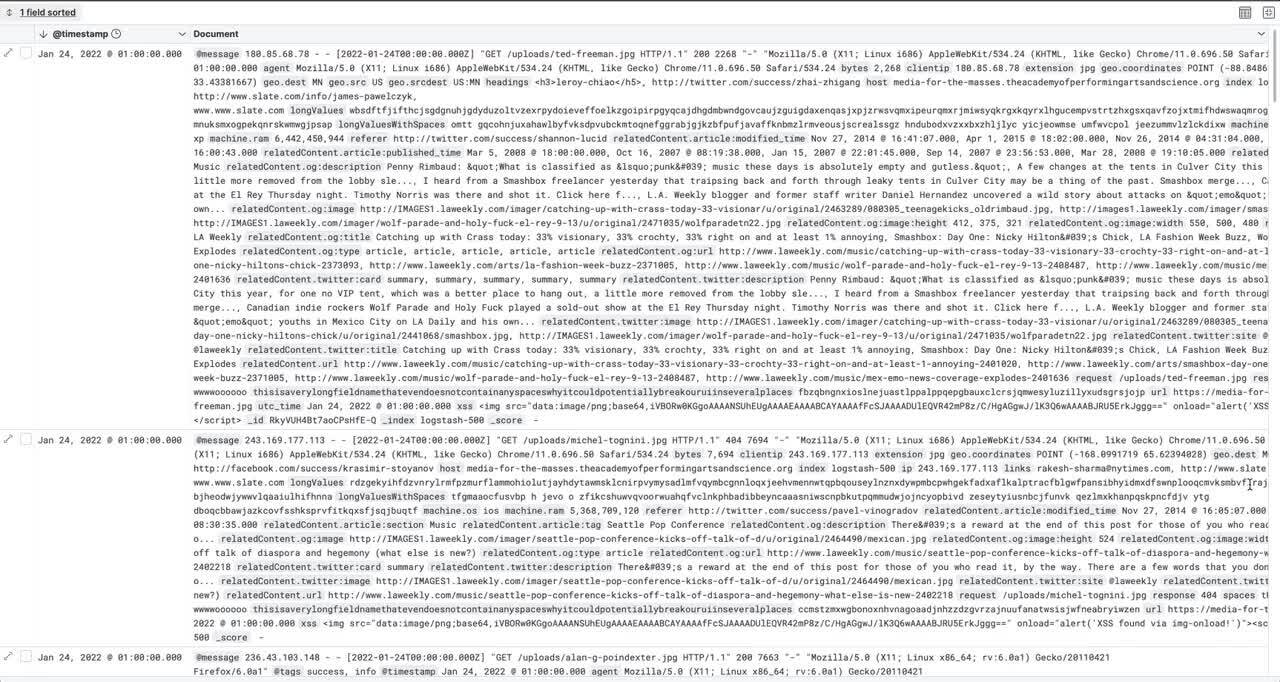
Optimize for best use of available screen space to reveal potential anomalies:
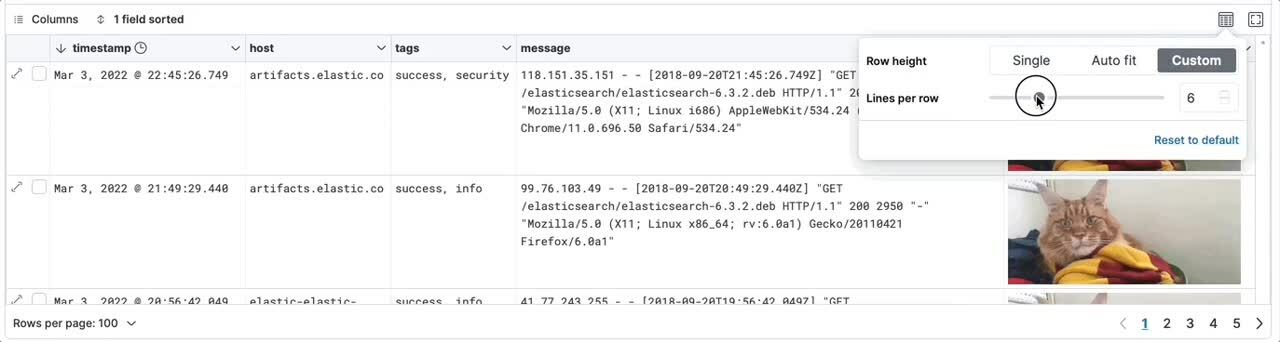
The same applies to the usage of vertical screen space. You can now choose between displaying 1–20 lines. If that’s not enough, just select Auto fit to get a bigger picture.
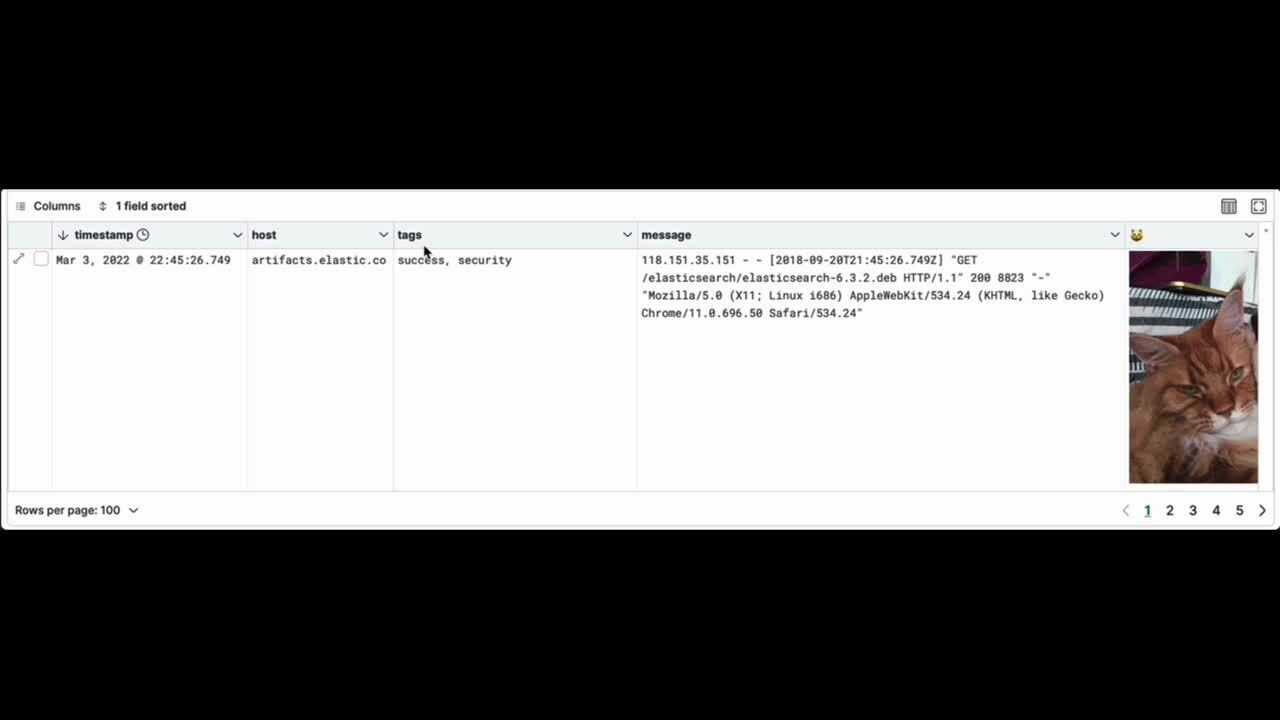
If you wonder how to show pictures in the table, this feature has been around for quite a while. Recently we’ve added a link to the column’s context menu, so it’s much easier to access.
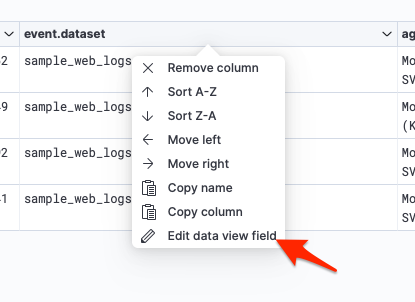
The link opens a flyout allowing you to set a custom label and edit the formatting of the field (field formatters). When you set the format to URL, select the Image type. This transforms the URL of the actual field into a displayed image.
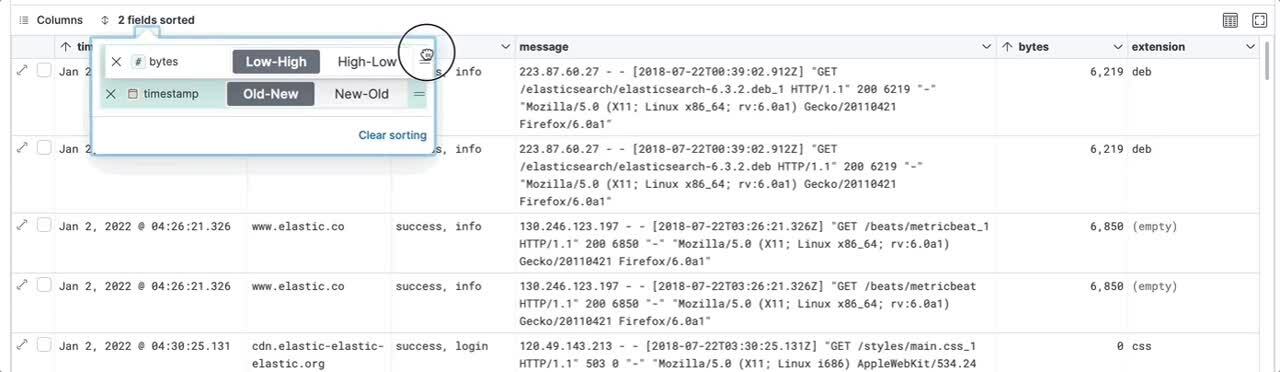
What’s more, we improved sorting by multiple fields. It was confusing when using the classic table, and confusion is a bug that needs to be fixed. Now you can change the order of fields to sort by with drag and drop, and remove sorting fields to sort by in a simple interface.
Want to remove distractions to focus on your data? Switch to the full screen mode! This is especially useful when you want to focus on data presented on a dashboard.
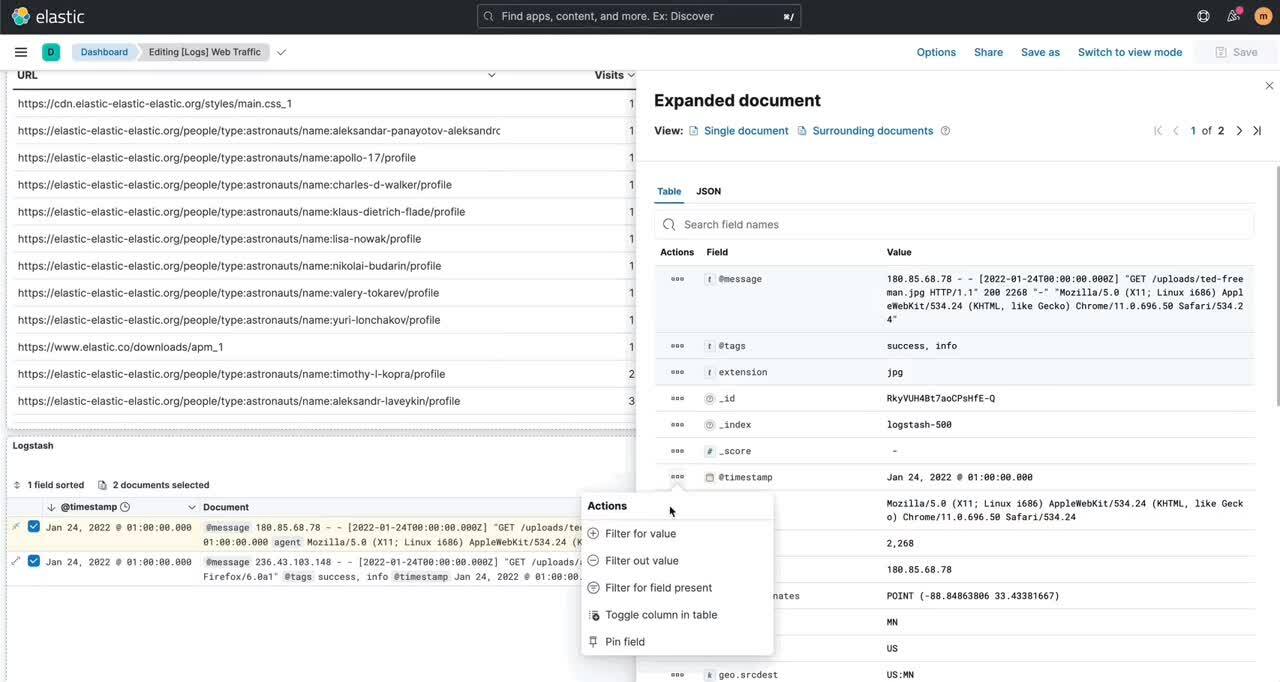
One more thing: you can select documents and filter down manually to a subset of your search, viewing those documents in a flyout. This is an especially better experience on a dashboard. On this flyout, you can search and pin fields and use pagination to view the previous or next document.
All in all, Discover is now capable of adjusting the view of data in a much better, more configurable way. Apart from this, we also offer a new tool in Discover, helping you to get your data even better.
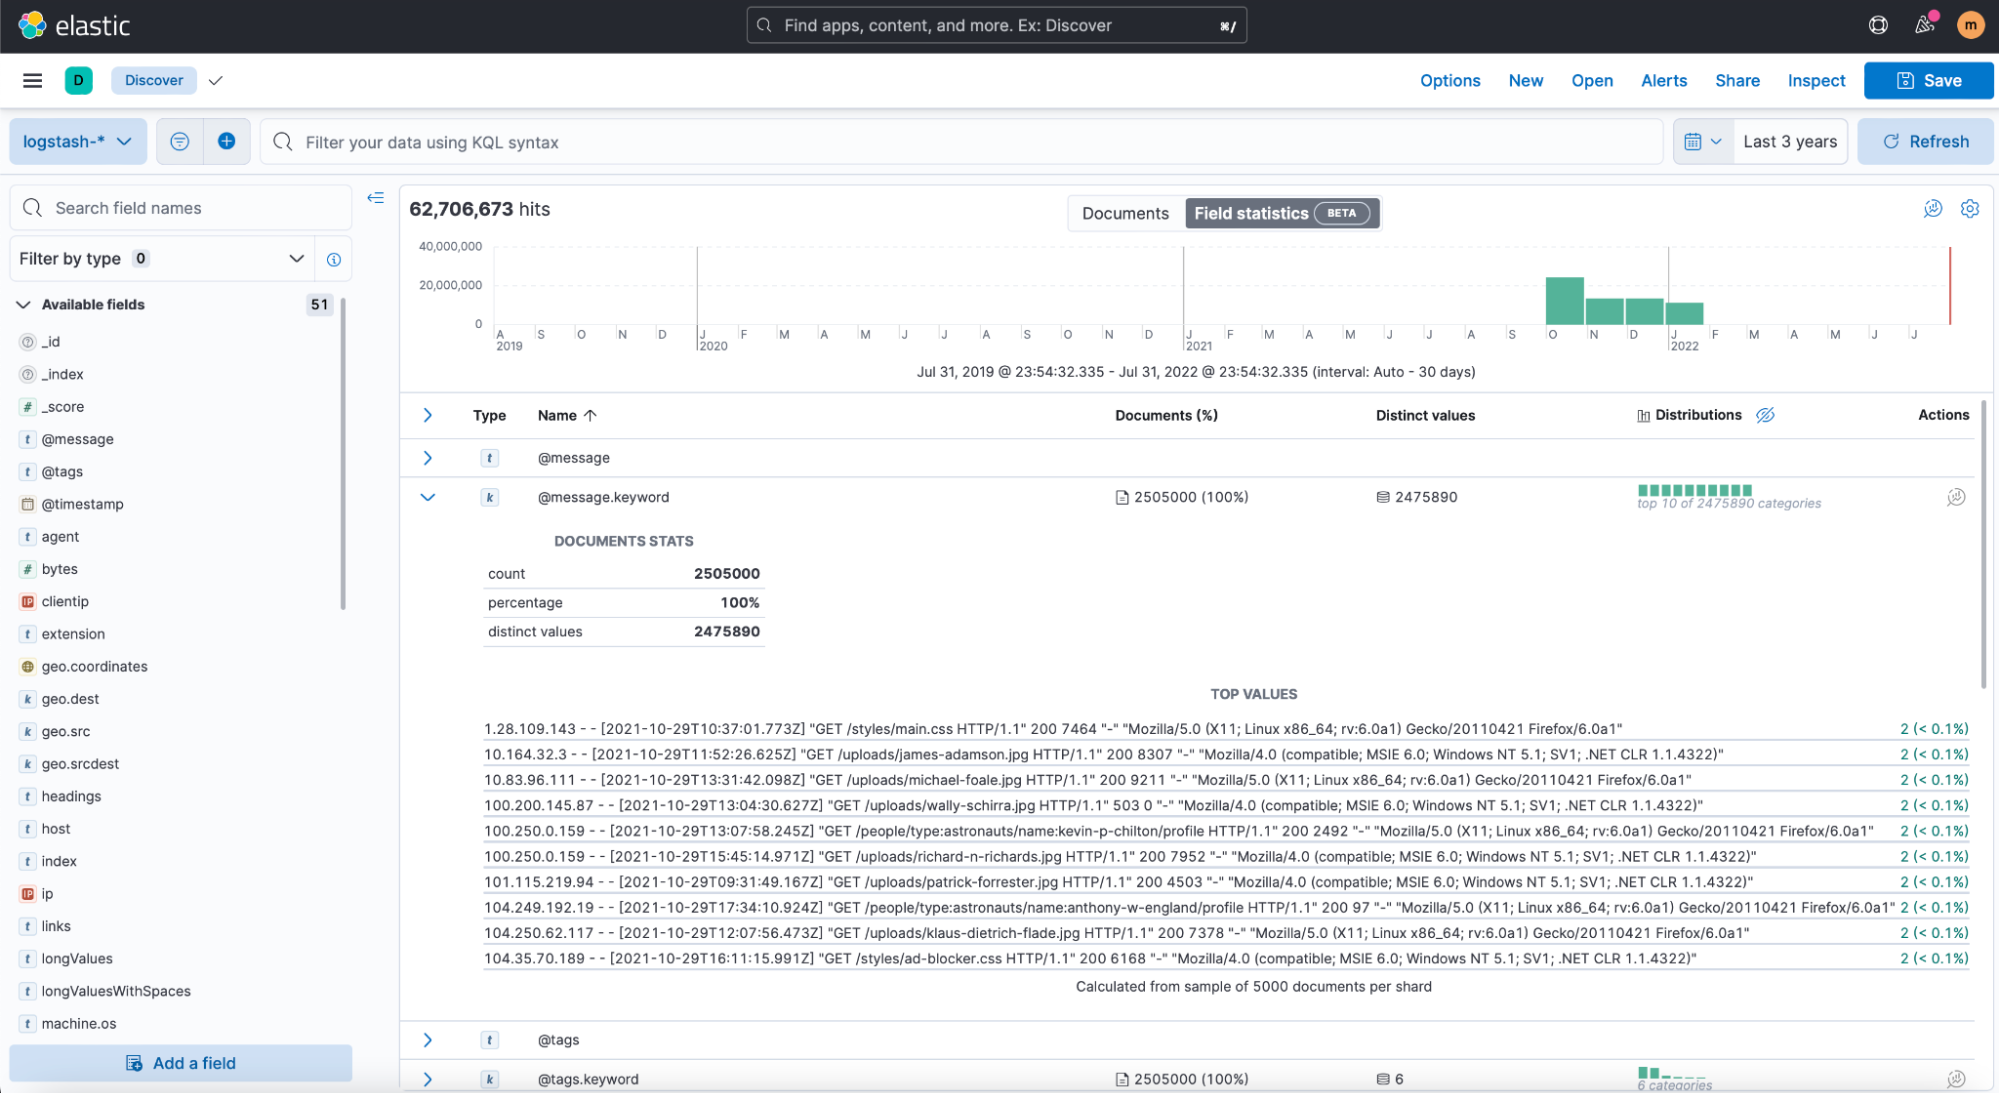
New in Discover: Field statistics!
Kibana’s Machine Learning has been offering Data Visualizer for a while. In 8.1, it was added to Discover labeled Field statistics. It offers a convenient way to gain more insight into the structure of the data in Elasticsearch. Want a quick overview of a field’s top values, its cardinality, the percentage of documents containing it, and its distribution? It’s now just a single click in Discover.
Speed is essential
To deliver information about the results of your query more quickly, we split up the requests to Elasticsearch. Now there’s one request fetching the matching documents and another one fetching the aggregated data needed to show the histogram including the total number of hits. So usually, when querying a large amount of data, the matching documents are visible quicker, while it might take a bit longer to return the exact number of hits and the aggregated data. No matter which data is returned first, the information is visible more quickly.
Hint: If you’re not interested in the histogram, you can hide it to gain more vertical disk space. If you’re only interested in the histogram, there’s a button taking you to Lens. This way, you can further explore and customize this visualization.
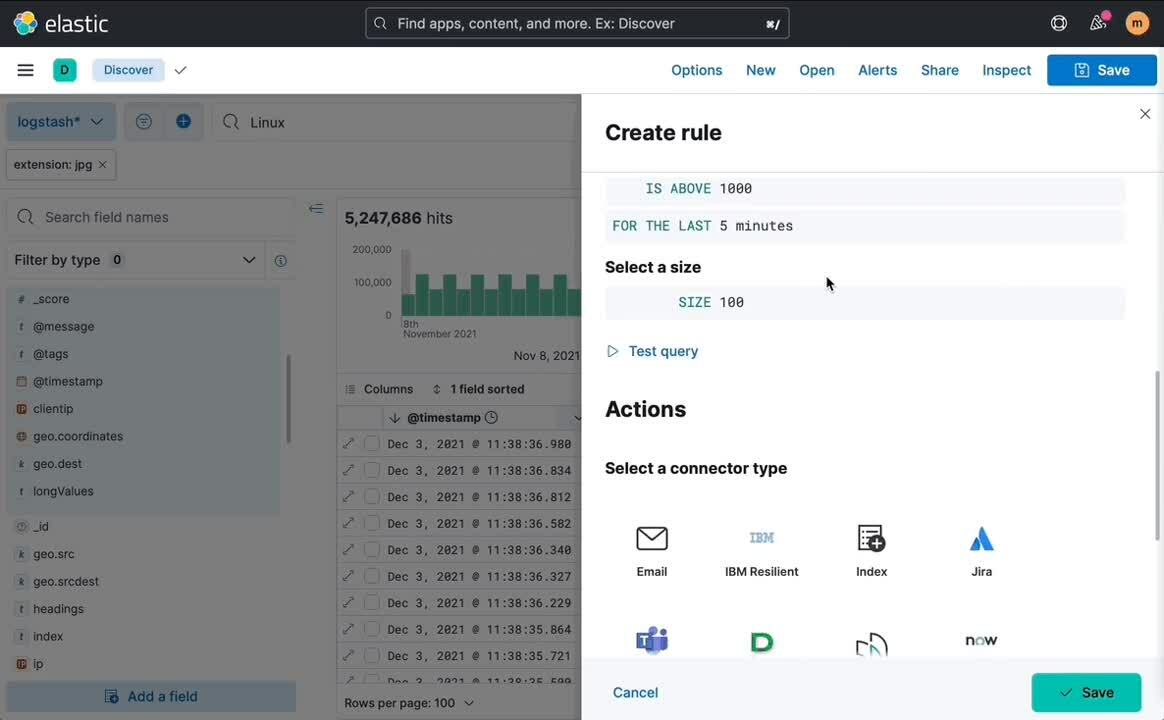
Alerting in Discover
Since 8.3, Discover supports you to no longer miss when documents of special interest are ingested in Elasticsearch. A log message of critical severance, an online order larger than a certain amount, the authentication log of your server reporting strange data — any information that matters can be turned into a notification.
For this purpose, Discover now offers an easy way to create alert rules. It is recommended to first select the data view of your choice and narrow your data by adding a query and filters. Once you submit the request and are satisfied with the results to create a new alert rule, select Alerts / Create search threshold rule in Discover’s toolbar. This action opens a flyout that provides various parameters to configure a new threshold alert. Kibana offers lots of actions to be executed when the conditions are met, including email, Slack, Pager duty, ServiceNow, and many, many more.
What’s next
From the start, Discover always had one requirement to start querying data: an existing data view (a.k.a. index pattern, before we recently renamed it). You always needed Kibana's Stack management before you could start. Soon this will no longer be necessary. You can go to Discover, enter a pattern matching indices of your interest, and get results even if there’s no data view available. So you can focus on what matters: getting quick answers by querying your data.
Disclaimer: The pictures used in the screencaps were used with friendly permission by Discover’s Elasticat Karli.
Share
- Share on Twitter
Share on Twitter
- Share on LinkedIn
Share on LinkedIn
- Share on Facebook
Share on Facebook
- Share by Email
Share by Email
- Print this page
Print