Machine Learning for Nginx Logs - Identifying Operational Issues with Your Website
Editor's Note (August 3, 2021): This post uses deprecated features. Please reference the map custom regions with reverse geocoding documentation for current instructions.
Getting insight from nginx log files can be complicated. This blog shows how machine learning can be used to automatically extract operational insights from large volumes of nginx log data.
Overview
Data science can be a complicated, experimental process where it is easy to get lost in the data, or the counter-intuitiveness of statistics. Therefore, a key design goal for the Machine Learning group at Elastic is to develop tools that empower a wide spectrum of users to get insight out of Elasticsearch data.
This lead to us to develop features such as "Single Metric Job" and "Multiple Metric Job" wizards in X-Pack Machine Learning, and we are planning to simplify analysis and configuration steps even more in upcoming releases.
In parallel to these wizards, we are also planning to shrink-wrap job configurations on known Beats and Logstash data sources. For example, if you are collecting data with the Filebeat NGINX module, we can provide a set of shrink-wrapped configurations and dashboards to help users apply machine learning to their data. These configurations are also aimed at showing how we develop Machine Learning configurations internally based on our experience.
The details of how to install these configurations will be covered in a subsequent blog. This blog is aimed at describing the use cases and configurations.
Use Case Notes
The configuration options for X-Pack Machine Learning are extensive, and often new users are tempted to start with complex configurations and select large numbers of attributes and series. These types of configurations can be very powerful and expressive, but require care as the results can be difficult to interpret. We therefore recommend that users start with simple, well-defined use cases, and build out complexity as they become more familiar with the system. (Note, often the best initial use cases come from automating anomaly detection on charts on the Operations teams core dashboards.)
Example Data Description
The data used in these examples is from a production system consisting of 4 load balanced nginx web servers. We analysed 3 months data (~29,000,000 events, ~1,100,000 unique visitors, ~29GB data). Note, the data shown here has been anonymised.
nginx log format:
'"$http_x_forwarded_for" $remote_addr - [$time_local] "$request" $status $body_bytes_sent "$http_referer" "$http_user_agent"';
Sample log message:
"2021:0eb8:86a3:1000:0000:9b3e:0370:7334 10.225.192.17 10.2.2.121" - - [30/Dec/2016:06:47:09 +0000] "GET /test.html HTTP/1.1" 404 8571 "-" "Mozilla/5.0 (compatible; Facebot 1.0; https://developers.facebook.com/docs/sharing/webmasters/crawler)"
Once processed by Filebeat's NGINX module configuration, we get the following JSON document in Elasticsearch:
... { "nginx" : { "access" : { "referrer" : "-", "response_code" : "404", "remote_ip" : "2021:0eb8:86a3:1000:0000:9b3e:0370:7334", "geoip" : { "continent_name" : "Europe", "country_iso_code" : "PT", "location" : { "lon" : -10.23057, "lat" : 34.7245 } }, "method" : "GET", "user_name" : "-", "http_version" : "1.1", "body_sent" : { "bytes" : "8571" }, "remote_ip_list" : [ "2021:0eb8:86a3:1000:0000:9b3e:0370:7334", "10.225.192.17", "10.2.2.121" ], "url" : "/test.html", "user_agent" : { "major" : "1", "minor" : "0", "os" : "Other", "name" : "Facebot", "os_name" : "Other", "device" : "Spider" } } } }...
Use Case 1: Changes in Website Visitors
Operationally, system issues are often reflected in changes in visitor rate. For example, if the visitor rate declines significantly in a short period of time, it is likely that there is a system issue with the site. Simple ways to understand changes in visitor rate are to analyse overall event rate, or the rate number of distinct visitors.
Job 1.1: Low Count of Website Visitors
This job can simply be configured using the 'Single Metric Job' wizard:
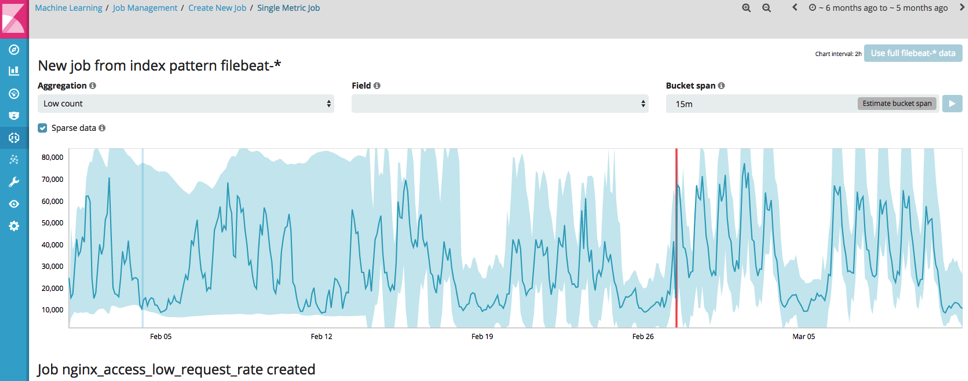
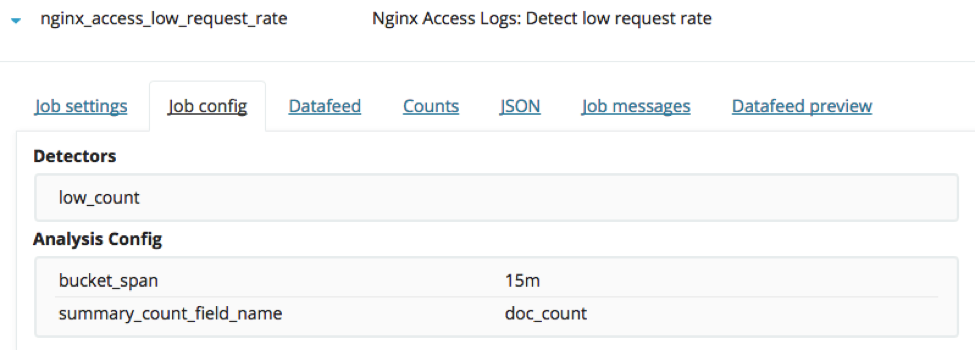
Job configuration summary:
This analysis shows a significant anomaly on February 27th where the total event rate drops significantly:
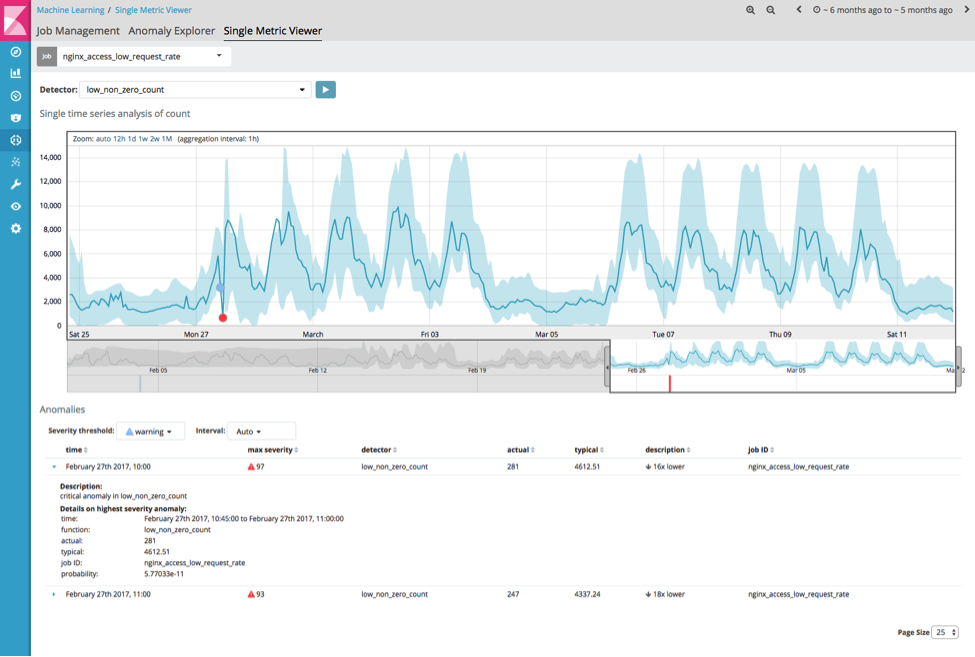
(Note this analysis of the 29,000,000 events took a total of 16s on a m4.large AWS instance)
Job 1.2: Low Count of Unique Website Visitors
Event counts can be strongly influenced by bots or attackers, and so a more consistent feature to analyse the number of unique website visitors. Again this can simply be configured using the 'Single Metric Job' wizard:
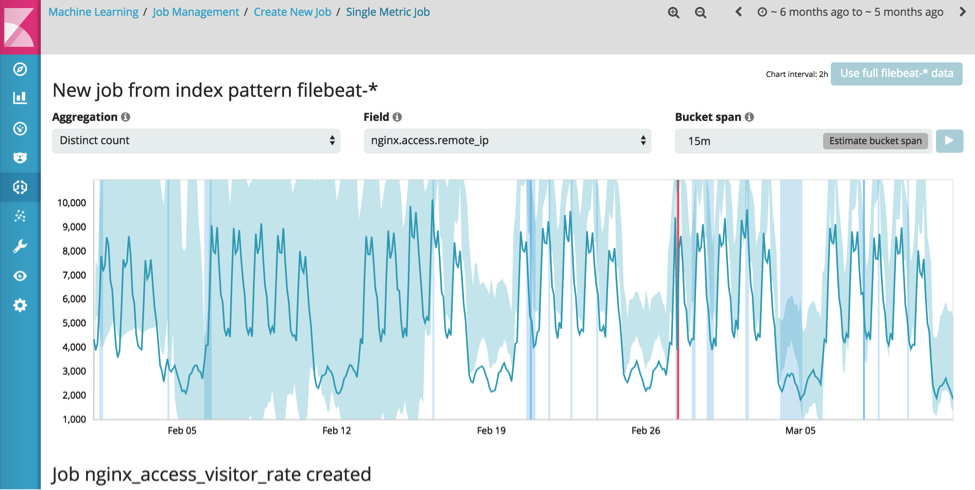
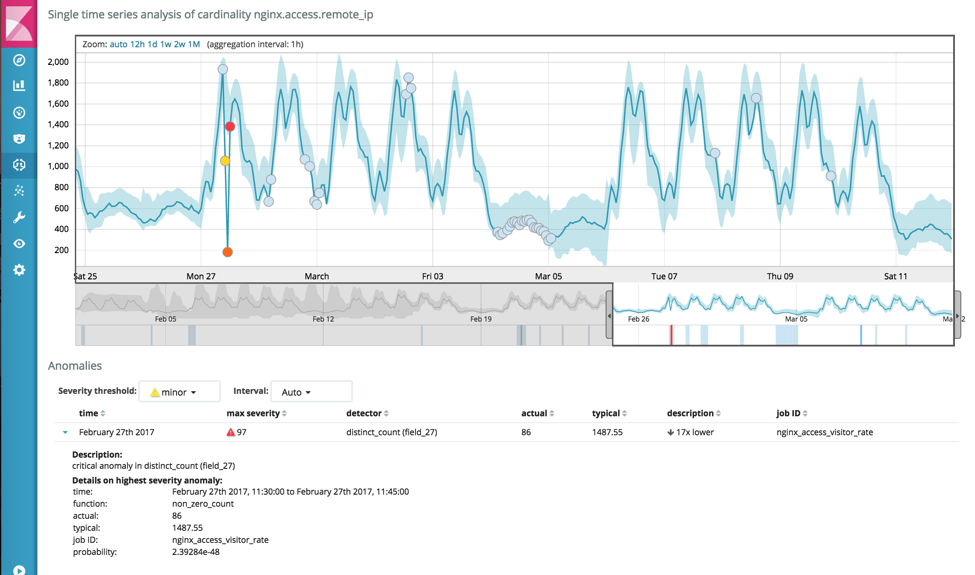
Again there is a significant anomaly on February 27th where the number of unique visitors per 15m drops from a typical 1487 to 86:
Combining Job 1.1 and 1.2:
Using the Anomaly Explorer the results from both jobs can be temporary correlated to give an 'Overall' view into the anomalousness of the system based on these features:
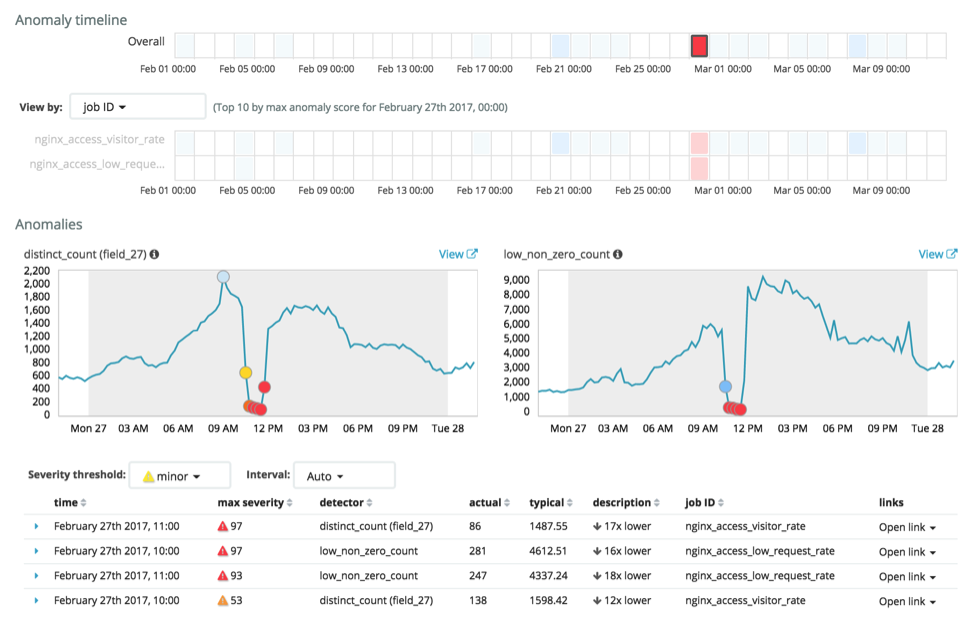
This clearly shows in a single view, that there was a significant anomaly on February 27th between 10:00-12:00 where the total event rate dropped, and the number of unique visitors dropped.
The operations team confirmed the site had significant issues at this time due to a prior configuration change in the CDN. Unfortunately, they didn't detect the user impact until 11:30 (due to internal users on Slack complaining), whereas with ML they would have been alerted at 10:00 when the issue occurred.
This analysis can be combined with alerting to give operations teams early insights into changes in system behaviour.
Use Case 2: Changes in Website Behaviour
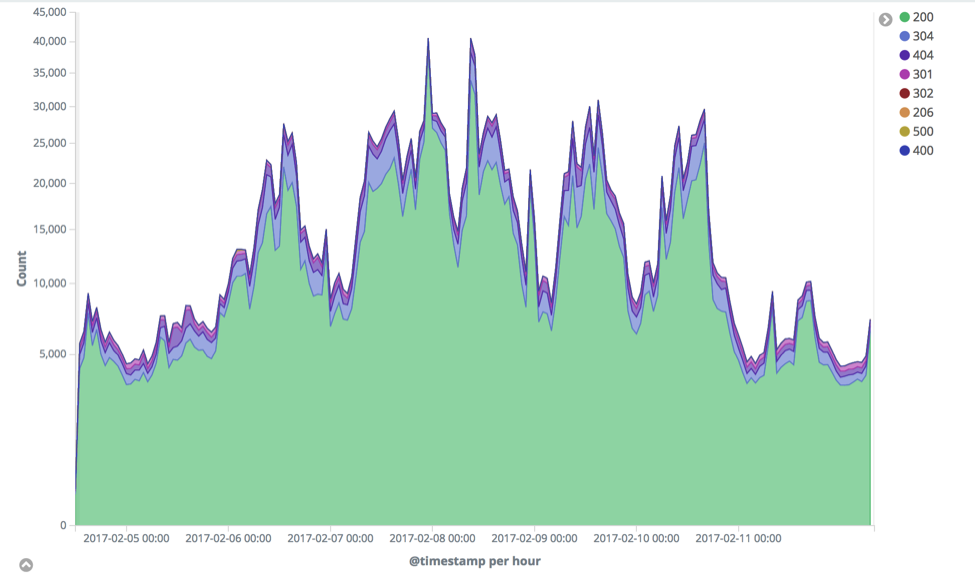
Once simple behaviours are analysed, next steps are often to analyse more complex features. For example, changes in event rates of the different HTTP status codes returned by the webserver can often indicate changes in system behaviour or unusual clients:
This use case is more complex as it involves analysing multiple series concurrently, but it can again be simply configured using the "Multiple Metric Job" wizard:
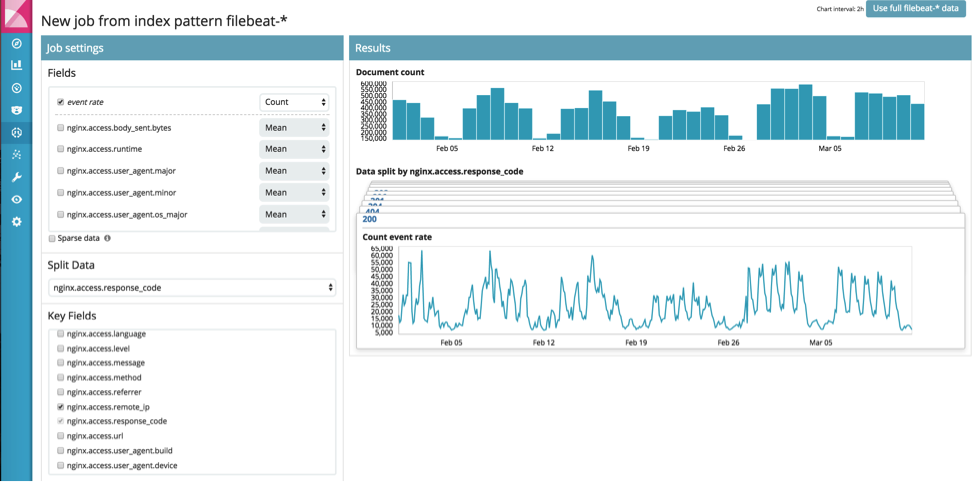
Results show some significant changes in the different response codes:
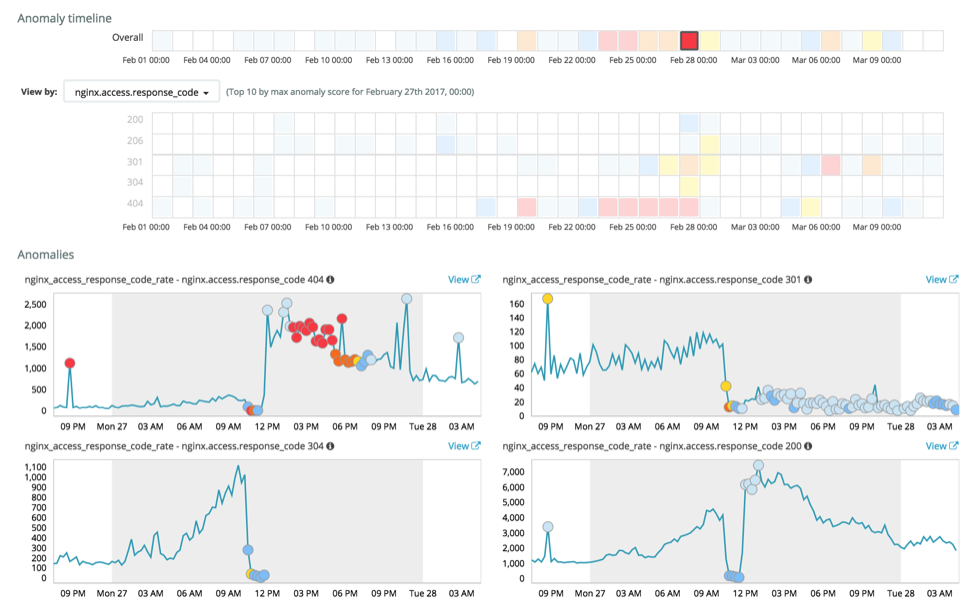
In particular, again on February 27th there is a significant change in behaviour of response_code 404, 301, 306 and 200. Zooming in on 404s show some significant anomalies:
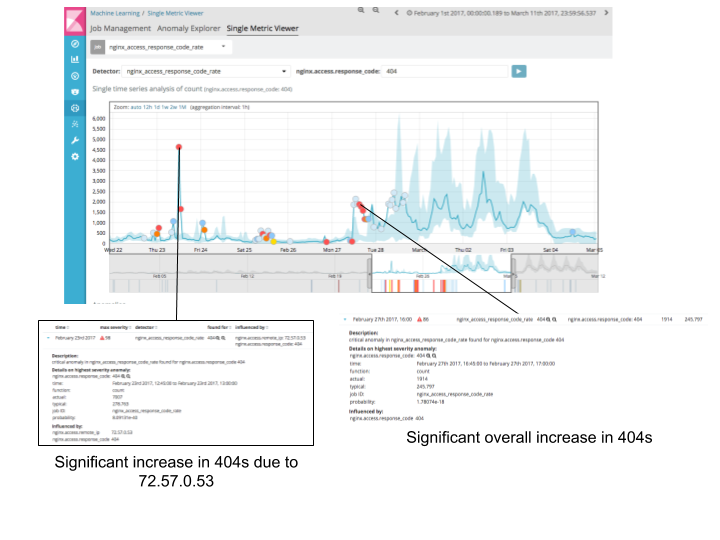
The first highlighted anomaly is attributed to a specific IP address as nginx.access.remote_ip is defined as an influencer (more on this in a later blog). The second highlighted anomaly represents a significant overall change in 404 behaviour.
The increase in 404s on February 27th was again a new insight for the operations team, and represented a large number of dead links that had been introduced by the configuration change.
Use Case 3: Unusual Clients
Website traffic generally consists of a combination of normal usage, scanning by bots and attempted malicious activity. Assuming the majority of clients are normal, we can use population analysis to detect significant attacks or bot activity.
The number of pages a normal user requests in a 5-minute window can be limited by how fast they can manually click website pages. Automated processes can scan 1000s of pages a minute, and attackers can simply flood a site with requests.
There are a number of features we could use to differentiate traffic types, but in the first instance, event rate and number of distinct URL rate by a client can highlight unusual client activity.
In this case, advanced job configuration is used to configure 2 population jobs:
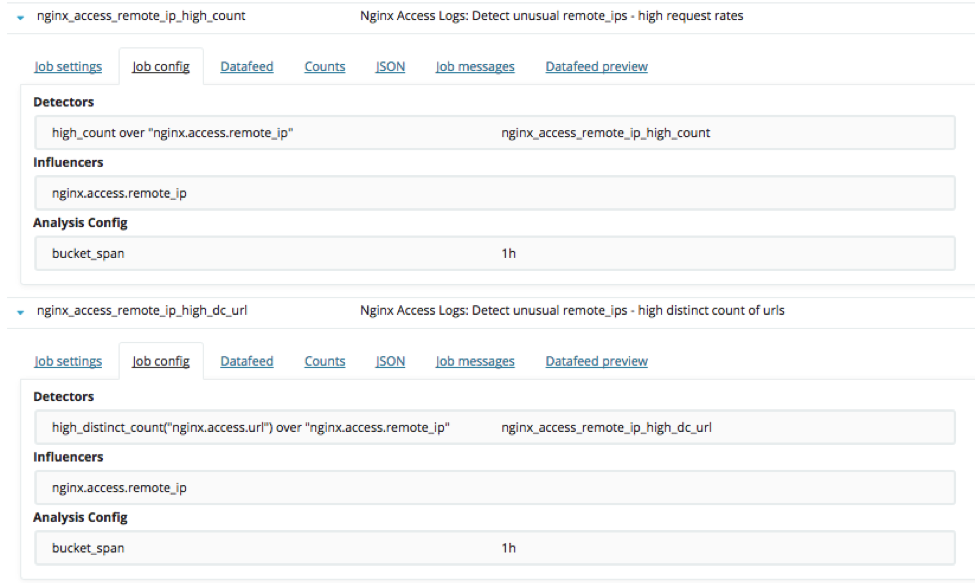
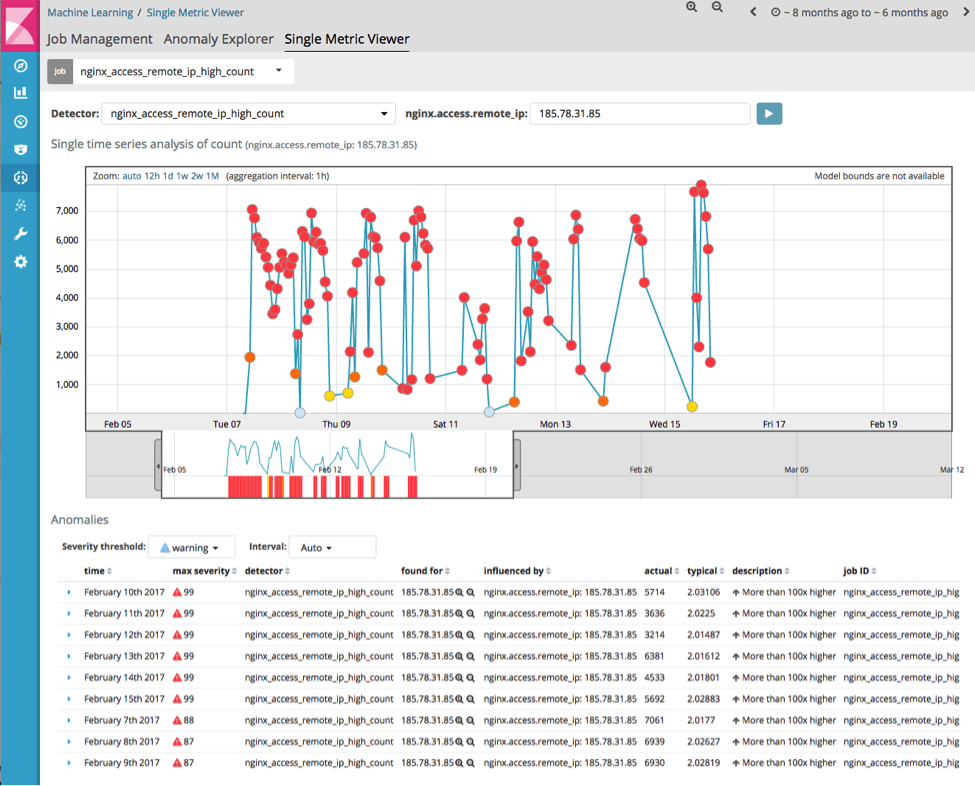
Job 3.1: Detect unusual remote_ips - high request rates
Looking at unusually high event rate for a client (nginxaccessremoteiphigh_count) we get:
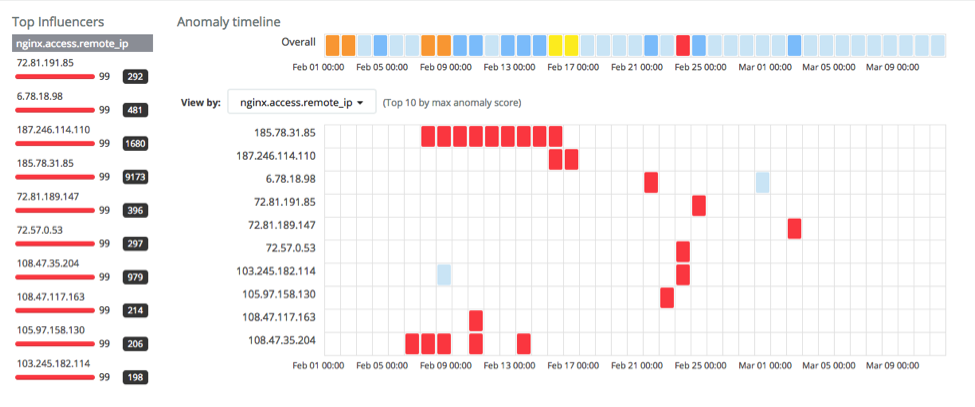
This shows a number of anomalous clients. For example, 185.78.31.85 seems to be anomalous over a long time period:
Drilling into a dashboard that summarises this interaction:
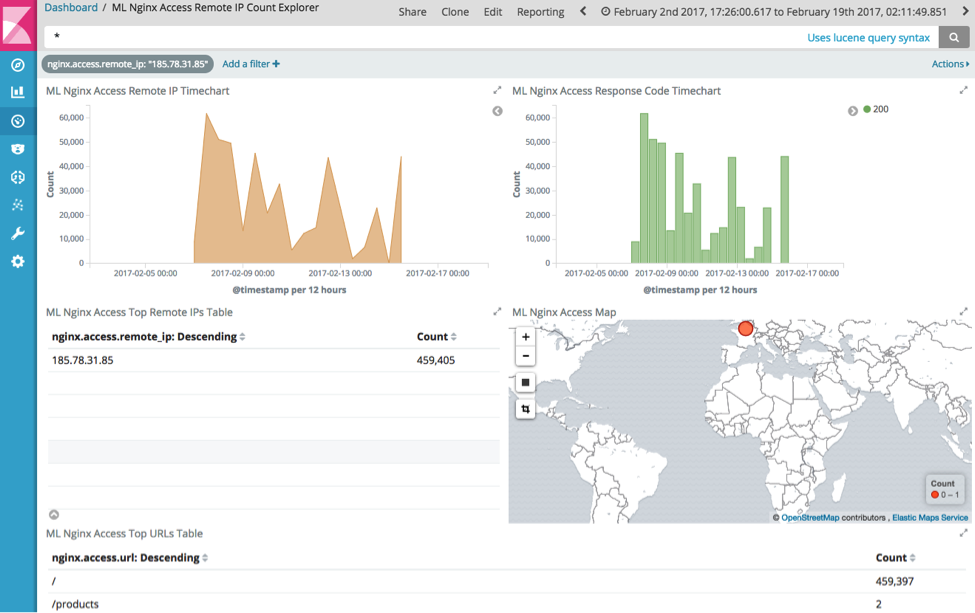
This shows that this IP address has repeatedly hit the root URL (/) an unusually large number of times in a short time period, and that this behaviour continues for several days.
Job 3.2: Detect unusual remote_ips - high request rates
Looking at unusually high distinct count of URL rate for a client (nginxaccessremoteiphighdcurl) we get:
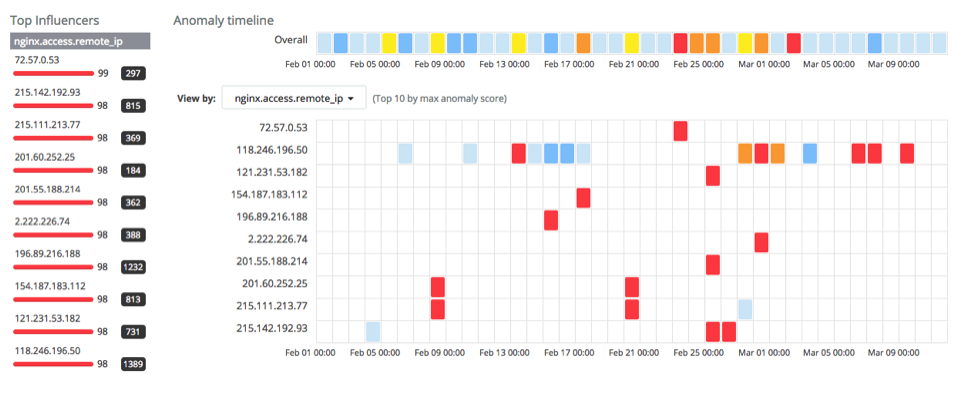
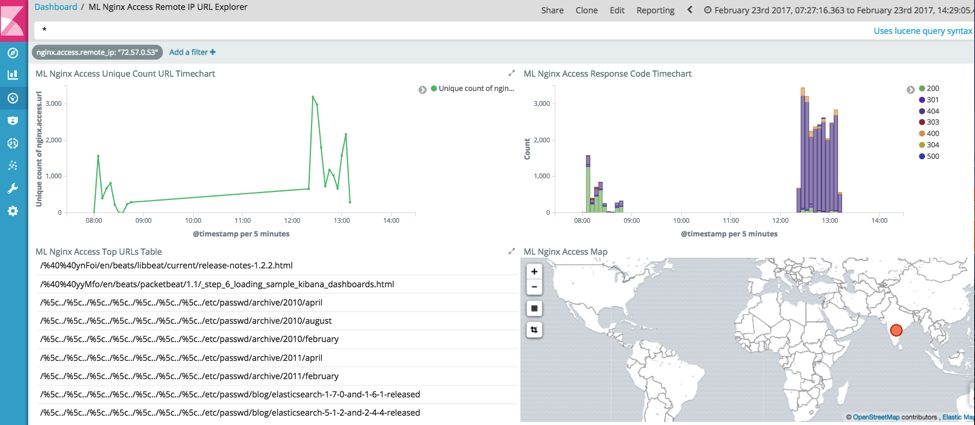
Again, this shows a number of unusual clients. Drilling into 72.57.0.53 shows a client accessing > 12000 distinct URLs in a short period.
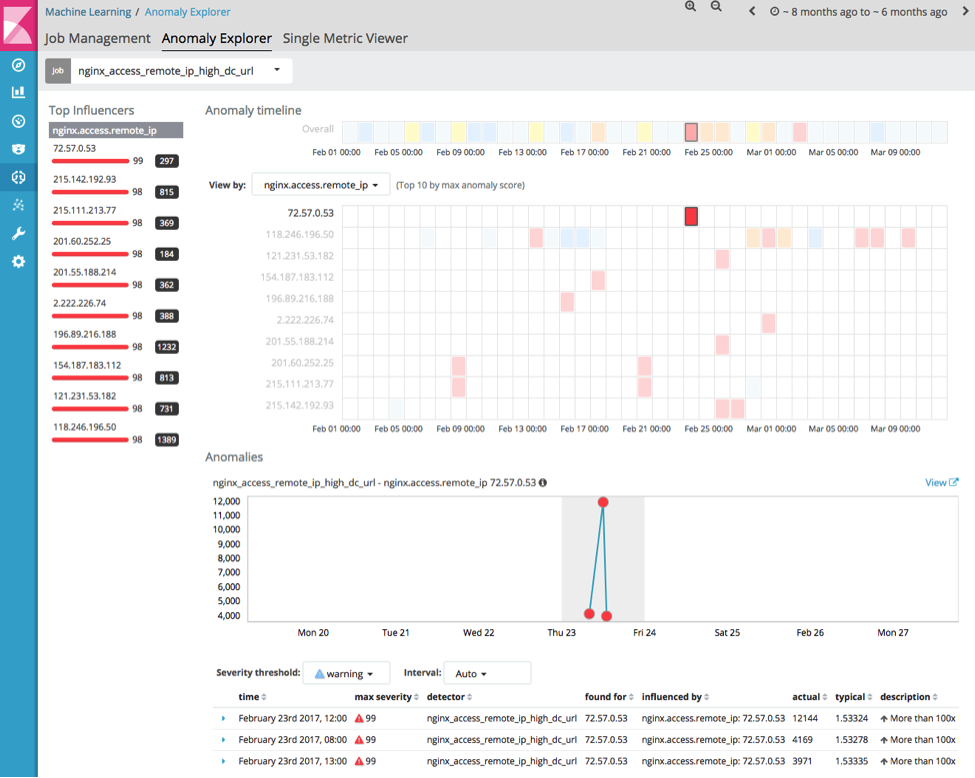
Drilling into a dashboard that summarises this interaction:
This shows this client is attempting a large number of unusual URLs consistent with path traversal types of attack.
Both these jobs provide real-time visibility into unusual clients accessing a website. Web traffic is often skewed by bots and attackers, and differentiating these clients can help administrators understand behaviours such as:
- What types of attack the site is subjected to
- Whether bots are successful accessing the entire site
- What 'normal' usage is
Summary
This blog attempts to show how X-Pack ML can provide insights into website behaviour. In upcoming Elastic Stack releases these types of configurations and dashboards will be available to end users as easily installed packages. This should empower users with proven tested configurations and also show users recommended types of configurations to copy and extend.