Grokking the Linux authorization logs
The authorization logs, which are usually found under either /var/log/auth.log (for Debian based systems) or under /var/log/secure (for RedHat based system), contain lots of interesting security related information like failed and successful SSH logins, sudo attempts, or user and group creation. Let’s have a closer at these logs and see how we can parse and visualize them.
The authorization log files are typically created by the local Syslog server, which routes the AUTH and AUTHPRIV facilities to them. This means that any program running on the system can write to these logs files via the syslog protocol. It also means that the format used by the authorization logs is the syslog format, but the message part of them is different based on which program is writing each particular line.
SSsssH, scanning attacks
Let’s start by looking at a few log lines created by the SSH server:
Feb 20 21:54:44 localhost sshd[3402]: Accepted publickey for vagrant from 10.0.2.2 port 63673 ssh2: RSA 39:33:99:e9:a0:dc:f2:33:a3:e5:72:3b:7c:3a:56:84
Feb 21 00:13:35 localhost sshd[7483]: Accepted password for vagrant from 192.168.33.1 port 58803 ssh2
Feb 21 08:35:22 localhost sshd[5774]: Failed password for root from 116.31.116.24 port 29160 ssh2
Feb 21 19:19:26 localhost sshd[16153]: Failed password for invalid user aurelien from 142.0.45.14 port 52772 ssh2
Feb 21 21:56:12 localhost sshd[3430]: Invalid user test from 10.0.2.2
As you can see, the log format is not super consistent, but with a little bit of grokking we can parse it into fields. The following pattern will match any of the first four lines:
%{SYSLOGTIMESTAMP:system.auth.timestamp} %{SYSLOGHOST:system.auth.hostname} sshd(?:\\[%{POSINT:system.auth.pid}\\])?: %{DATA:system.auth.ssh.event} %{DATA:system.auth.ssh.method} for (invalid user )?%{DATA:system.auth.user} from %{IPORHOST:system.auth.ip} port %{NUMBER:system.auth.port} ssh2(: %{GREEDYDATA:system.auth.ssh.signature})?
While this pattern is matching the last line from the sample above:
%{SYSLOGTIMESTAMP:system.auth.timestamp} %{SYSLOGHOST:system.auth.hostname} sshd(?:\\[%{POSINT:system.auth.pid}\\])?: %{DATA:system.auth.ssh.event} user %{DATA:system.auth.user} from %{IPORHOST:system.auth.ip}
If you're doing this on a machine that has the SSH server open to the Internet and listening on the default port, you are likely seeing a ton of failed attempts. For example, here is from a single random server:
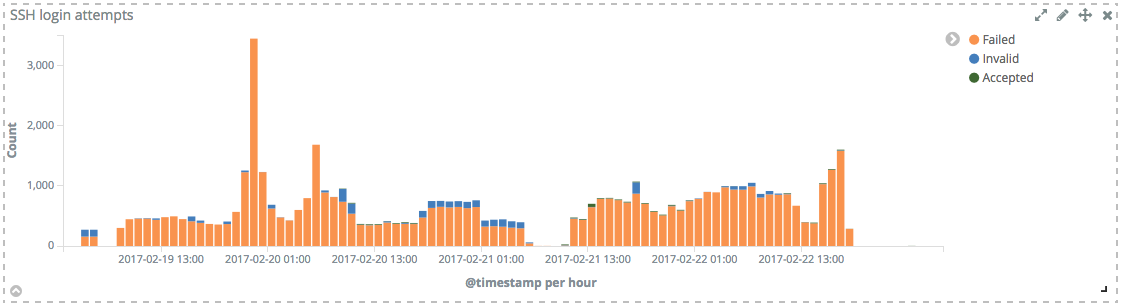
As you can see, there's a continuous stream of scanning and brute force attacks, creating over 3000 failed login attempts per hour to this server. Since we've got the IP addresses of each of these failed attempts, we can use GeoIP information to put them on a map:
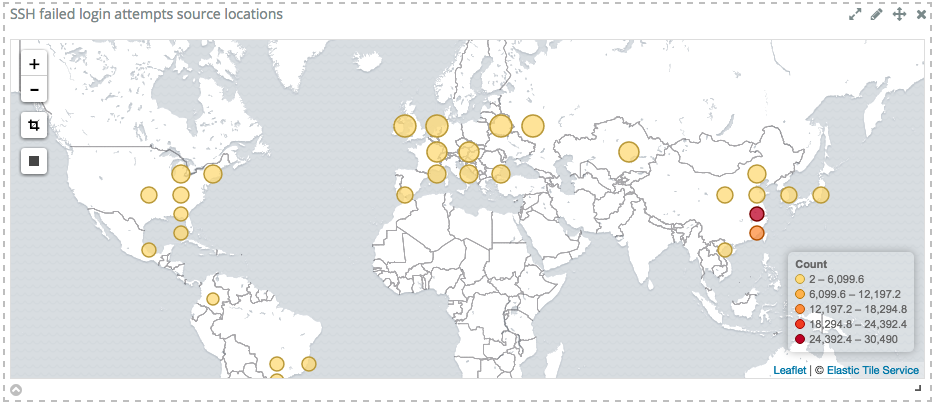
A large number of attempts are originating from China, but there's actually a fair amount coming from US and Europe as well.
Typically such a brute force attack would attempt try a lot of username and password combinations. The passwords tried are not in the logs, but we can look at what are the most commonly tried usernames:
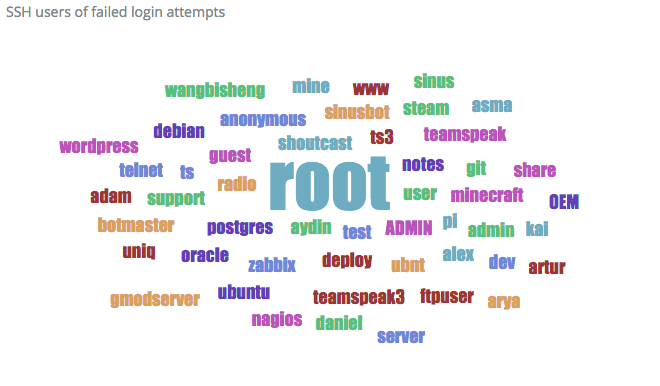
As expected, root is the most targeted account. After that, there is a long list of usernames that tend to be common on Linux systems, like ubuntu, wordpress, postgres, oracle, admin, and common first names like alex, daniel, andrew, and so on.
While these attacks might seem basic and with low chances of succeeding, remember that it is enough for one user on the system to have a weak password and it will likely be exploited eventually. Methods of mitigating this risk include disabling password authentication for SSH, disabling logging in as root over SSH, and changing the default SSH port.
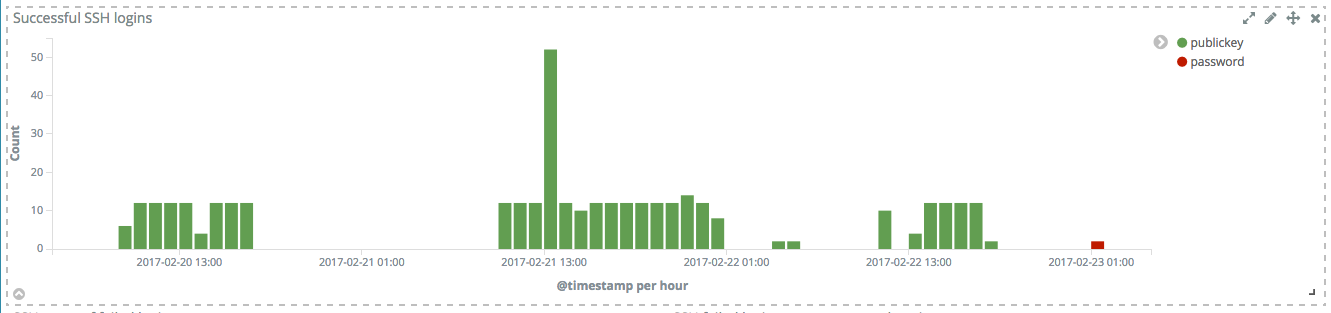
Speaking of password authentication, after parsing the logs this way, it is easy to check whether there were any successful logins using passwords when you expect only logins using private keys:
Sudo make me a sandwich
Another set of logs that you might be interested in are the logs created by the sudo command. Any command executed with sudo, as well as failed attempts, are logged to the authorization logs. Here are some samples:
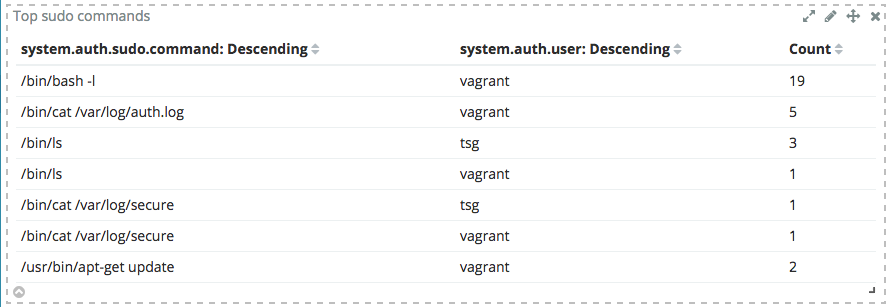
Feb 23 00:08:48 localhost sudo: vagrant : TTY=pts/1 ; PWD=/home/vagrant ; USER=root ; COMMAND=/bin/cat /var/log/secure
Feb 24 00:13:02 precise32 sudo:      tsg : user NOT in sudoers ; TTY=pts/1 ; PWD=/home/vagrant ; USER=root ; COMMAND=/bin/ls
The following Grok pattern is able to match both the successful sudo commands and the failed ones. In case of errors, the error is stored in the system.auth.sudo.error field.
"%{SYSLOGTIMESTAMP:system.auth.timestamp} %{SYSLOGHOST:system.auth.hostname} sudo(?:\\[%{POSINT:system.auth.pid}\\])?: \\s*%{DATA:system.auth.user} :( %{DATA:system.auth.sudo.error} ;)? TTY=%{DATA:system.auth.sudo.tty} ; PWD=%{DATA:system.auth.sudo.pwd} ; USER=%{DATA:system.auth.sudo.user} ; COMMAND=%{GREEDYDATA:system.auth.sudo.command}"
Armed with this, we can easily see which are the most common commands executed over sudo:
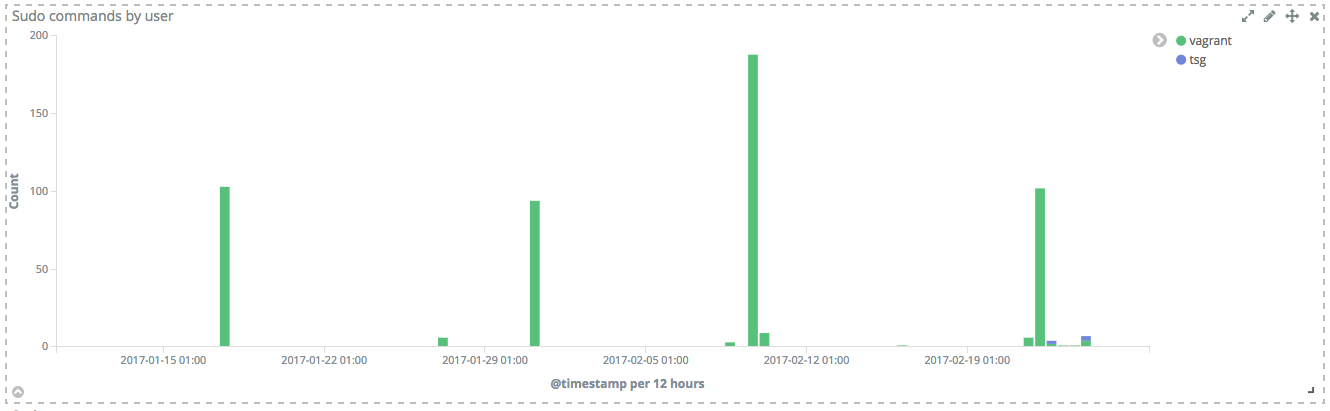
Which users execute commands with sudo, and when:
And what errors were reported by sudo:
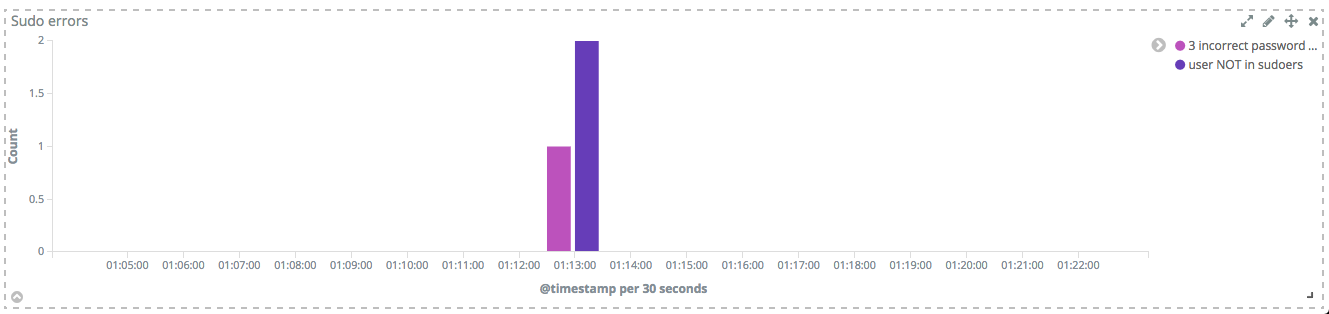
This data can be valuable for detecting security breaches before they escalate, since if an attacker gets hold of an unprivileged account, it's likely they will try sudo first to get superuser rights.
No users, no problems
Another thing to keep an eye on, in the authorization logs, is the creation of new users and groups. Users are often created automatically when installing packages, and it's important to check that they are created with the right privileges.
This is what the log lines created by the adduser and addgroup programs look like:
Feb 22 11:47:05 localhost groupadd[6991]: new group: name=apache, GID=48
Feb 22 11:47:05 localhost useradd[6995]: new user: name=apache, UID=48, GID=48, home=/usr/share/httpd, shell=/sbin/nologin
And here are the Grok patterns for them:
%{SYSLOGTIMESTAMP:system.auth.timestamp} %{SYSLOGHOST:system.auth.hostname} groupadd(?:\\[%{POSINT:system.auth.pid}\\])?: new group: name=%{DATA:system.auth.groupadd.name}, GID=%{NUMBER:system.auth.groupadd.gid}
%{SYSLOGTIMESTAMP:system.auth.timestamp} %{SYSLOGHOST:system.auth.hostname} useradd(?:\\[%{POSINT:system.auth.pid}\\])?: new user: name=%{DATA:system.auth.useradd.name}, UID=%{NUMBER:system.auth.useradd.uid}, GID=%{NUMBER:system.auth.useradd.gid}, home=%{DATA:system.auth.useradd.home}, shell=%{DATA:system.auth.useradd.shell}$
With this, you can get an overview of the new users and when they were created:
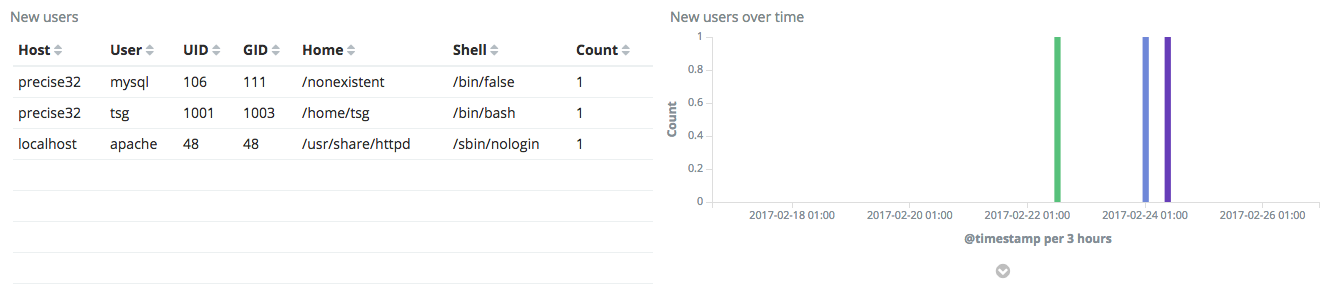
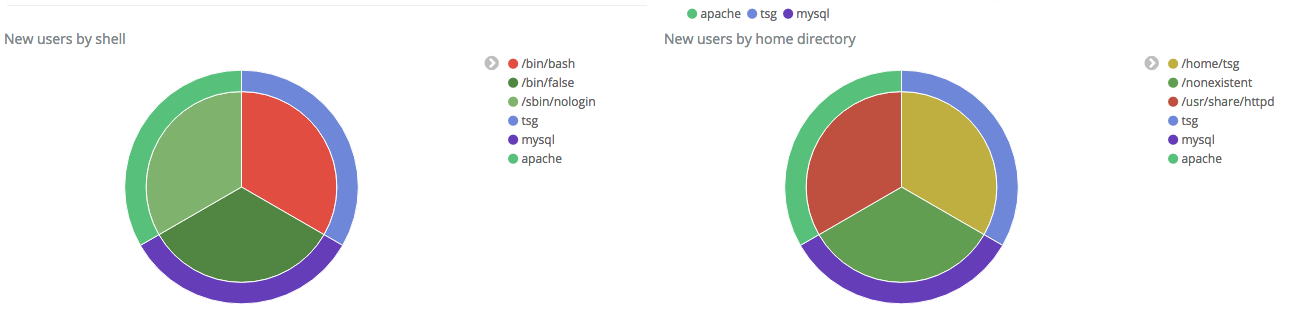
Besides checking that no unexpected users have been created, it's important here to check that users created for particular processes (e.g. mysql or www-data) can't open a shell by simply logging in. This means that the shell for them should be /bin/false or /sbin/nologin. The same applies for the home directories. These pie-charts make that visual inspection easy:
Similar visualizations can be done for the new groups created.
Teaser: do all of this with one CLI command
We've seen in this blog post what types of data you can find in the authorization logs, how to parse them using Grok patterns, and we've seen several Kibana visualizations that make exploring and monitoring this data easy. But putting this all together is a fair amount of work that many of the Elastic stack users have to re-discover individually. That's why we've been recently working on what we call Filebeat "modules", which we plan to release with the next version, and which will simplify the collection, parsing, indexing, and visualizing for common log formats.
For example, everything that we've seen in this blog post will be possible with a single CLI command:
filebeat -e -setup -modules=system
This will collect the logs, install Ingest Node pipelines to parse them, install the required Elasticsearch mapping templates, and install Kibana dashboards to visualize them. Neat? Watch out for the next Beats release.