How to leverage RSS feeds to inform the possibilities with Elastic Stack


 Share on Twitter
Share on Twitter

 Share on LinkedIn
Share on LinkedIn

 Share on Facebook
Share on Facebook

 Share by Email
Share by Email

 Print this page
Print
As Elasticians, we have the opportunity to observe various Elastic use cases. As former SOC analysts, we find ourselves drawn to the security use cases. We are always looking for ways to leverage the Elastic Stack to add value to the Elastic and cybersecurity community. We are constantly researching — sifting through news articles, white papers, databases, etc. We realized that we were spending a lot of time visiting the same sites and needed to consolidate the feeds (duh!).
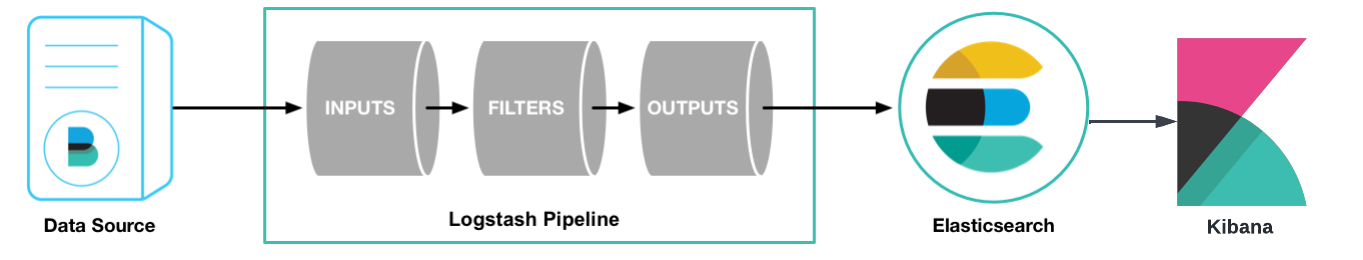
Below, we’ll break down how we used RSS feeds, Logstash, Elasticsearch, and Kibana to ingest, consolidate, aggregate, visualize, and search cybersecurity content of interest — and how you can do the same.
[Related article: Cybersecurity is a data challenge, and better search technology is key to improving visibility and action]
RSS feeds
There are several ways to consolidate RSS feeds. Many feeders and aggregators are subscription based, but we feel that content curation should be free. Our initial impulse was, “let’s write a Python script, send the data to Logstash, watch it flow into Elasticsearch, and observe via Kibana…” As we started planning and researching, we encountered a solution that would allow us to bypass the Python script entirely: the RSS input plugin for the Logstash pipeline. At that point, we had identified all of the necessary ingredients to start building an Elastic-based Open Source Intelligence Tool (OSINT).
Our project’s name is A Quick RSS Cybersecurity News Feed. These are its components:
- RSS Feeds
- Logstash configuration(s)
- Elasticsearch configuration(s)
- Kibana Visualizations and Dashboards
These RSS feeds are currently included:
- Dark Reading
- Zero Day Initiative
- Bleeping Computer
- The Hacker News
- The Register
- Krebs on Security
- US-CERT
- Cisco Talos
- KnowBe4
- Threatpost
- Malwarebytes
- Microsoft Security
Logstash
Here is an overview of our Logstash pipeline and its configuration.
Input
RSS input plugin: Within the plugins input section, we added the following:
- id: A unique ID to the plugin configuration. This is particularly useful when you have two or more plugins of the same type. If you have multiple RSS inputs, adding a named ID will make it easier to monitor Logstash. We also set up our ids with clear, distinct names, all of which we found to be especially helpful during troubleshooting and testing.
- url: RSS/Atom feed URL. We chose to use multiple RSS inputs as shown in the image above.
- interval: Interval to run the command. The value is in seconds. We opted to set the interval to 3600 seconds (1 hour); our decision was purely based on preference.
- tags: Add any number of arbitrary tags to your event. We are using tags for Kibana filtering purposes. Again, we wanted our tags to be succinct so that we could clearly differentiate the news feeds we chose.
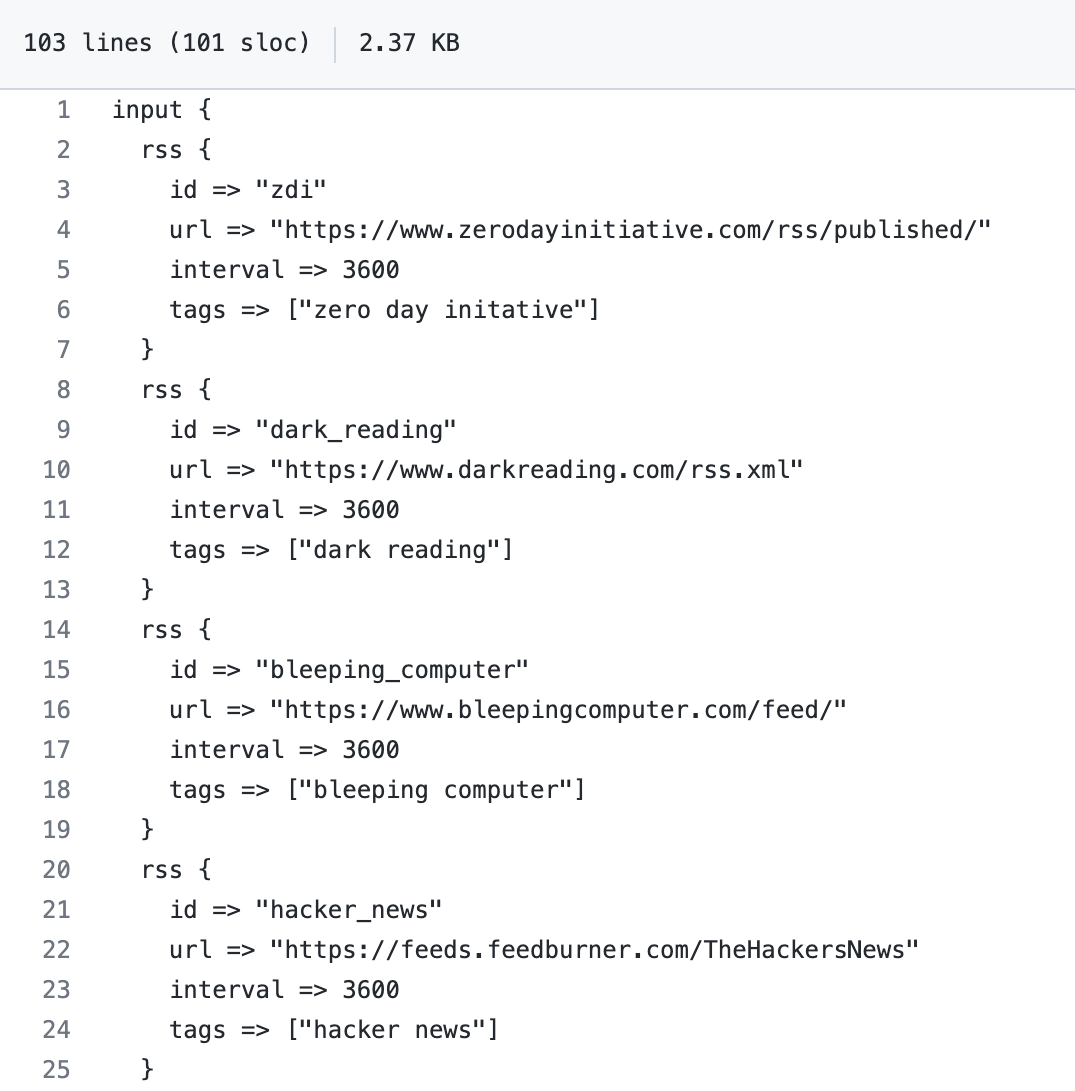
Note: The RSS plugin needs to be installed as it does not come as part of the logstash package. It can be installed by running bin/logstash-plugin install logstash-input-rss.
Filter
We quickly determined that Logstash filtering would be necessary in order to avoid ingesting duplicate documents. Logstash would pull from the RSS feeds every hour, as per our configuration. We would sporadically get one new document and several duplicates. We would be like, “Cool! A document referencing a Zero Day!” and then an hour later we were like, “Sweet! This is the same article we saw an hour ago!” It was ugly, and we knew it would negatively impact our analysis and research as we moved forward. We needed to find a way to deduplicate.
We initially wrote a Python script for data deduplication, which worked but seemed excessive. Further research led us to Alexander Marquardt’s blog, Deduplicating documents in Elasticsearch, which in turn led us to Elastic’s fingerprint filter plugin — a much simpler and equally effective solution.
We use the fingerprint filter plugin to create consistent document ids when events are inserted into Elasticsearch. This approach means that existing documents can be updated instead of creating new documents.
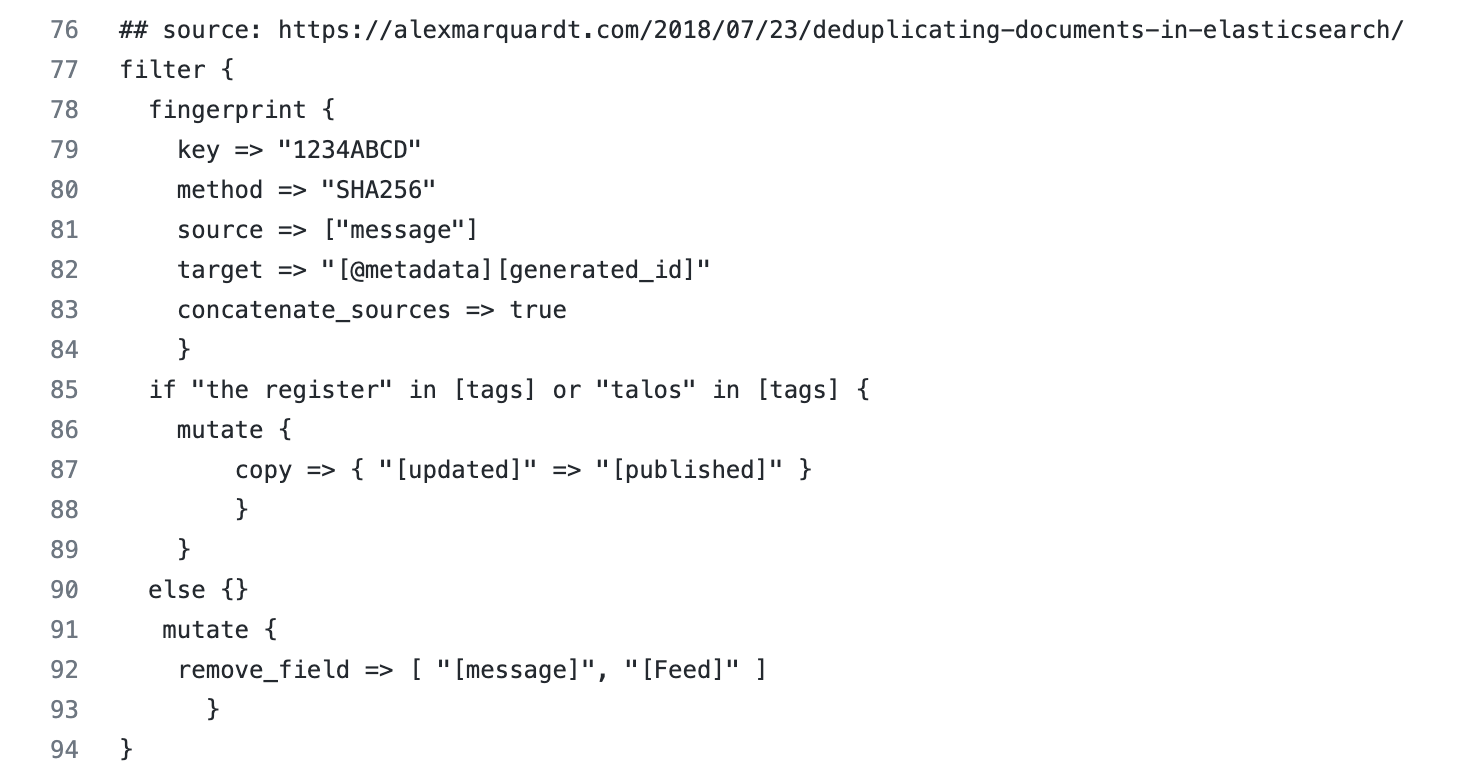
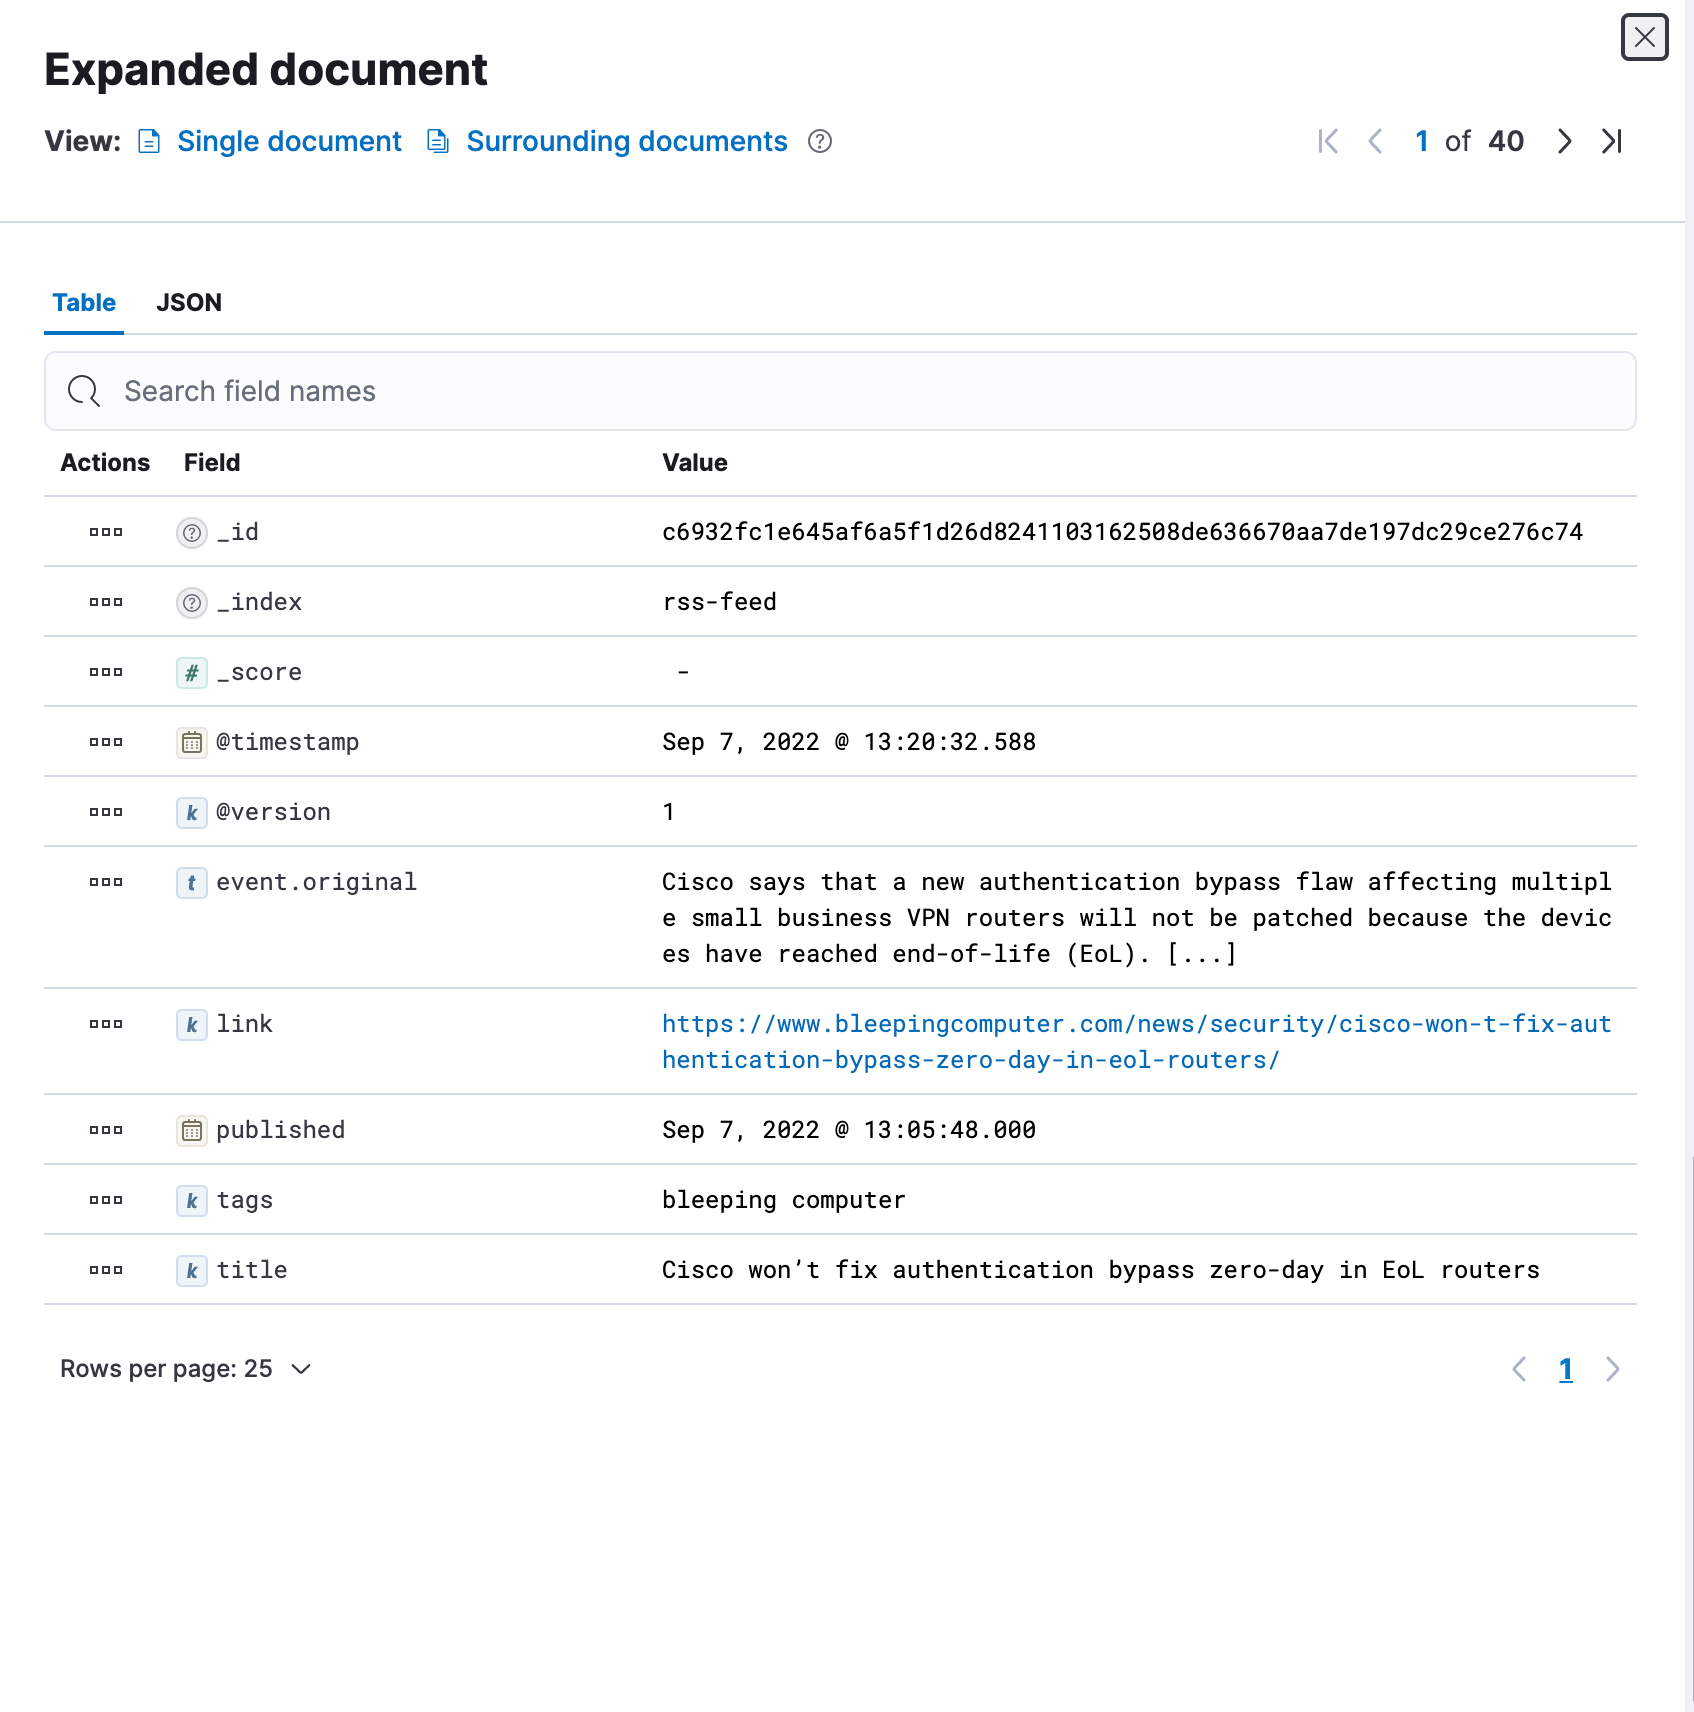
The plugin references the message field (displayed as event.original in the image below) as the source. When the document is ingested, a SHA-256 hash is generated and populates the document _id . If the same message is subsequently pulled via the RSS feed, instead of creating a new document it updates the matching document.
One drawback we found is that there are outlier scenarios where a duplicate message is not identified as a duplicate because of slight variations. The appearance of a definite article like “the” can cause a new message to be interpreted as different, resulting in a new document being created. We are currently working on testing the title field to replace the message field in hopes of remediating the outliers.
Our project also contains a section dedicated to issues we encounter as we enhance and update this project.
- key : The fingerprint method to use. Value can be any of the following: SHA1, SHA256, SHA384, SHA512, MD5, MURMUR3, MURMUR3_128, IPV4_NETWORK, UUID, PUNCTUATION. We simply opted to use Alexander Marquardt’s example key, since there isn’t a default value and it is a bit arbitrary.
- method: We chose to use SHA-256 because it is often associated with file, message, and data integrity verification. If the message changes, the hash changes; if the message is unaltered, then the hash is unaltered.
- source: The name(s) of the source field(s) whose contents will be used to create the fingerprint. We opted to use the message field; the data populated in the message field is essentially a summary of the article. We figured the message field was a safe bet, but we are testing additional fields due to the aforementioned outliers.
- target: The name of the field where the generated fingerprint will be stored. We will chat about this more in the output section, but this is where the SHA-256 hash is sent and it acts as our document _id to alleviate the mass duplication we encountered during our initial testing phase.
- concatenate_sources: When set to true and the method isn’t UUID or PUNCTUATION, the plugin concatenates the names and values of all fields given in the source option into one string (like the old checksum filter) before doing the fingerprint computation. We needed this. We tried it without and we got duplicates.
- mutate (copy): Copy an existing field to another field. We noticed a couple of RSS feeds were publishing dates in a field called updated versus published. We also recognized the majority were sending publishing date values to the published field. The majority won and we decided to copy the values in the updated to published. We wanted to keep our designated time field consistent for visualizations and dashboards.
- mutate (remove field): If this filter is successful, remove arbitrary fields from this event. We opted to use this and it was purely a creative decision (ha!). We aren’t huge fans of keeping excess fields hanging around. We are Elasticians and a lot of our job is data validation and ensuring users optimize whenever and wherever possible. The Feed fields redirected us to unreadable content and the message field was inherently copied to the event.original (per ECS) so it was essentially duplicated values (aka unnecessary).
- conditionals (if and else): We noticed Cisco Talos and The Register were sending their publication dates to the field update as opposed to published; they are outliers because the majority sends publication dates to published so we created a conditional leading to a consistent time field.
Output
For the output plugin we used the stdout, dots codec, and elasticsearch plugins.
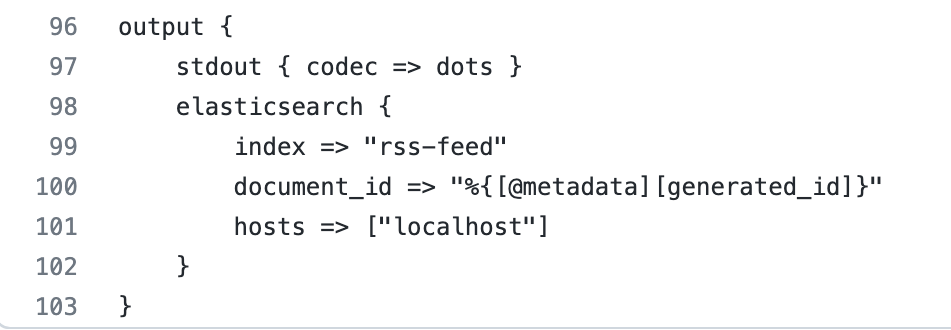
- stdout(dots codec) : This codec generates a dot(.) to represent each Event it processes. This is typically used with stdout output to provide feedback on the terminal. The stdout was incredibly useful while we were troubleshooting, but we rely on it less now that we are using the pipelines.yml versus passing the configuration as a file via command line.
- elasticsearch : The Elasticsearch output plugin can store both time series datasets and non-time series data in Elasticsearch. We are using it to search our cybersecurity news contents.
- index : The index to write events to. We chose to name our index rss-feed because we like to keep things as simple and descriptive as possible.
- document_id : The document ID for the index. Useful for overwriting existing entries in Elasticsearch with the same ID. We needed to use the document_id because this is where the SHA-256 hash value is set from the fingerprint filter plugin to prevent duplicate documents.
- hosts : Sets the host(s) of the remote instance. We utilized this setting to route our data to our elasticsearch instance.
Elasticsearch
We are sending all of the RSS documents to Elasticsearch, which gives us the opportunity to perform near real time search and analytics. During the initial testing phase, we leveraged Elasticsearch’s Dynamic Mapping capability so we could start exploring data quickly. The RSS data doesn’t generate a lot of fields, and the field names are relatively consistent, so we weren’t too worried about mapping explosions or generally being overwhelmed by an excessive number of fields.
When we reviewed the data along with the fields we found, as expected, string fields that were assigned multiple data types: text and keyword. As a result, we were seeing two fields with different names that contained the same data:
author: John Smith
author.keyword: John Smith
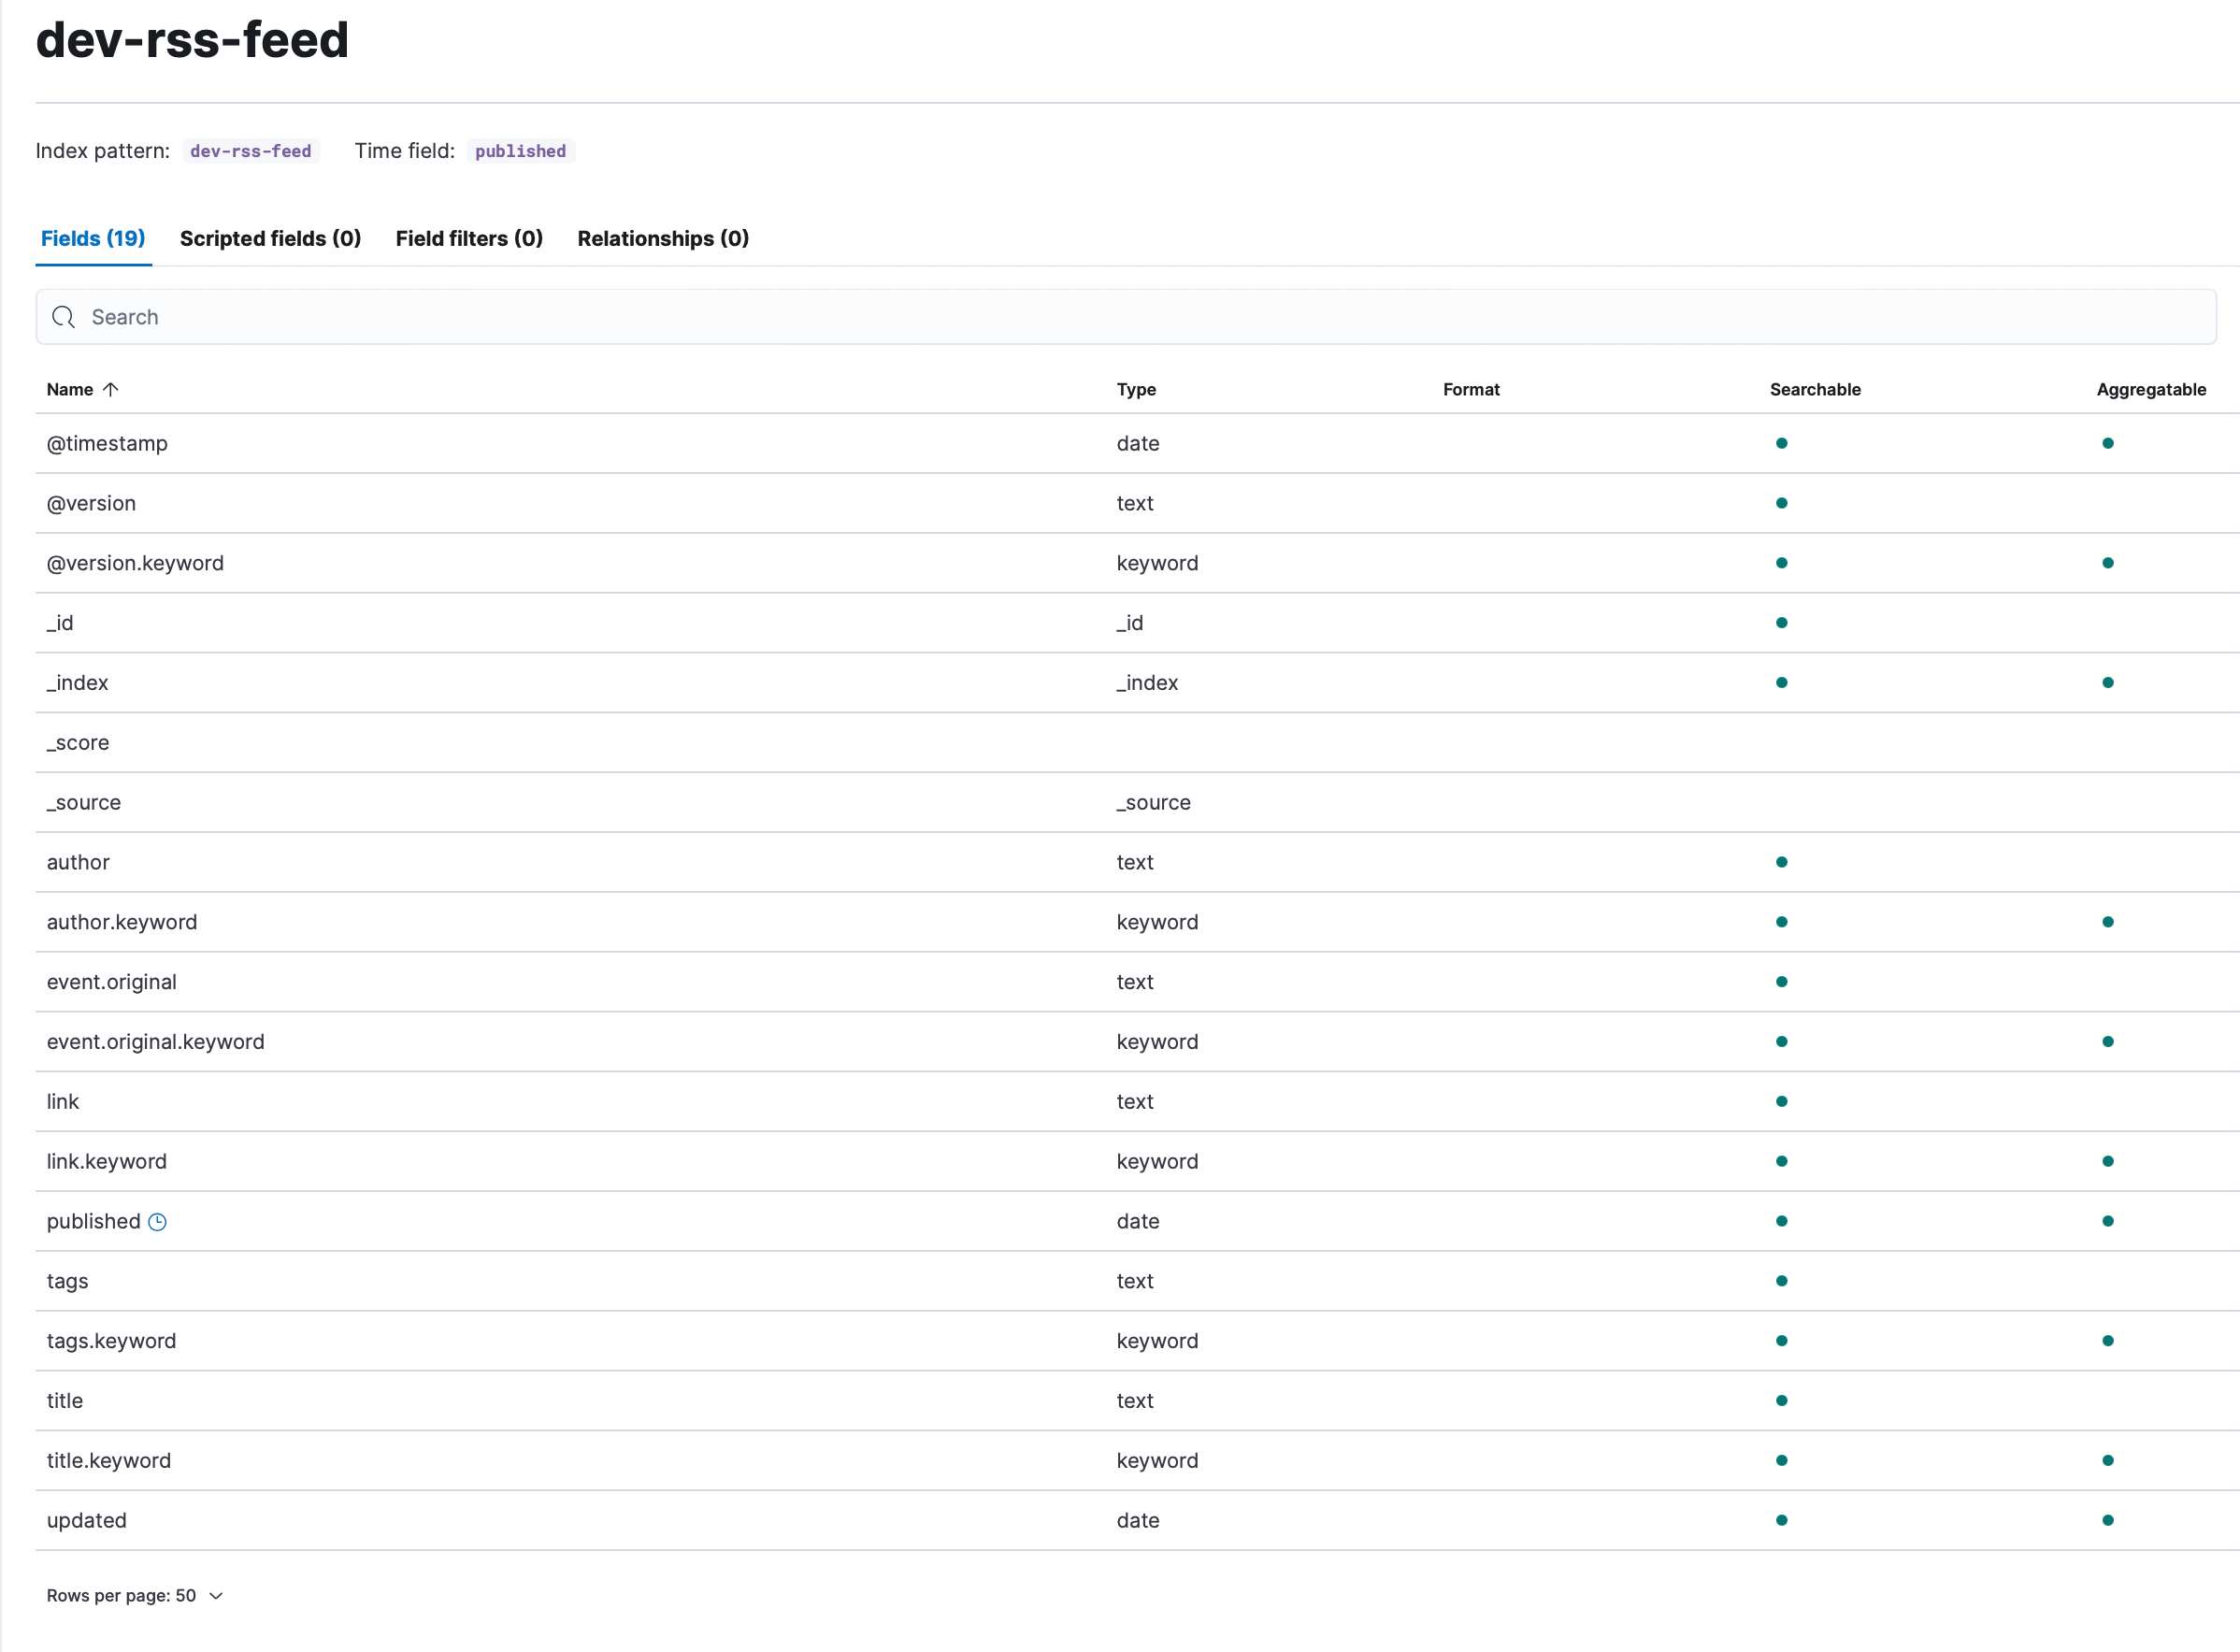
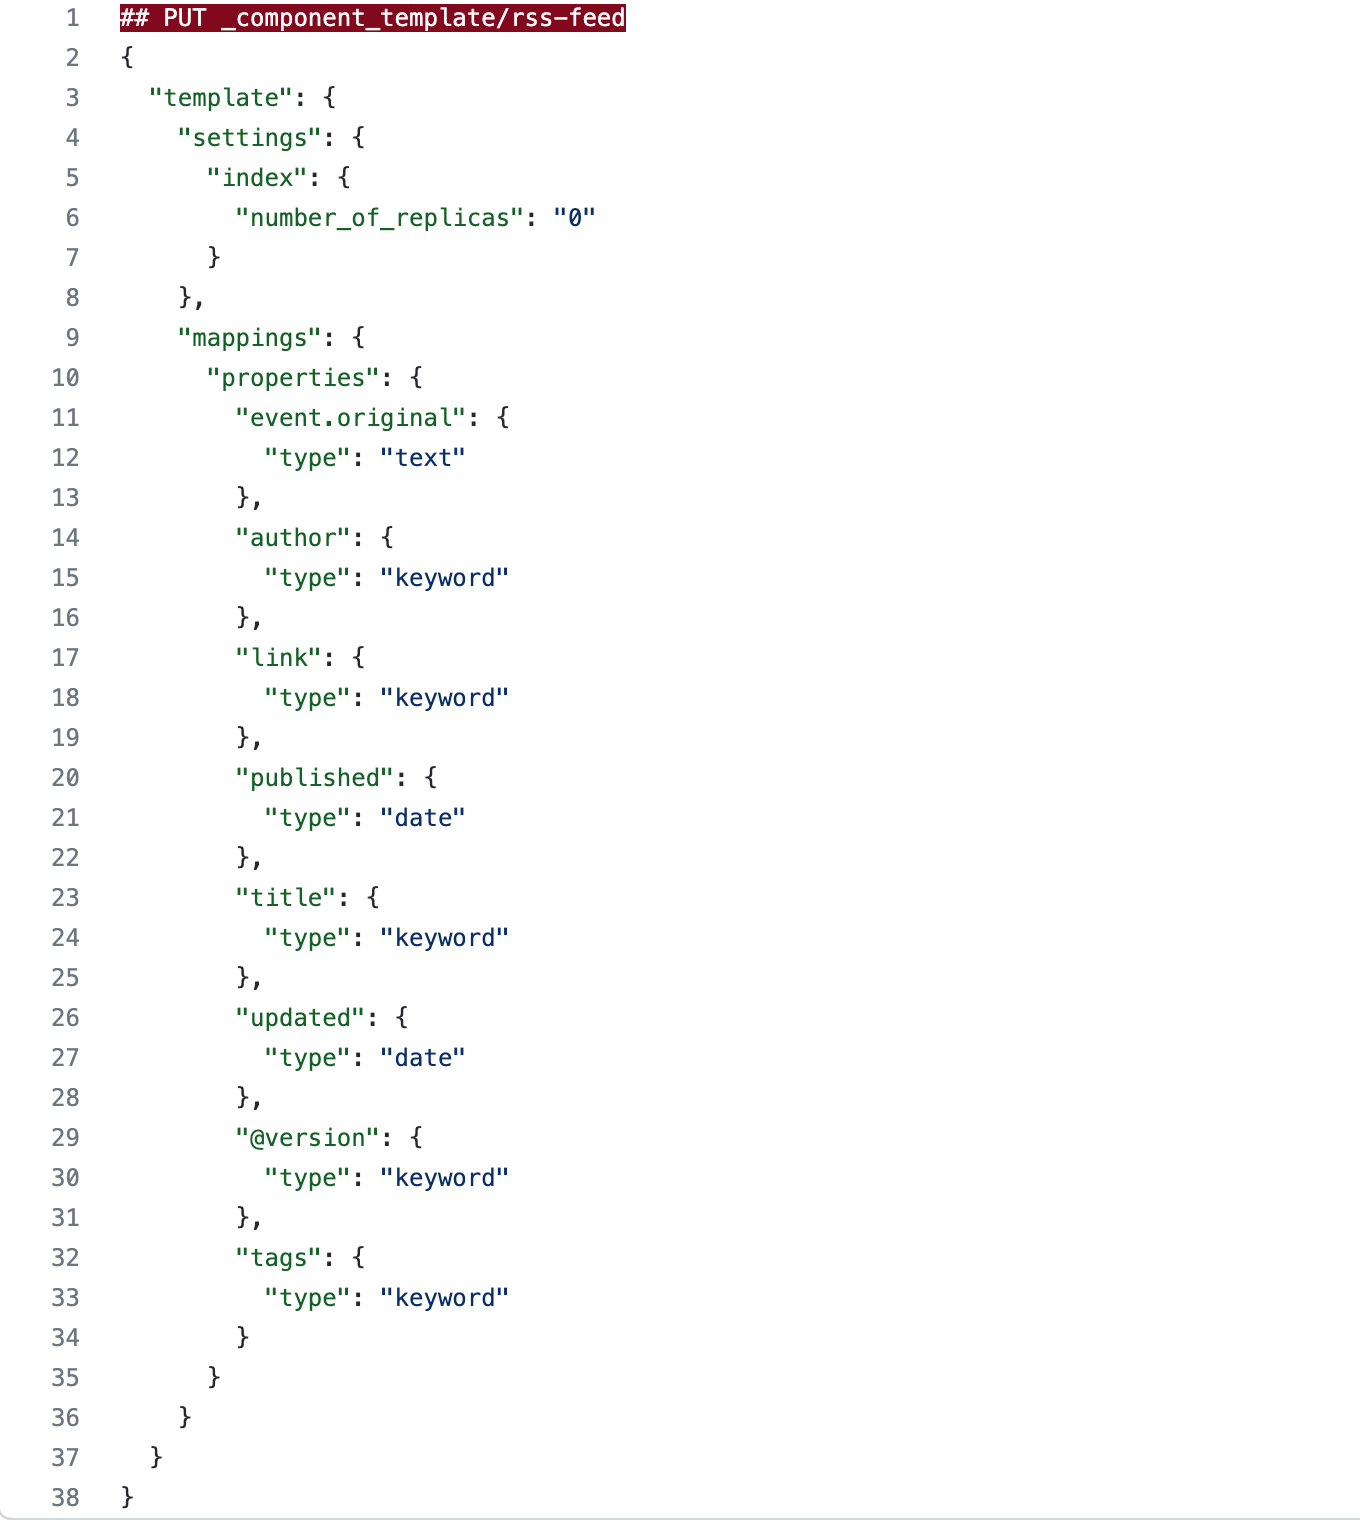
We created component templates and index templates to control the creation of duplicate fields with multiple data types. We used component templates to explicitly create the mappings because component templates are modular and can be reused for various index templates. We could have set the mappings via index templates only because it isn’t likely that we will ever use these specific mappings for any additional datasets. We opted to add the component templates for overall efficiency and optimization.
We won’t bore you with too many details, but would like to highlight a few points:
- We used the keyword data type for any fields we wanted to 1) use for aggregations and 2) we didn’t necessarily feel required full-text search capability.
- We did alter event.original from its inherited keyword data type, as defined and set by the Elastic Common Schema (ECS). We wanted to leverage full-text search via the event.original field to create certain filters. As discussed above, we had opted to remove the message field, which would have given us the ability to perform full-text search inherently. Our decision was purely based on personal preference.
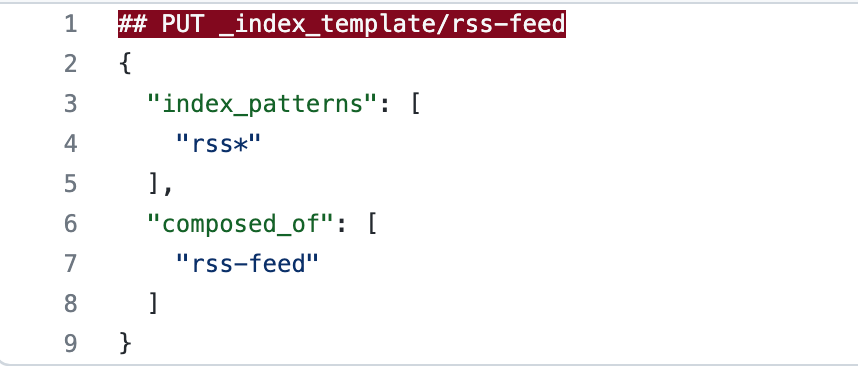
The index template we created is incredibly basic. We set index patterns to rss* so any indices we create (in this case, we created rss-feed as seen in the index setting amid the Logstash output (index => rss-feed)) with the prefix rss will inherit the settings associated with the component template and index template we created.
With the index templates and component templates, we were able to effectively drop the six fields ending in .keyword and map the data to more effective types for our use case.
Kibana
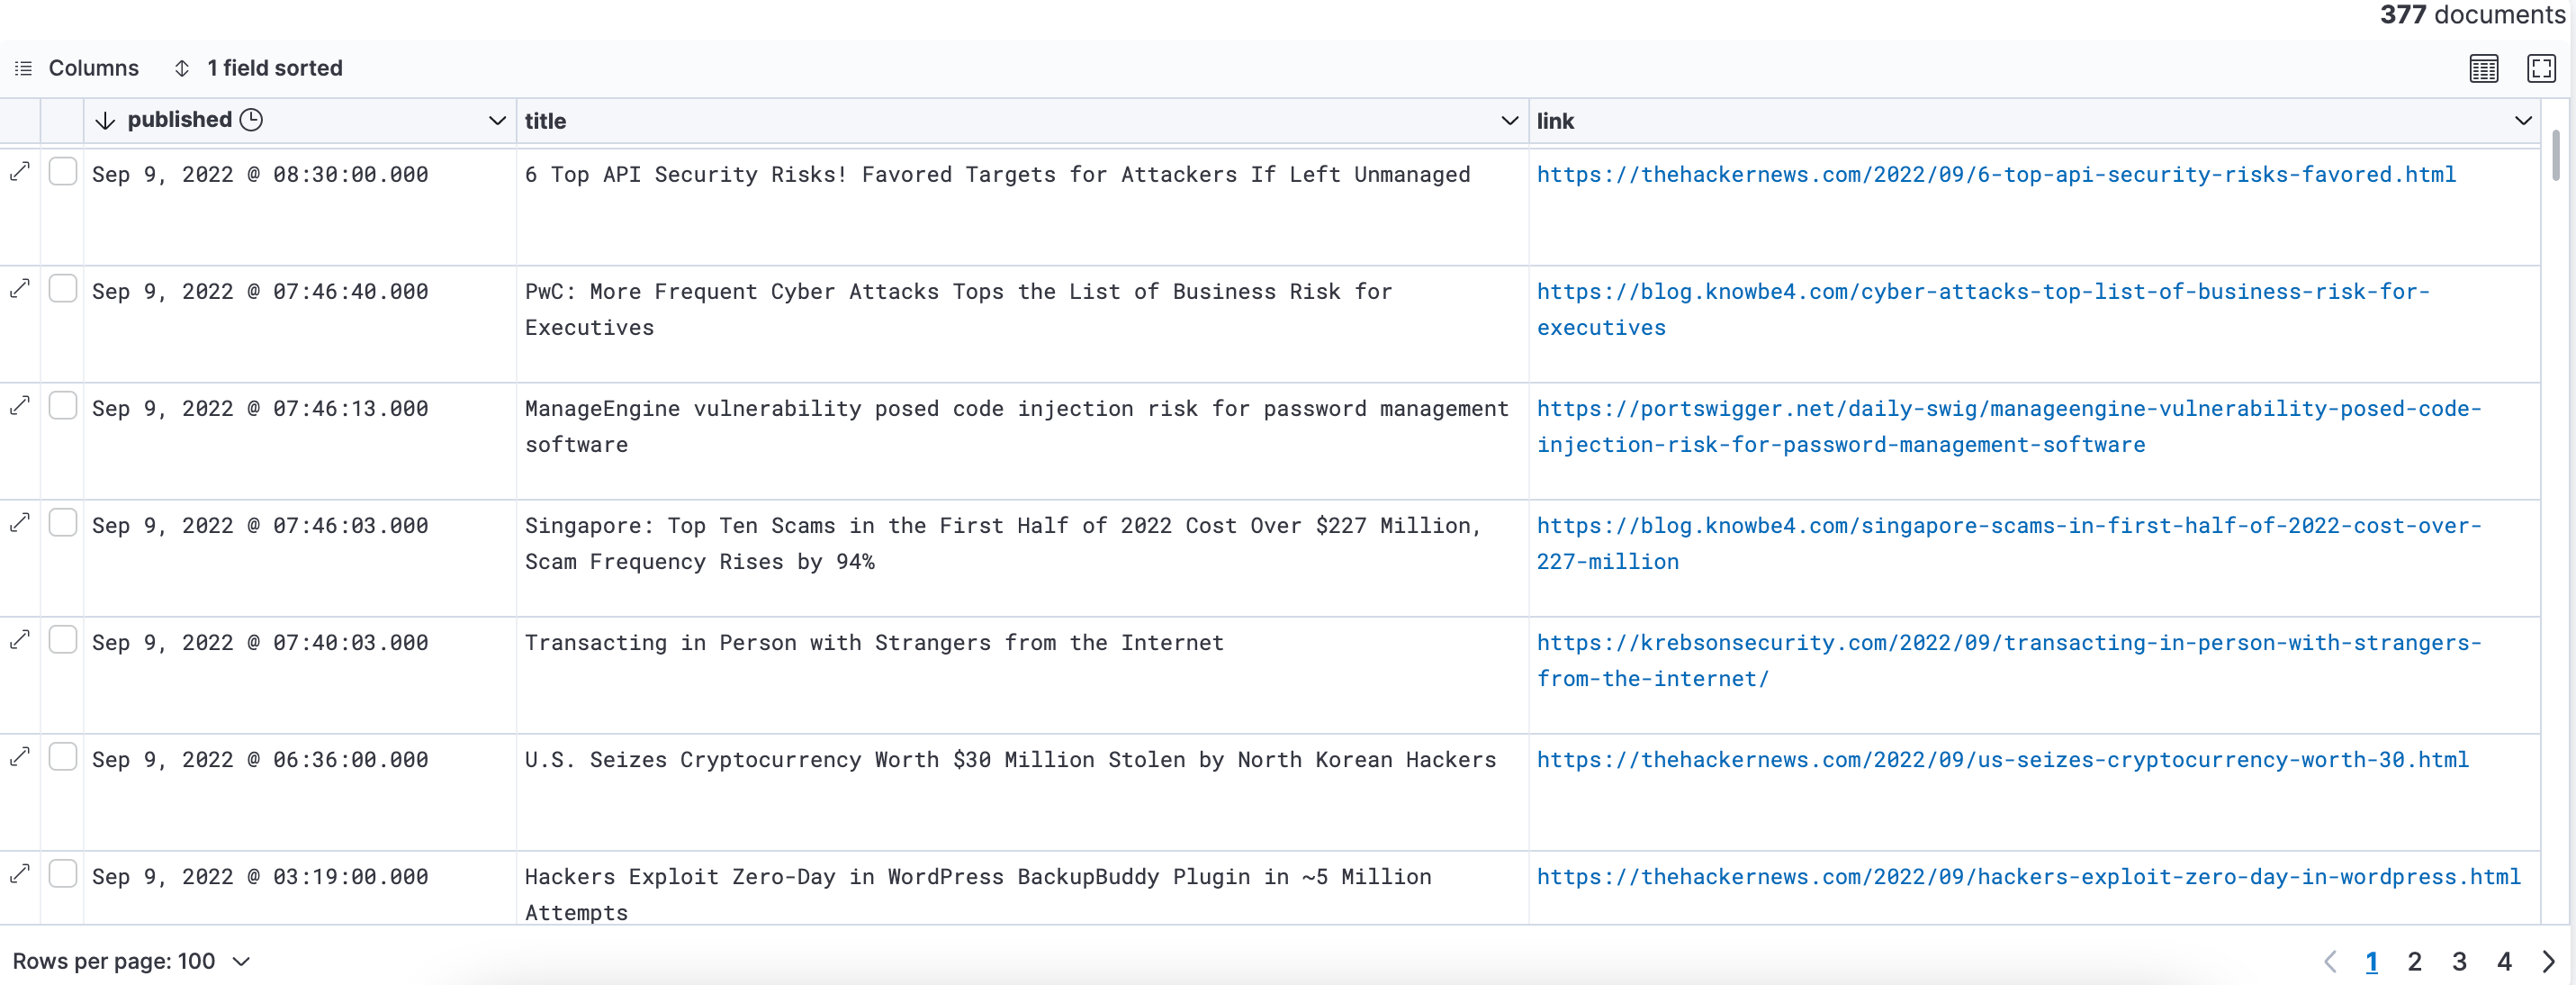
The Kibana piece is our favorite part. As former SOC analysts, we enjoy the analysis capabilities Kibana offers through Discover along with Visualizations and Dashboards. This is where we get to review and sift through the cybersecurity content being ingested.
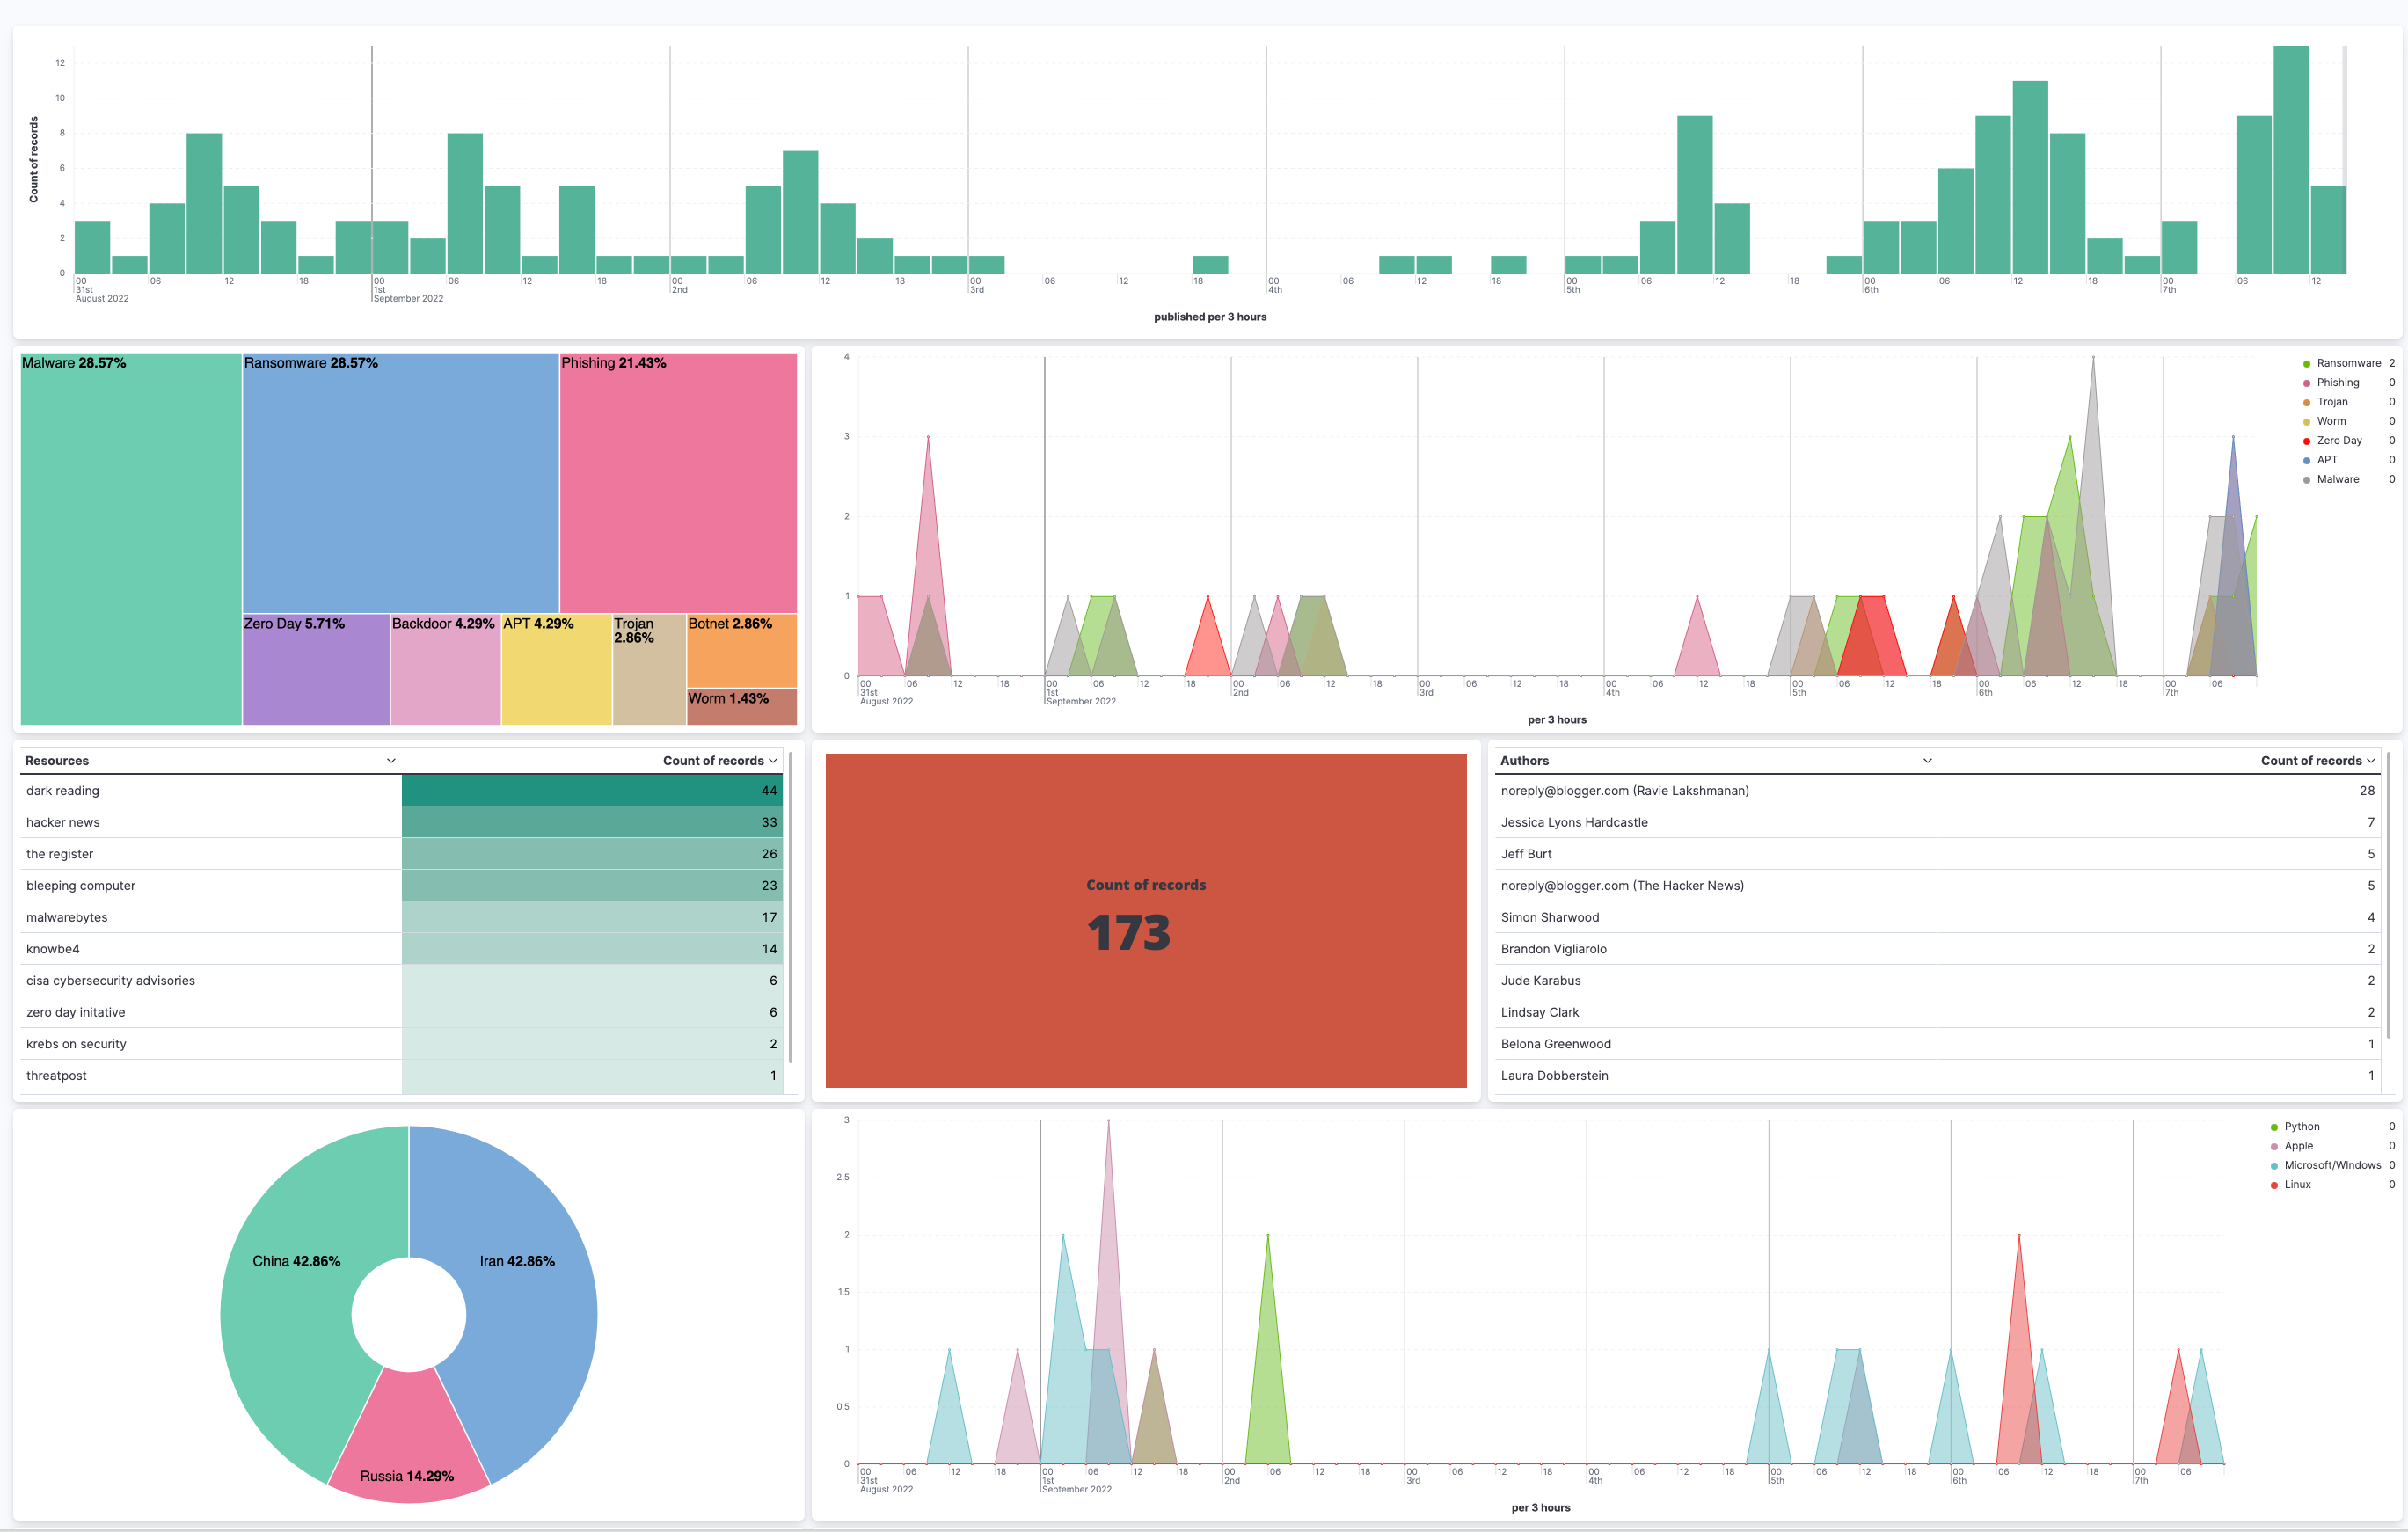
We decided to create a dashboard using a combination of Lens and aggregation-based visualizations:
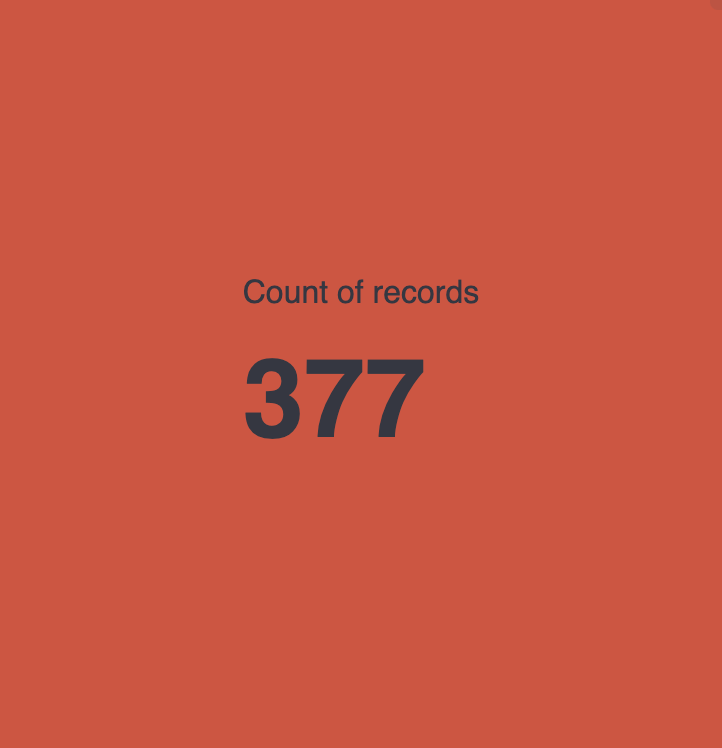
- Metric displaying the number of articles, blogs, etc. ingested within a specific timespan
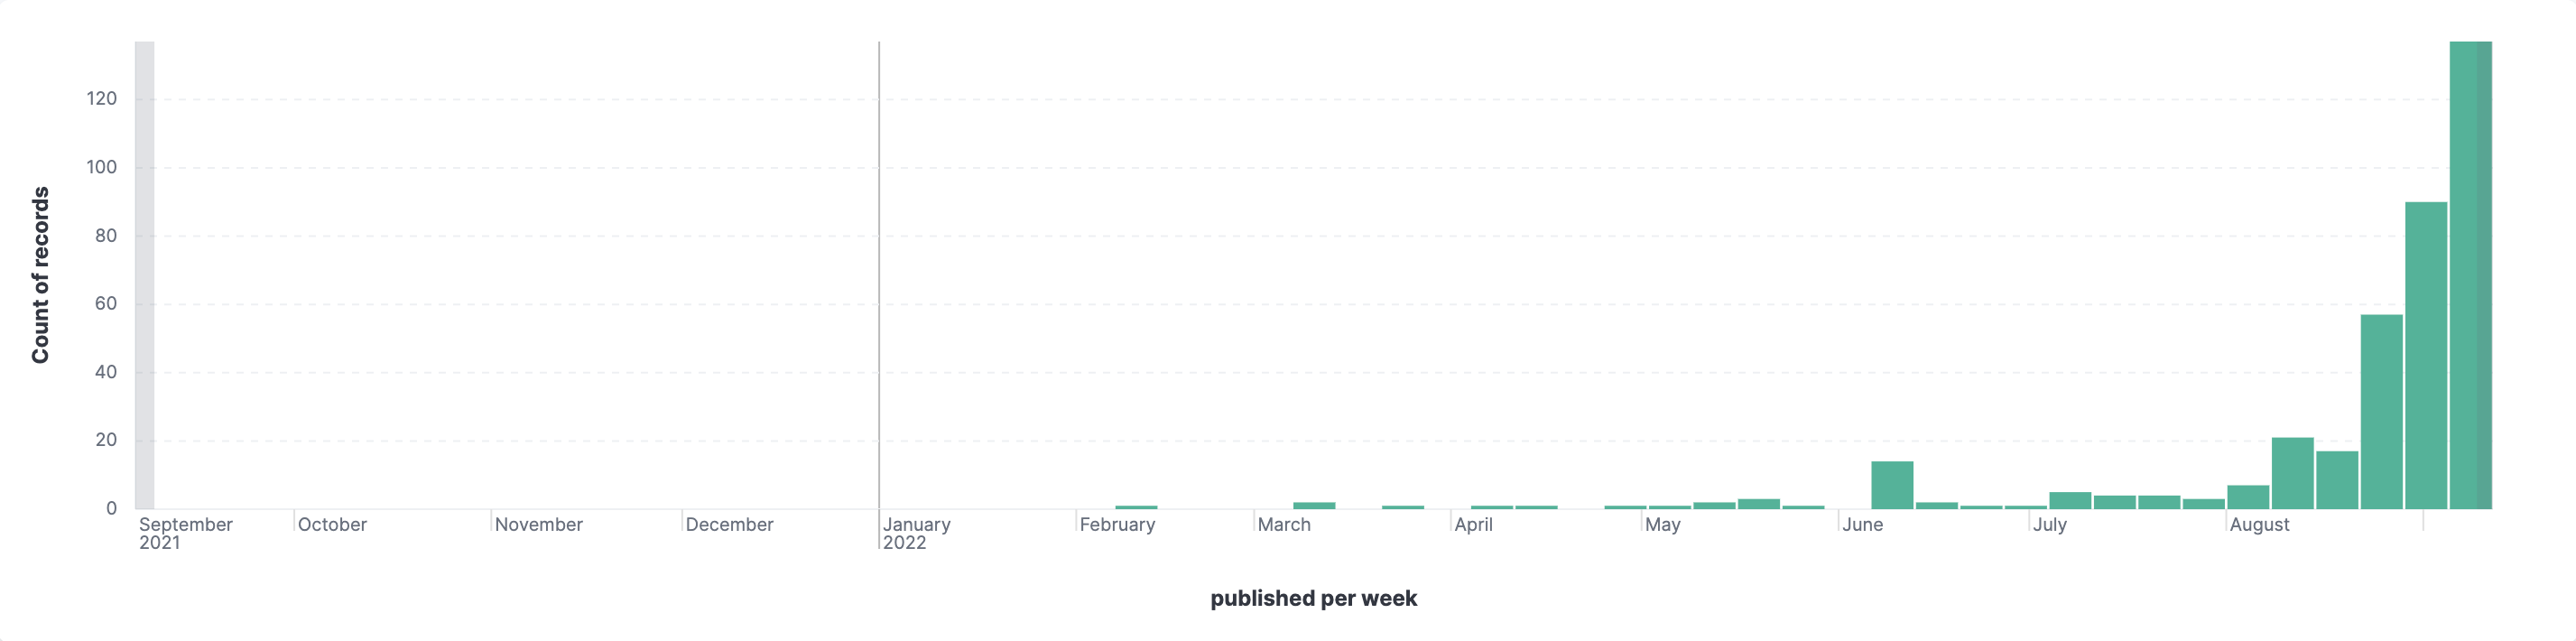
- Bar chart showcasing the number of blogs, articles, etc. published and ingested within a specific timespan
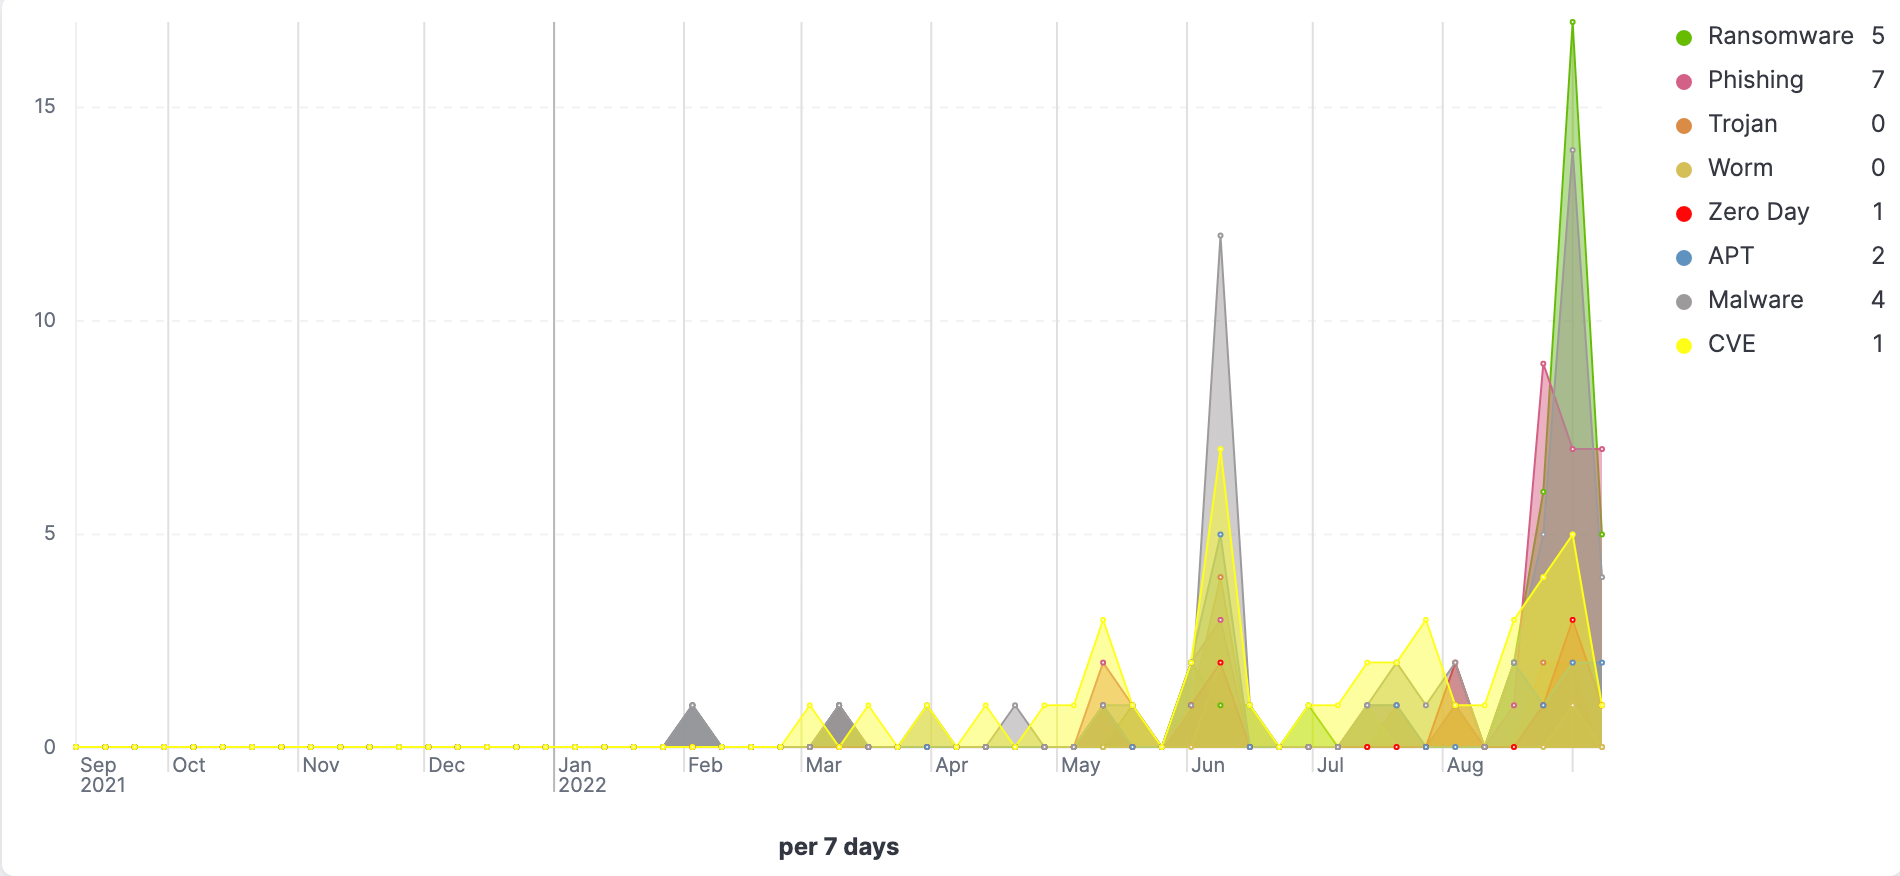
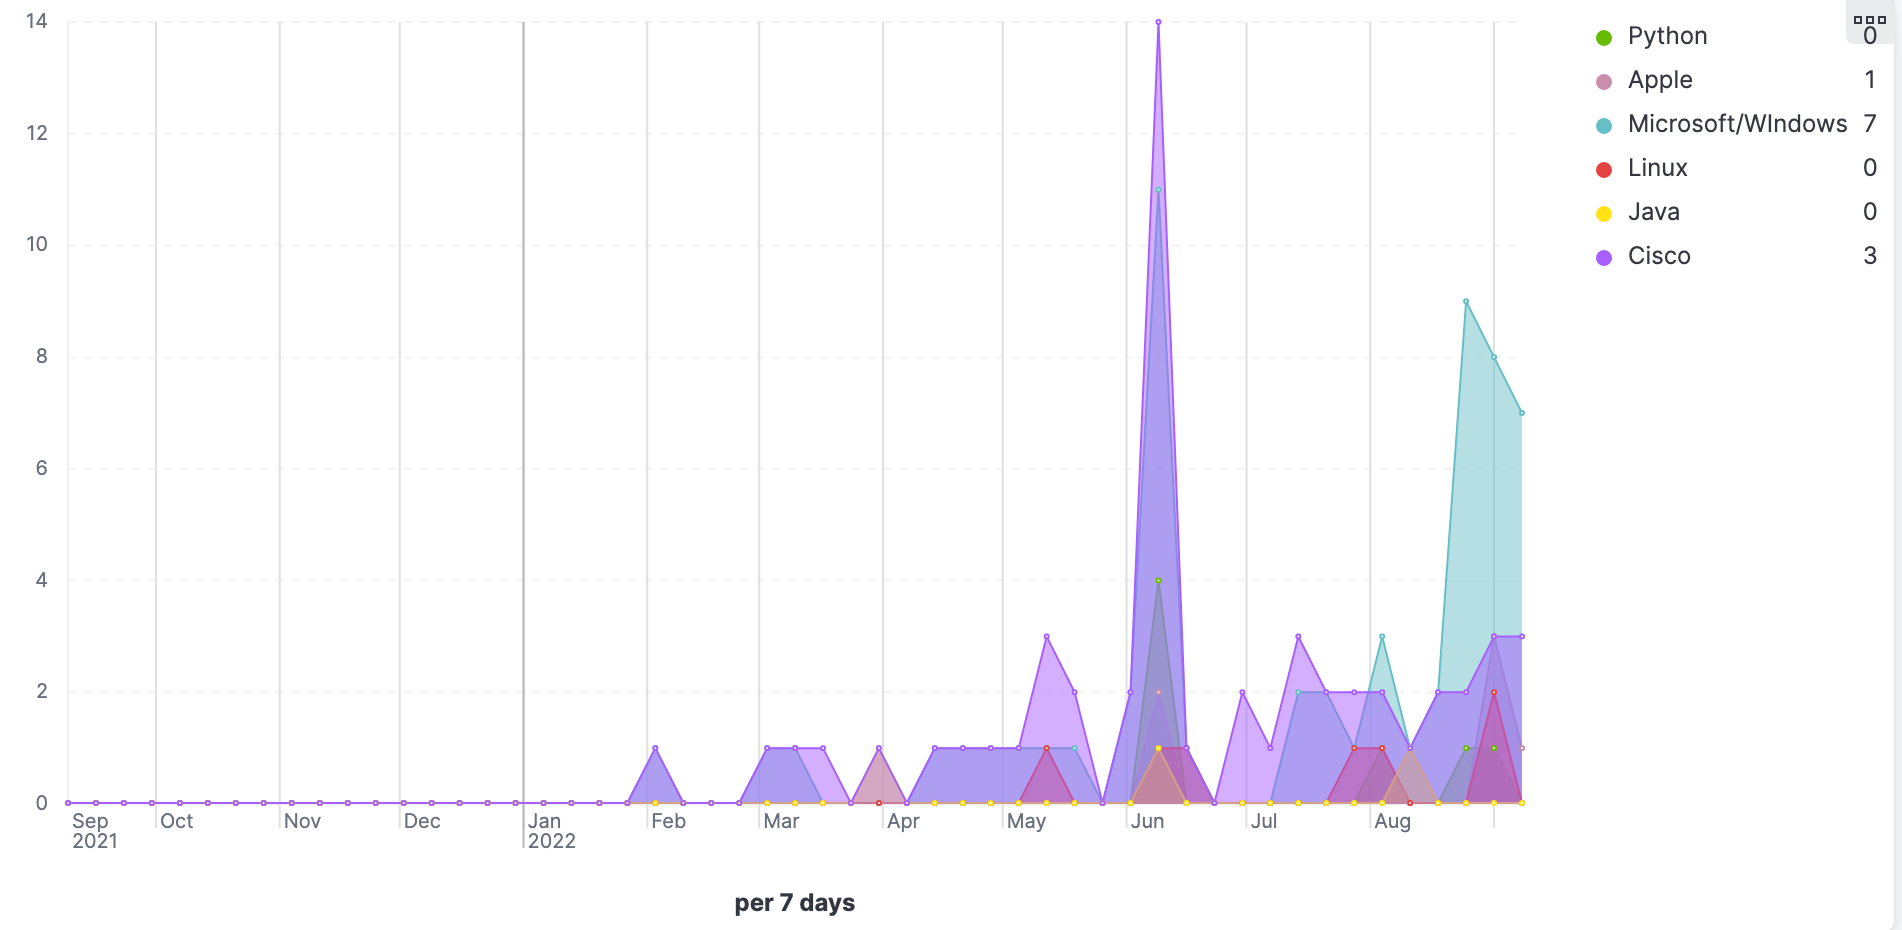
- TSVBs displaying trends associated with common threats like ransomware, phishing, malware, etc.
- TSVBs displaying trends associated with common software and technology like Microsoft, Python, Linux, Java, etc.
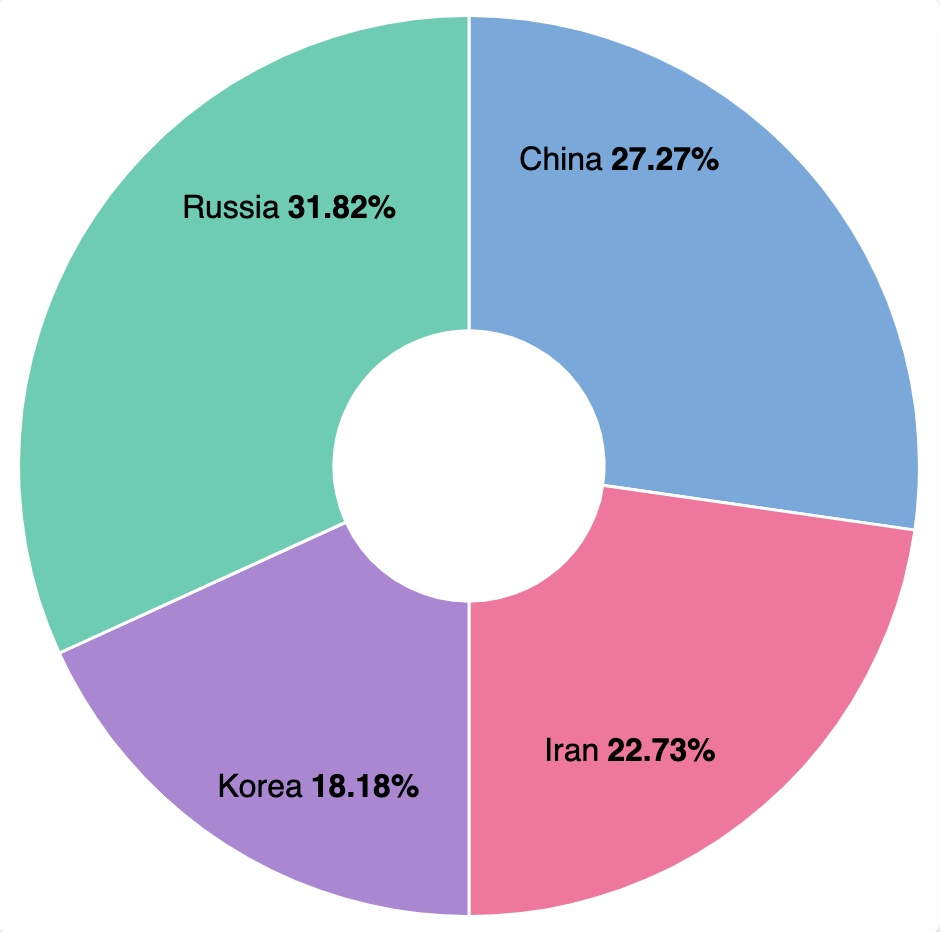
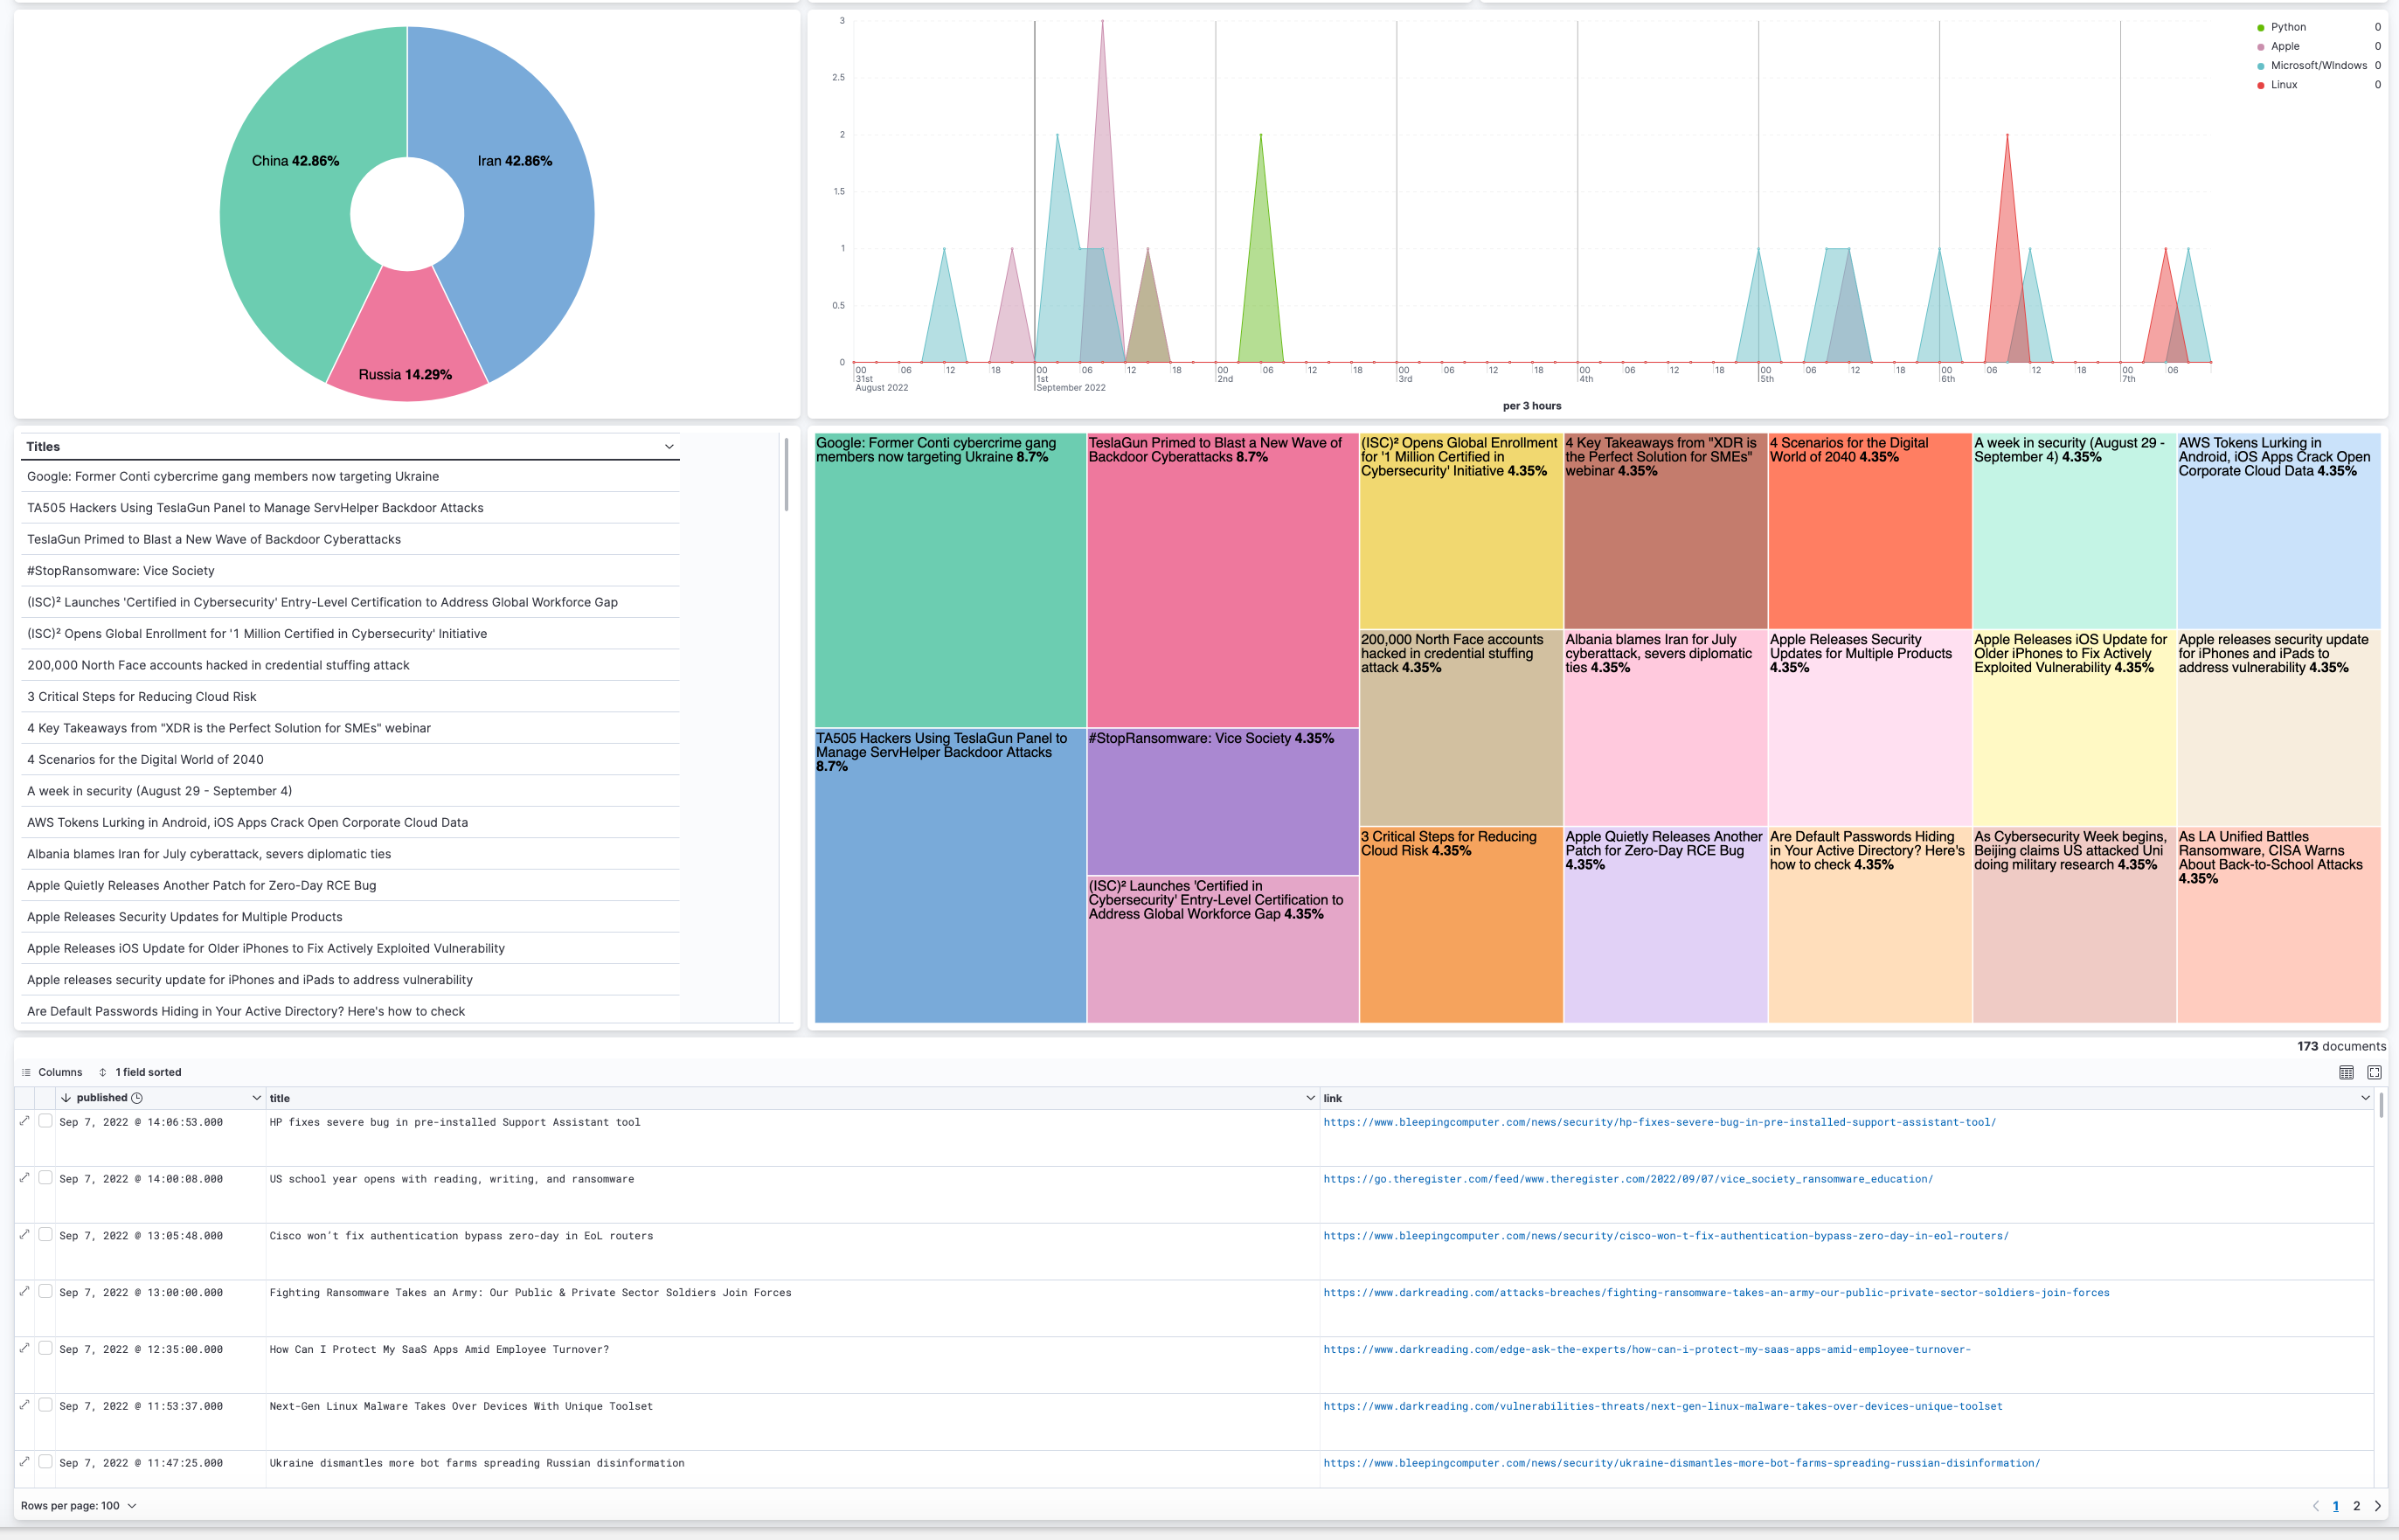
- Donut/Pie charts allow us to view and filter on the top cyber threats to national security and the predominant nation-state actors: Iran, North Korea, Russia, and China.
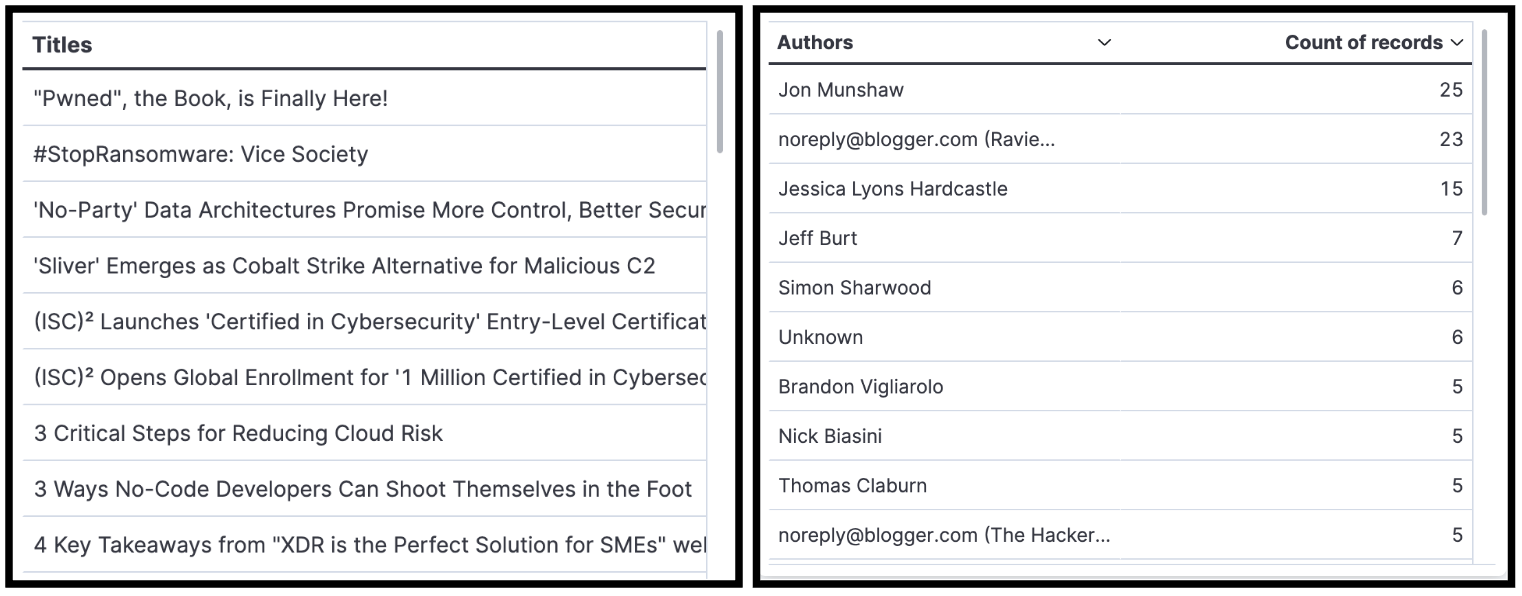
- Table aggregations allow us to view and filter by title, author, and sources/feeds
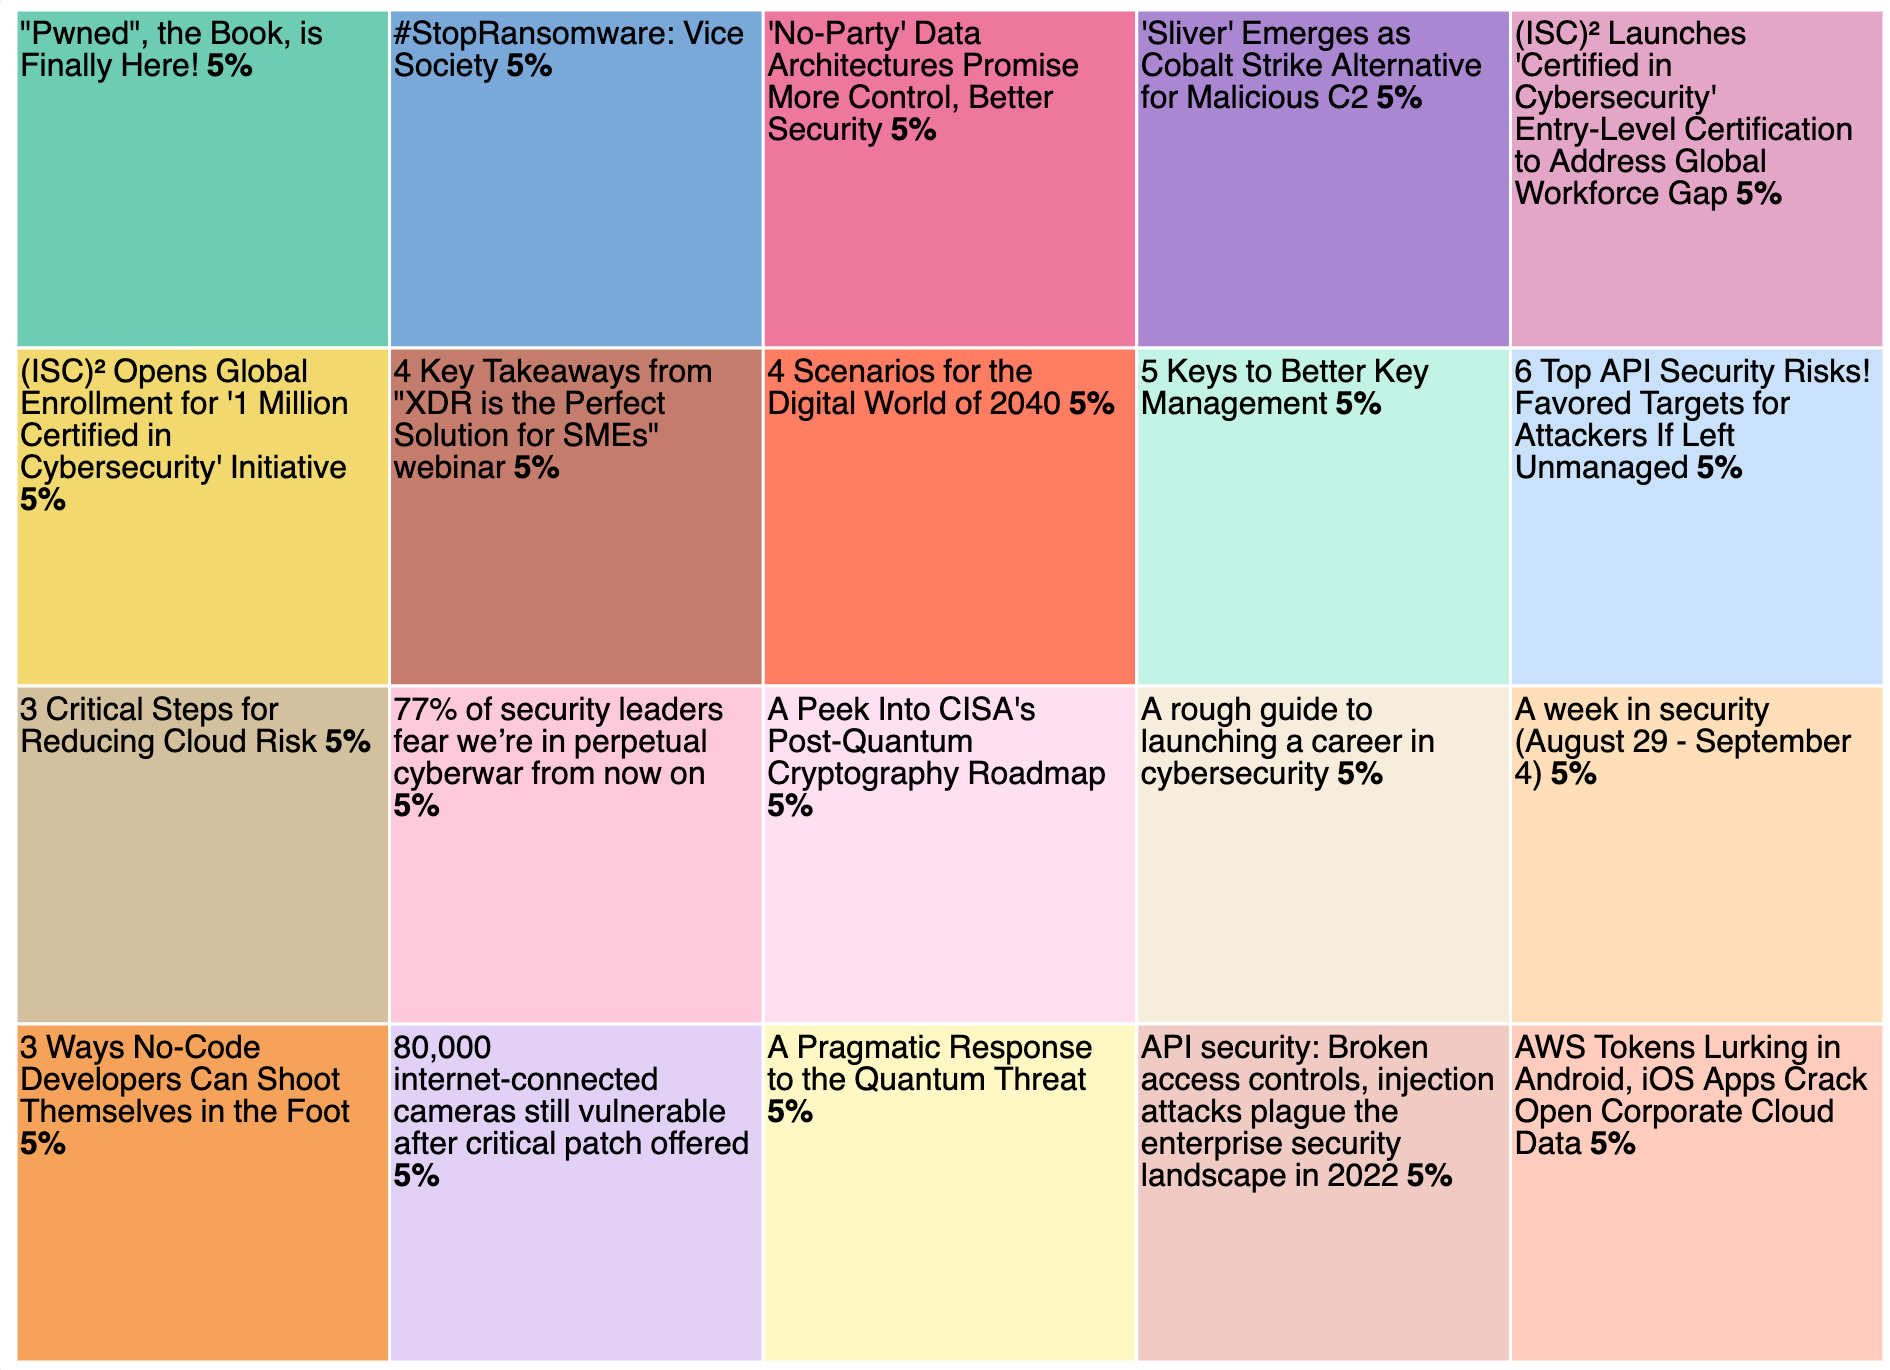
- Treemap gives us the ability to track the duplicate outliers by title. All of the percentages should be the same. If one is higher than the others, then it means we caught a duplicate document. This has been assisting us in our troubleshooting efforts.
- Saved searches give us the ability to view the full documents and click/navigate to articles associated with the documents. We updated the link field in our rss-feed Data View to Url format so we would have the ability to click and be redirected to the articles.
All of the Saved Objects (Data Views, Saved Searches, Visualizations, Dashboards, etc.) can be accessed and imported via our project on GitHub, or you can create your own and give us feedback.
The ability to aggregate multiple sources of news articles has added tremendous value. This tool combined with other OSINT tools can be used to narrow down details of potential attacks being seen in the wild, as well as help cut research time down. If you need to quickly find articles of an attack or specific attributions to a set of Malware, they can be searched in one place. Having the data in one place also hides the investigation you’re doing. If you are actively searching articles or attacks, that activity can be tracked. When you’re pulling all the articles, it is less likely your activity can be narrowed down or tracked and your investigation becomes more stealthy.
Conclusion
Our A Quick RSS Cybersecurity News Feed project gives users the ability to ingest cybersecurity content of interest, consolidate it, aggregate, visualize, and search. We are excited to introduce this solution to the OSINT community, and we look forward to maintaining and enhancing it.
Share
- Share on Twitter
Share on Twitter
- Share on LinkedIn
Share on LinkedIn
- Share on Facebook
Share on Facebook
- Share by Email
Share by Email
- Print this page
Print