From vector search to powerful REST APIs, Elasticsearch offers developers the most extensive search toolkit. Dive into our sample notebooks in the Elasticsearch Labs repo to try something new. You can also start your free trial or run Elasticsearch locally today.
When the need for searching free text arises and Ctrl+F / Cmd+F don't cut it anymore, using a lexical search engine is usually the next logical choice that comes to mind. Lexical search engines excel at analyzing and tokenizing the text to be searched into terms that can be matched at search time, but they usually fall short when it comes to understanding and making sense of the true meaning of the text being indexed and searched.
That's exactly where vector search engines shine. They can index the same text in such a way that it can be searched based on both the meaning it represents and its relationships with other concepts having similar or related meaning.
In this blog, we will briefly touch upon how vectors are a great mathematical concept for conveying the meaning of text. We'll then dive deeper into the different similarity techniques supported by Elasticsearch when it comes to searching for neighboring vectors, i.e., searching for vectors carrying a similar meaning, and how to score them.
What are vector embeddings?
This article doesn't delve deeply into the intricacies of vector embeddings. If you're looking to explore this topic further or need a primer before continuing, we recommend checking out the following guide.
In a nutshell, vector embeddings are obtained through a machine learning process (e.g. deep learning neural networks) that transforms any kind of unstructured input data (e.g., raw text, image, video, sound, etc.) into numerical data that carries their meaning and relationships. Different flavors of unstructured data require different kinds of machine learning models that have been trained to "understand" each type of data.
Each vector locates a specific piece of data as a point in a multidimensional space and that location represents a set of features the model uses to characterize the data. The number of dimensions depends on the machine learning model, but they usually range from a couple hundred to a few thousand. For instance, OpenAI Embeddings models boasts 1536 dimensions, while Cohere Embeddings models can range from 382 to 4096 dimensions. The Elasticsearch dense_vector field type supports up to 4096 dimensions as of the latest release.
The true feat of vector embeddings is that data points that share similar meaning are close together in the space. Another interesting aspect is that vector embeddings also help capture relationships between data points.
How do we compare vectors?
Knowing that unstructured data is sliced and diced by machine learning models into vector embeddings that capture the similarity of the data along a high number of dimensions, we now need to understand how the matching of those vectors works. It turns out that the answer is pretty simple.
Vector embeddings that are close to one another represent semantically similar pieces of data. So, when we query a vector database, the search input (image, text, etc.) is first turned into a vector embeddings using the same machine learning model that has been used for indexing all the unstructured data, and the ultimate goal is to find the nearest neighboring vectors to that query vector. Hence, all we need to do is figure out how to measure the "distance" or "similarity" between the query vector and all the existing vectors indexed in the database - it's that simple.
Distance, similarity and scoring
Luckily for us, measuring the distance or similarity between two vectors is an easy problem to solve thanks to vector arithmetics. So, let’s look at the most popular distance and similarity functions that are supported by Elasticsearch. Warning, math ahead!
Just before we dive in, let's have a quick look at scoring. Factually, Lucene only allows scores to be positive. All the distance and similarity functions that we will introduce shortly yield a measure of how close or similar two vectors are, but those raw figures are rarely fit to be used as score since they can be negative. For this reason, the final score needs to be derived from the distance or similarity value in a way that ensures the score will be positive and a bigger score corresponds to a higher ranking (i.e. to closer vectors).
L1 distance
The L1 distance, also called the Manhattan distance, of two vectors and is measured by summing up the pairwise absolute difference of all their elements. Obviously, the smaller the distance , the closer the two vectors are. The L1 distance formula (1) is pretty simple, as can be seen below:
Visually, the L1 distance can be illustrated as shown in the image below (in red):

Computing the L1 distance of the following two vectors and would yield
Important: It is worth noting that the L1 distance function is only supported for exact vector search (aka brute force search) using the script_score DSL query, but not for approximate kNN search using the knn search option or knn DSL query.
L2 distance
The L2 distance, also called the Euclidean distance, of two vectors and is measured by first summing up the square of the pairwise difference of all their elements and then taking the square root of the result. It’s basically the shortest path between two points. Similarly to L1, the smaller the distance , the closer the two vectors are:
The L2 distance is shown in red in the image below:

Let’s reuse the same two sample vectors and as we used for the distance, and we can now compute the distance as .
As far as scoring goes, the smaller the distance between two vectors, the closer (i.e., the more similar) they are. So in order to derive a score we need to invert the distance measure, so that the smallest distance yields the highest score. The way the score is computed when using the L2 distance looks as shown in formula (3) below:
Reusing the sample vectors from the earlier example, their score would be . Two vectors that are very close to one another will near a score of 1, while the score of two vectors that are very far from one another will tend towards 0.
Wrapping up on L1 and L2 distance functions, a good analogy to compare them is to think about A and B as being two buildings in Manhattan, NYC. A taxi going from A to B would have to drive along the L1 path (streets and avenues), while a bird would probably use the L2 path (straight line).
Cosine similarity
In contrast to L1 and L2, cosine similarity does not measure the distance between two vectors and , but rather their relative angle, i.e., whether they are both pointing in roughly the same direction. The higher the similarity , the smaller the angle between the two vectors, and hence, the "closer" they are and the "similar" their conveyed meaning are.
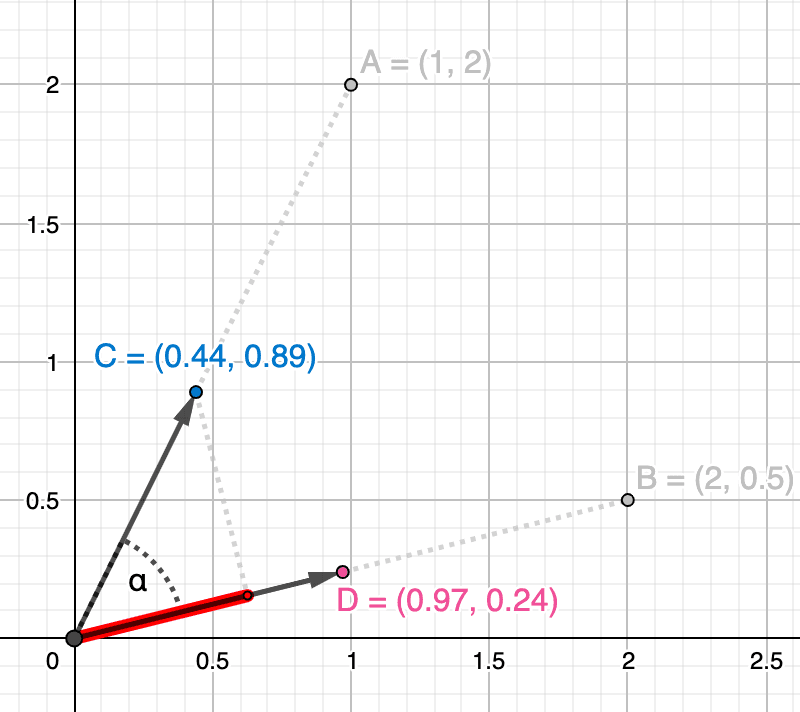
To illustrate this, let's think of two people out in the wild looking in different directions. In the figure below, the person in blue looks in the direction symbolized by vector and the person in red in the direction of vector . The more they will direct their eyesight towards the same direction (i.e., the closer their vectors get), the more their field of view symbolized by the blue and red areas will overlap. How much their field of view overlap is their cosine similarity. However, note that person B looks farther away than person A (i.e., vector is longer). Person B might be looking at a mountain far away on the horizon, while person A could be looking at a nearby tree. For cosine similarity, that doesn't play any role as it is only about the angle.

Now let's compute that cosine similarity. The formula (4) is pretty simple, where the numerator consists of the dot product of both vectors and the denominator contains the product of their magnitude (i.e., their length):
The cosine similarity between and is shown in the image below as a measure of the angle between them (in red):

Let's take a quick detour in order to explain what these cosine similarity values mean concretely. As can be seen in the image below depicting the cosine function, values always oscillate in the interval.
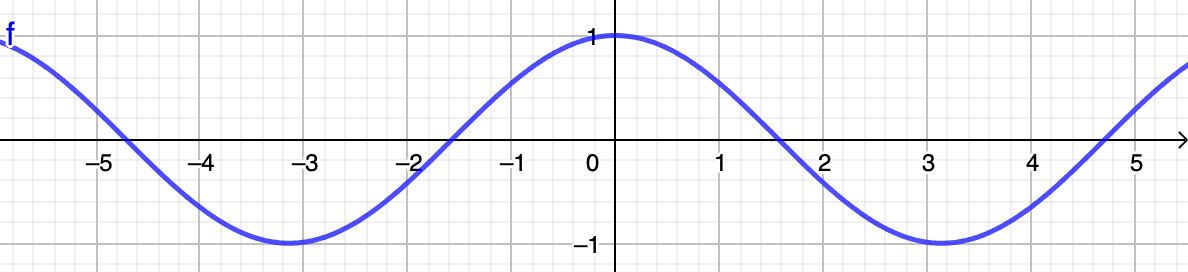
Remember that in order for two vectors to be considered similar, their angle must be as acute as possible, ideally nearing a angle, which would boil down to a perfect similarity of . In other words, when vectors are...
- ...close to one another, the cosine of their angle nears (i.e., close to )

- ...unrelated, the cosine of their angle nears (i.e., close to )

- ...opposite, the cosine of their angle nears (i.e., close to )

Now that we know how to compute the cosine similarity between two vectors and we have a good idea of how to interpret the resulting value, we can reuse the same sample vectors and and compute their cosine similarity using the formula (4) we saw earlier.
We get a cosine similarity of , which is closer to than to , meaning that the two vectors are somewhat similar, i.e., not perfectly similar, but not completely unrelated either, and certainly do not carry opposite meaning.
In order to derive a positive score from any cosine similarity value, we need to use the following formula (5), which transforms cosine similarity values oscillating within the interval into scores in the interval:
The score for the sample vectors and would thus be: .
Dot product similarity
One drawback of cosine similarity is that it only takes into account the angle between two vectors but not their magnitude, which means that if two vectors point roughly in the same direction but one is much longer than the other, both will still be considered similar. Dot product similarity, also called scalar or inner product similarity, improves that by taking into account both the angle and the magnitude of the vectors, which provides for a more accurate similarity metric. In order to make the magnitude of the vectors irrelevant, dot product similarity requires that the vectors be normalized first, so we are ultimately only comparing vectors of unit length 1.
Let's try to illustrate this again with the same two people as before, but this time, we put them in the middle of a circular room, so that their sight reach is exactly the same (i.e., the radius of the room). Similarly to cosine similarity, the more they turn towards the same direction (i.e., the closer their vectors get), the more their field of view will overlap. However, in contrary to cosine similarity, both vectors have the same length and both areas have the same surface, which means that the two people look at exactly the same picture located at the same distance. How well those two areas overlap denotes their dot product similarity.

Before introducing the dot product similarity formula, let's quickly see how a vector can be normalized. It's pretty simple and can be done in two trivial steps:
- compute the magnitude of the vector
- divide each component by the magnitude obtained in 1.
As an example, let's take vector . We can compute its magnitude as we have seen earlier when reviewing the cosine similarity, i.e. . Then, dividing each component of the vector by its magnitude, we obtain the following normalized vector :
Going through the same process for the second vector would yield the following normalized vector :
In order to derive the dot product similarity formula, we can compute the cosine similarity between our normalized vectors and using formula (4), as shown below:
And since the magnitude of both normalized vectors is now , the dot product similarity formula (6) simply becomes... you guessed it, a dot product of both normalized vectors:
In the image below, we show the normalized vectors and and we can illustrate their dot product similarity as the projection of one vector onto the other (in red).
Using our new formula (6), we can compute the dot product similarity of our two normalized vectors, which unsurprisingly yields the exact same similarity value as the cosine one:
When leveraging dot product similarity, the score is computed differently depending on whether the vectors contain float or byte values. In the former case, the score is computed the same way as for cosine similarity using formula (7) below:
However, when the vector is composed of byte values, the scoring is computed a bit differently as shown in formula (8) below, where is the number of dimensions of the vector:
Also, one constraint in order to yield accurate scores is that all vectors, including the query vector, must have the same length, but not necessarily 1.
Max inner product similarity
Since release 8.11, there is a new similarity function that is less constrained than the dot product similarity, in that the vectors don't need to be normalized. The main reason for this is explained at length in the following article, but to sum it up very briefly, certain datasets are not very well adapted to having their vectors normalized (e.g., Cohere embeddings) and doing so can cause relevancy issues.
The formula for computing max inner product similarity is exactly the same as the dot product one (6). What changes is the way the score is computed by scaling the max inner product similarity using a piecewise function whose formula depends on whether the similarity is positive or negative, as shown in formula (9) below:
What this piecewise function does is that it scales all negative max inner product similarity values in the interval and all positive values in the interval.
In summary
That was quite a ride, mathematically speaking, but here are a few takeaways that you might find useful.
Which similarity function you can use, ultimately depends on whether your vector embeddings are normalized or not. If your vectors are already normalized or if your data set is agnostic to vector normalization (i.e., relevancy will not suffer), you can go ahead and normalize your vectors and use dot product similarity, as it is much faster to compute than the cosine one since there is no need to compute the length of each vector. When comparing millions of vectors, those computations can add up quite a lot.
If your vectors are not normalized, then you have two options:
- use cosine similarity if normalizing your vectors is not an option
- use the new max inner product similarity if you want the magnitude of your vectors to contribute to scoring because they do carry meaning (e.g., Cohere embeddings)
At this point, computing the distance or similarity between vector embeddings and how to derive their scores should make sense to you. We hope you found this article useful.
Frequently Asked Questions
What does cosine similarity measure?
Cosine similarity measures the relative angle between two vectors i.e., whether they are both pointing in roughly the same direction.
How is the L1 distance measured?
L1 distance is measured by summing up the pairwise absolute difference of all their elements.
How is the L2 distance measured?
The L2 distance, also called the Euclidean distance, of two vectors is measured by first summing up the square of the pairwise difference of all their elements and then taking the square root of the result.
What is the difference between L1 and L2 distance?
The difference between L1 and L2 distance comes down to how you measure of two vectors. L1 distance is measured by summing up the pairwise absolute difference of all their elements. On the other hand, L2 distance is measured by first summing up the square of the pairwise difference of all their elements and then taking the square root of the result.
What is the difference between cosine similarity and cosine distance?
Cosine similarity measures the relative angle of two vectors, i.e., whether they are both pointing in roughly the same direction. On the other hand, cosine distance measures how different their directions are.
What is the difference between dot product and cosine similarity?
Dot product measures both length and alignment of vectors, while cosine similarity measures only how aligned their directions are, ignoring length.
When should you use dot product vs. cosine similarity?
If f your vectors are normalized (or can be normalized without affecting relevance), use dot product similarity — it’s faster because you don’t need to compute vector lengths. If your vectors are not normalized, use cosine similarity when you only care about direction, or dot product if vector magnitude carries meaning and should influence the score.
How do you chose the right distance metric for vector search?
Choose a distance metric based on your vectors and what matters for your search: use L1 or L2 to measure absolute differences, cosine similarity if only direction matters, dot product if both direction and magnitude matter (and vectors are normalized), or max inner product if vectors are unnormalized but magnitude should influence relevance.
Related Content

March 20, 2026
Fast vs. accurate: Measuring the recall of quantized vector search
Explaining how to measure recall for vector search in Elasticsearch with minimal setup.
March 2, 2026
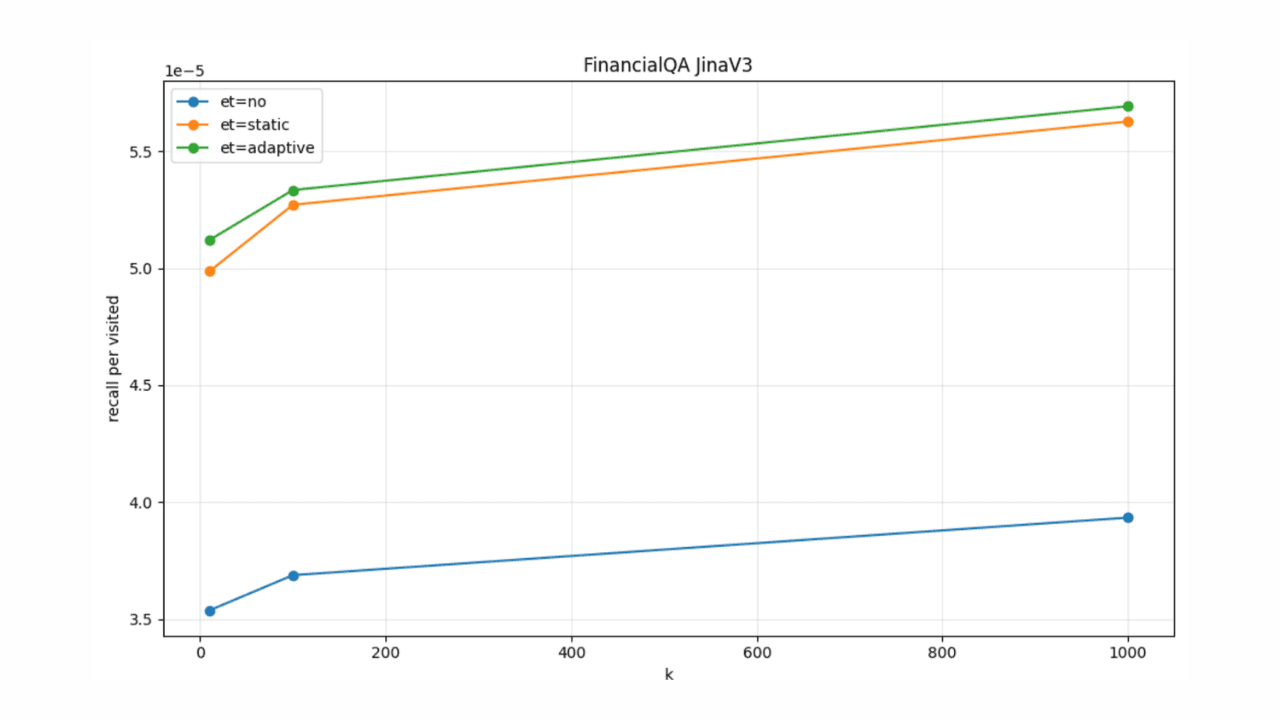
Adaptive early termination for HNSW in Elasticsearch
Introducing a new adaptive early termination strategy for HNSW in Elasticsearch.
February 25, 2026
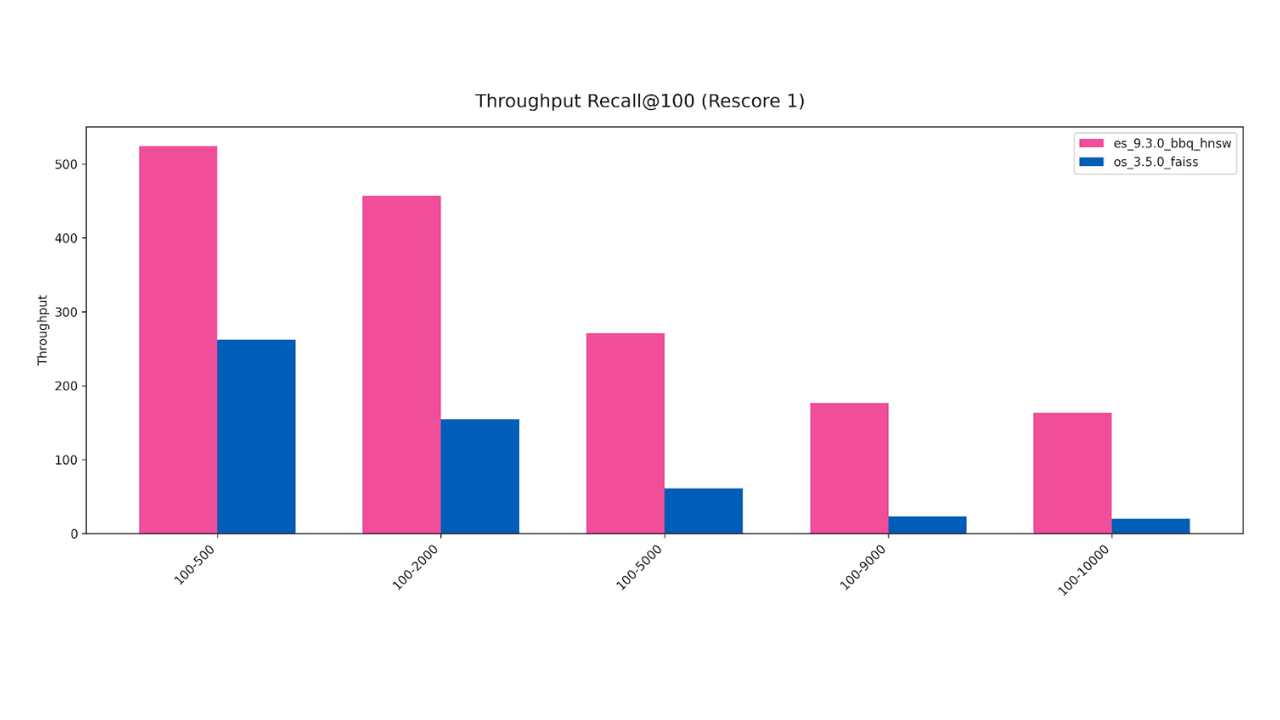
Elasticsearch vector search is up to 8x faster than OpenSearch
Exploring filtered vector search benchmarks of OpenSearch vs. Elasticsearch and why vector search performance is critical for context-engineered systems.

February 16, 2026
Elasticsearch 9.3 adds bfloat16 vector support
Exploring the new Elasticsearch element_type: bfloat16, which can halve your vector data storage.

February 10, 2026
How to defend your RAG system from context poisoning
How context engineering techniques prevent context poisoning in LLM responses.