Monitoring Elastic Enterprise Search performance using Elastic APM


 Share on Twitter
Share on Twitter

 Share on LinkedIn
Share on LinkedIn

 Share on Facebook
Share on Facebook

 Share by Email
Share by Email

 Print this page
Print
Elastic APM is a free, open and powerful observability tool that provides intelligence into application performance for a myriad of production applications (e.g., throughput, error rates, latency, resource usage, transaction traces). You can now enable Elastic APM integration to gain deep insight into the performance behaviors of your Elastic Enterprise Search deployment!
This article provides step-by-step instructions for enabling the integration between Elastic's APM and Enterprise Search products and showcases how our Enterprise Search team leverages Elastic APM to capture additional intelligence to improve Enterprise Search performance during the development lifecycle.
The data collected by the APM Ruby agent in Enterprise Search is shipped to an Elastic APM Server and indexed into an Elasticsearch cluster.
Setting up the integration
Step 1: Deploy an Elastic APM Server
Elastic Cloud
The easiest way to deploy an Elastic APM Server is on Elastic Cloud. APM Server is included in new Elastic Cloud deployments (APM & Fleet section) by default: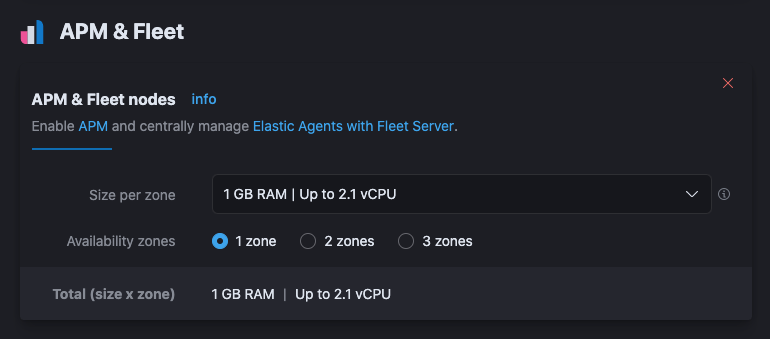
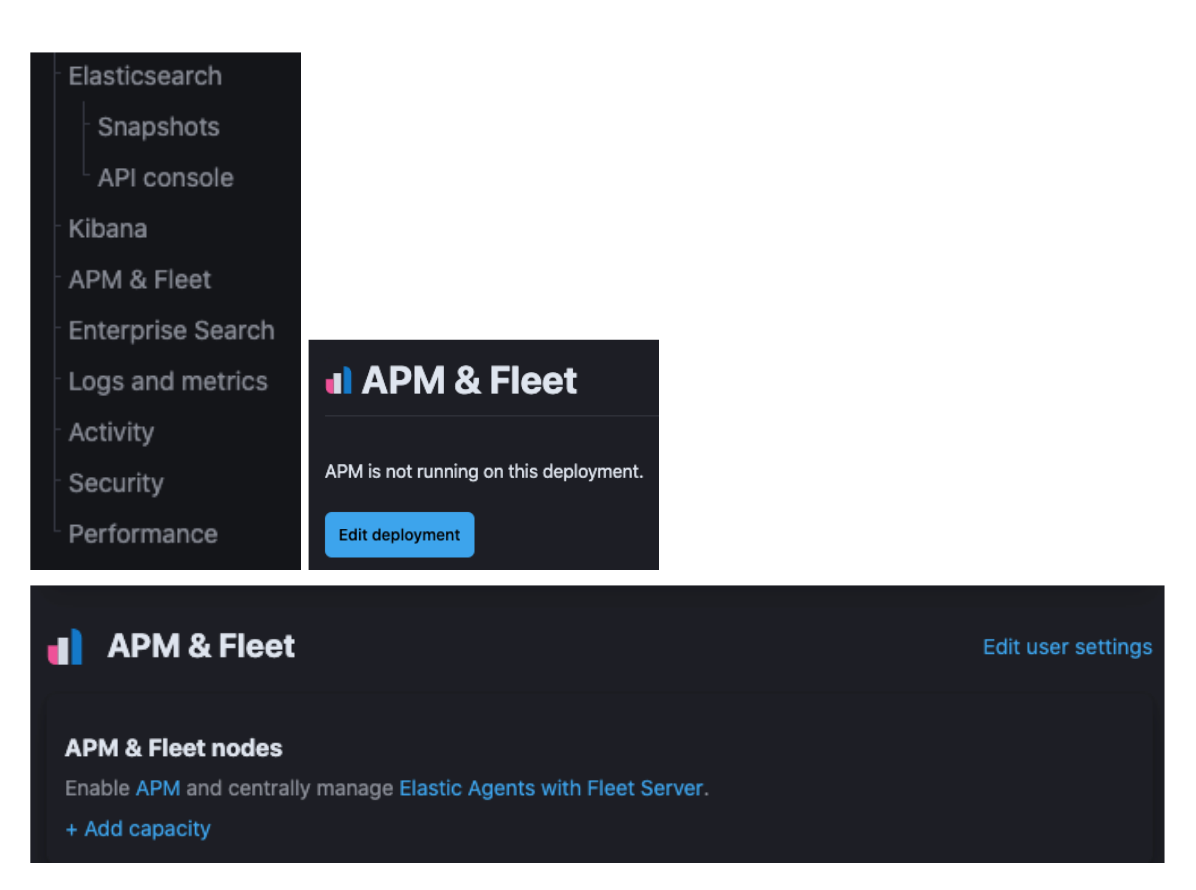
If you already have an Elastic Cloud deployment and had previously disabled APM & Fleet nodes, you can re-enable it from the Cloud console by clicking on APM & Fleet link > Edit deployment > Add Capacity from the APM & Fleet section.
You have the option to deploy APM in the same Elastic Cloud deployment where you are running Enterprise Search, but this is not mandatory. If desired, you can set up a new Elastic Cloud deployment to deploy APM and integrate with an existing Enterprise Search deployment.
On-premises
If your Enterprise Search deployment is on-premises, you can either install a new Elastic APM Server in your infrastructure, use an existing Elastic APM Server, or create an Elastic Cloud deployment (see "Elastic Cloud" section in Step 1 above) with APM & Fleet enabled.
Enterprise Search's embedded APM Ruby agent is compatible with APM server >= version 6.5.
If you are already using the Elastic APM solution for performance monitoring of other applications and have an APM Server available, skip to Step 2.
If you are installing a new APM Server in your infrastructure, install the latest APM Server (follow only Step 1: Spin up the Elastic Stack in the Self-managed tab) and connect it to a new or existing Elasticsearch cluster. Install a Kibana instance to connect to the Elasticsearch cluster so you can visualize ("Self-managed" tab) the resulting APM data in Step 4.
Step 2: Copy the APM Server endpoint and secret token
Elastic Cloud
Once APM & Fleet is enabled in your Elastic Cloud deployment, copy the APM endpoint and secret token from the Cloud user console. You will use these values in Step 3 in the Enterprise Search configuration.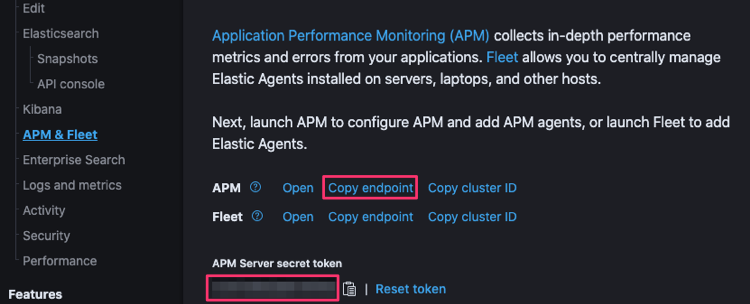
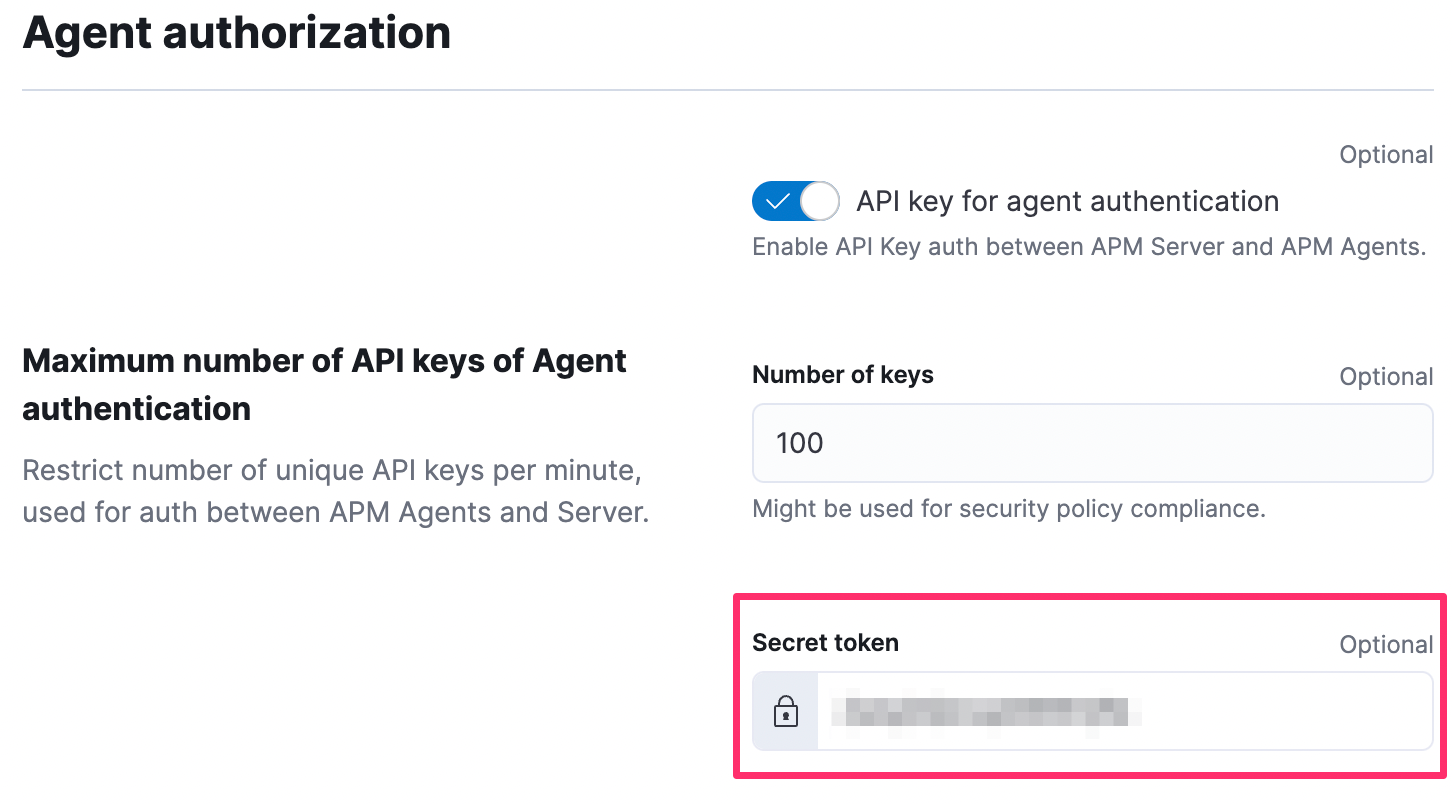
If you are running Integrations Server on versions 8.0 and later, you can locate the APM integration's secret token from Kibana > Management > Fleet > Agent policies > Agent policy name (e.g., Elastic Cloud agent policy) > APM integration name (e.g., Elastic APM) > Edit integration > Agent authorization > Secret token.
On-premises
If you are shipping Enterprise Search APM data collected for an on-premises Enterprise Search deployment to an Elastic Cloud APM & Fleet deployment, follow the "Elastic Cloud" instructions above to copy the endpoint and secret token for later use.
If you are using a new or existing APM Server in your infrastructure, start the APM Server and bring up the Kibana instance that is connected to the Elasticsearch cluster you have configured in Step 1 ("On-premises" section). From Kibana, click on Observability > APM > Services.
Scroll down to the bottom of the page and click on Setup Instructions: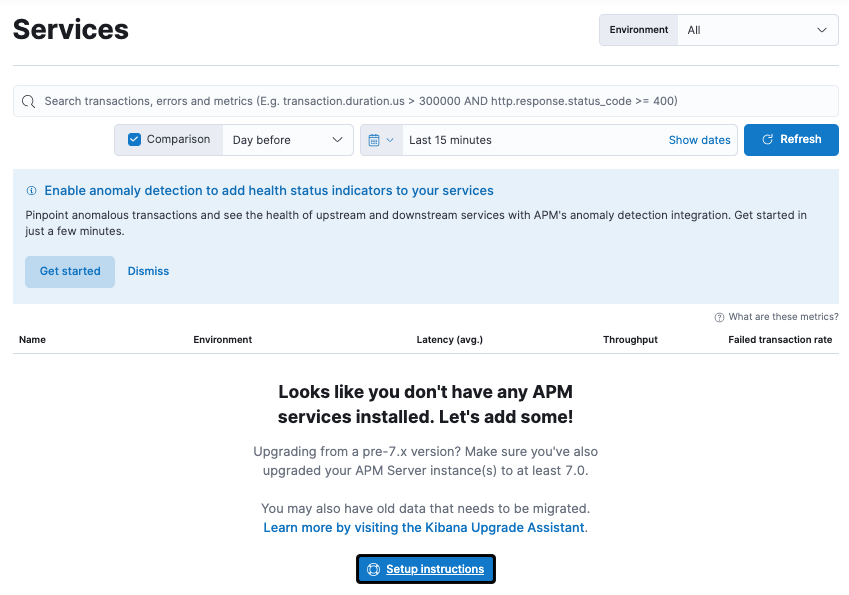
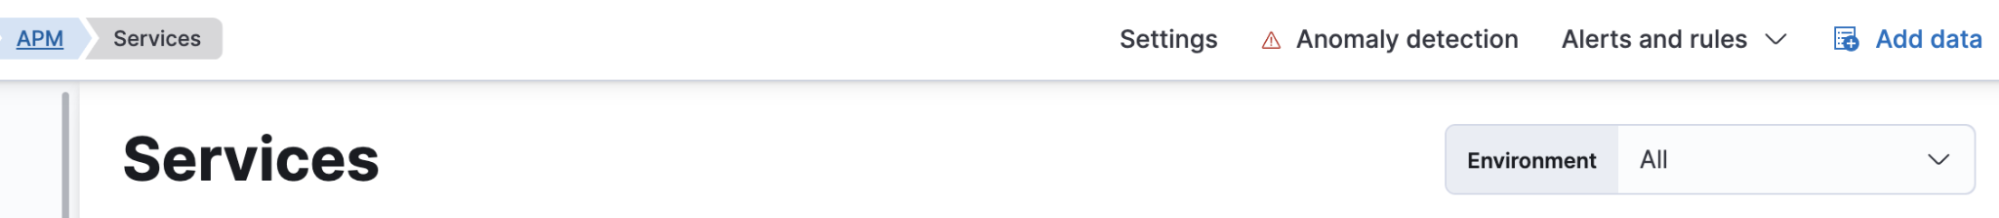
If you are using an existing APM Server setup in your infrastructure with existing services defined, simply click on Add data at the top right corner of the Services page (instead of "Setup instructions" above)
On the resulting page, click on Ruby on Rails tab:
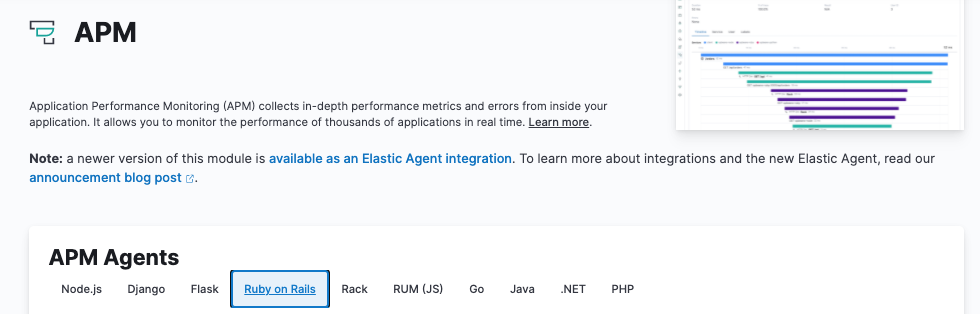
This Ruby on Rails page provides a list of setup steps. Skip Step 1 because you do not have to install an APM agent since it is already embedded in Enterprise Search.
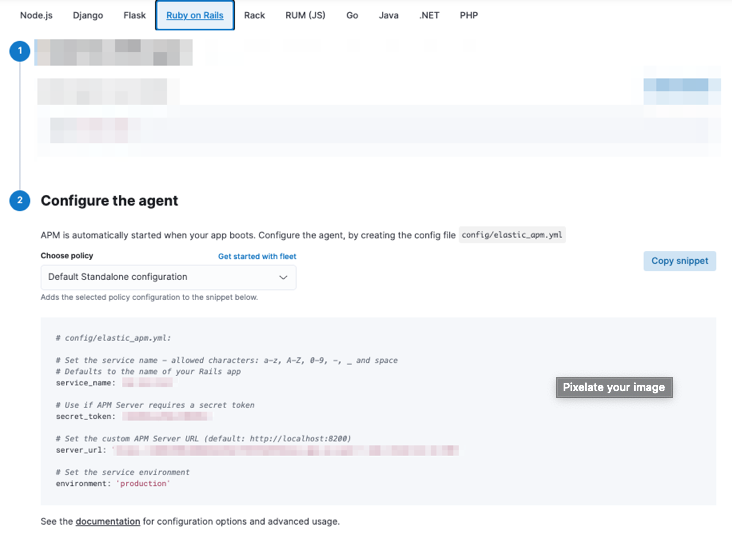
Keep the Default Standalone configuration policy and copy the value of secret_token and server_url. You will use these values in Step 3 in the Enterprise Search configuration.
Step 3: Enable APM integration in Enterprise Search
Elastic Cloud
Edit your Enterprise Search deployment using the Cloud user console. Click on Edit user settings under Enterprise Search: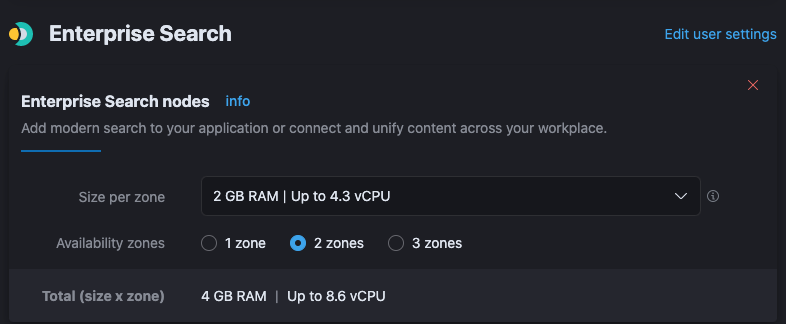
Add the following settings in the User settings editor:
apm.enabled: true
apm.server_url: "<apm_server_url>"
apm.secret_token: "<apm_secret_token>"Replace <apm_server_url> with the APM Server endpoint and <apm_secret_token> with the secret token you copied from Step 2 ("Elastic Cloud" section). Scroll down and save the plan change. This will trigger a rolling restart of your Enterprise Search instance(s). There is no expected downtime if you have deployed multiple Enterprise Search instances for high availability.
On-premises
If you are shipping Enterprise Search APM data to an Elastic Cloud APM & Fleet deployment, follow the "Elastic Cloud" instructions above to enable APM integration.
If you are using an on-premises APM Server, add the following settings to the enterprise-search.yml file of your Enterprise Search instance(s):apm.enabled: true
apm.server_url: "<apm_server_url>"
apm.secret_token: "<apm_secret_token>"Replace <apm_server_url> with the server_url and <apm_secret_token> with the secret_token you copied from the Ruby on Rails page in Step 2 ("On-premises" section). Perform a rolling restart of your Enterprise Search instance(s). There is no expected downtime if you have deployed multiple Enterprise Search instances behind a load-balancer or proxy for high availability.
Step 4: Verify successful indexing of Enterprise Search APM data
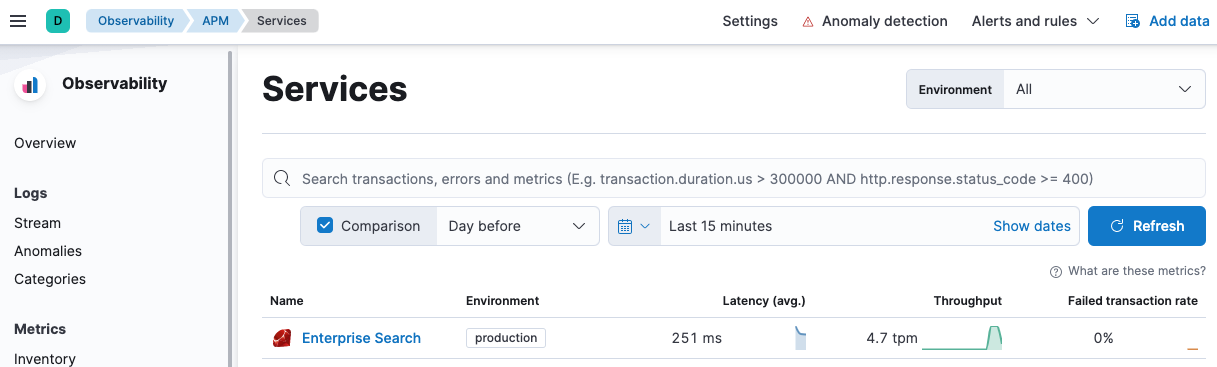
Once you have enabled APM integration in Enterprise Search in Step 3, verify that APM data is being collected for Enterprise Search. From Kibana, click on Observability > APM > Services:
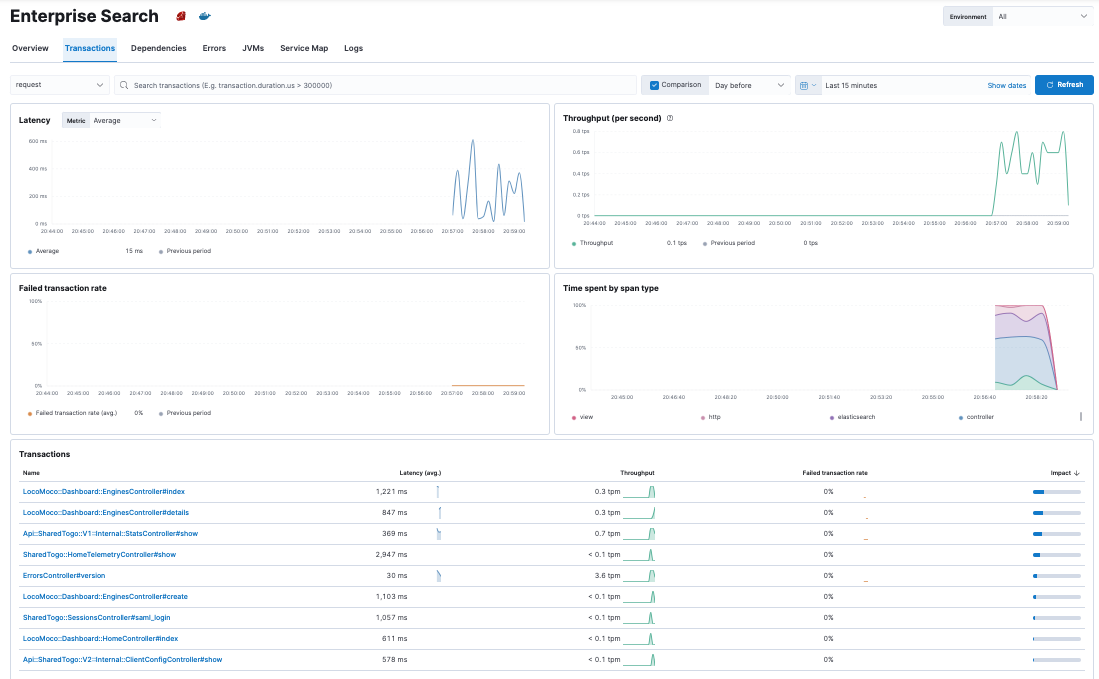
Click on Enterprise Search > Transactions and you will see a list of transactions:
Make sure you are testing using the Kibana instance that is connected to the Elasticsearch cluster your APM Server is indexing to.
If you can see transaction data from the view above, you are all set!
The magic happens!
Elastic APM makes it very easy for Enterprise Search developers to isolate where things are slow.
For example, to troubleshoot search request latency in Enterprise Search's App Search, click on the LocoMoco::Api::V1::QueryController#search transaction name under Observability > APM > Services > Enterprise Search > Transactions: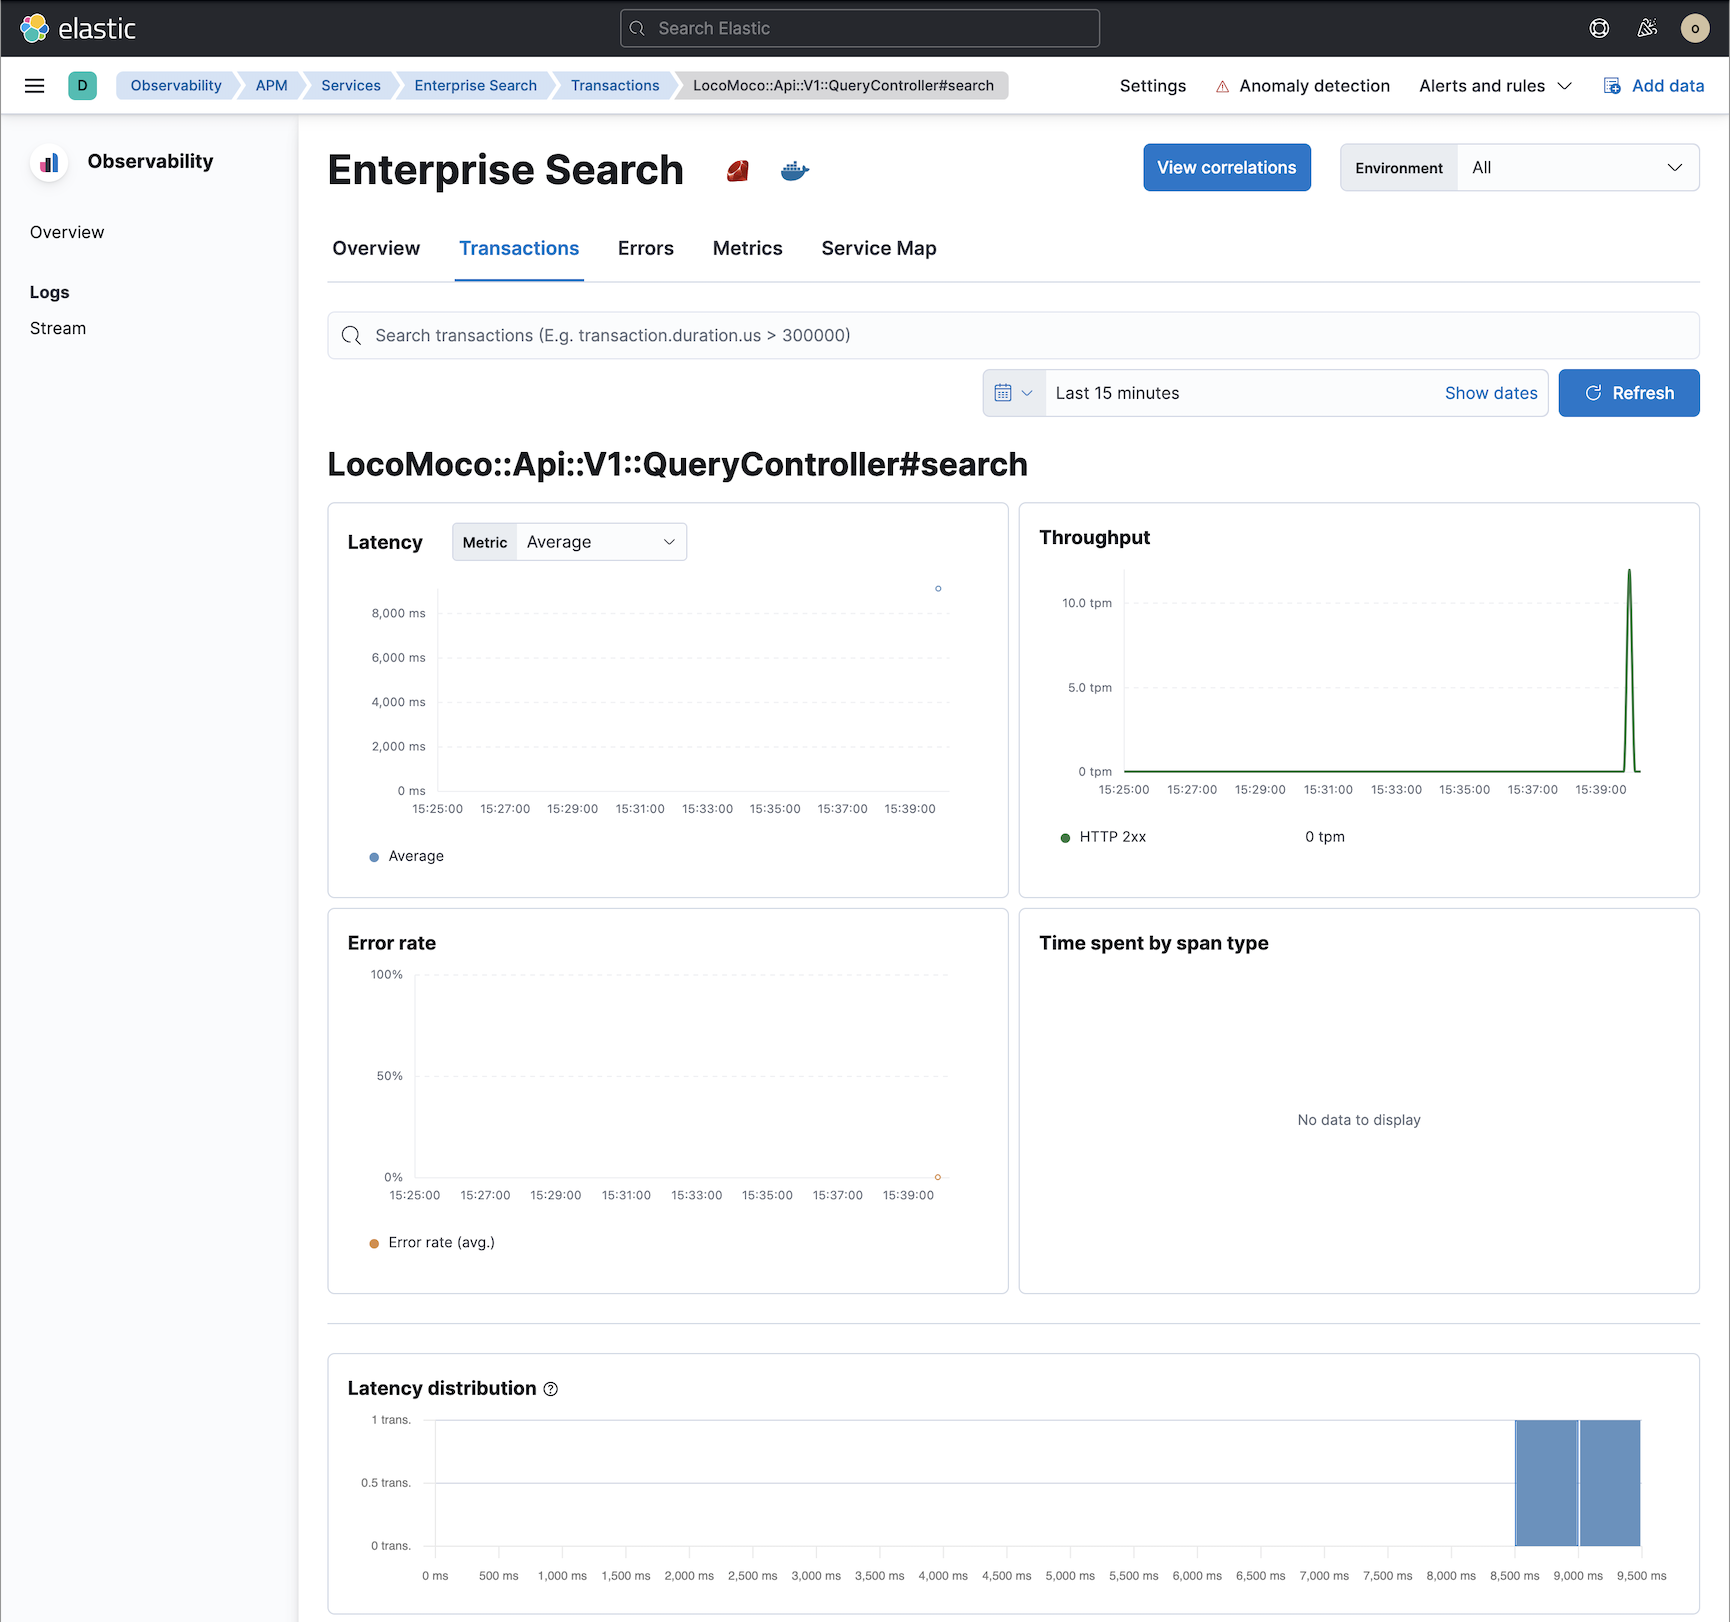
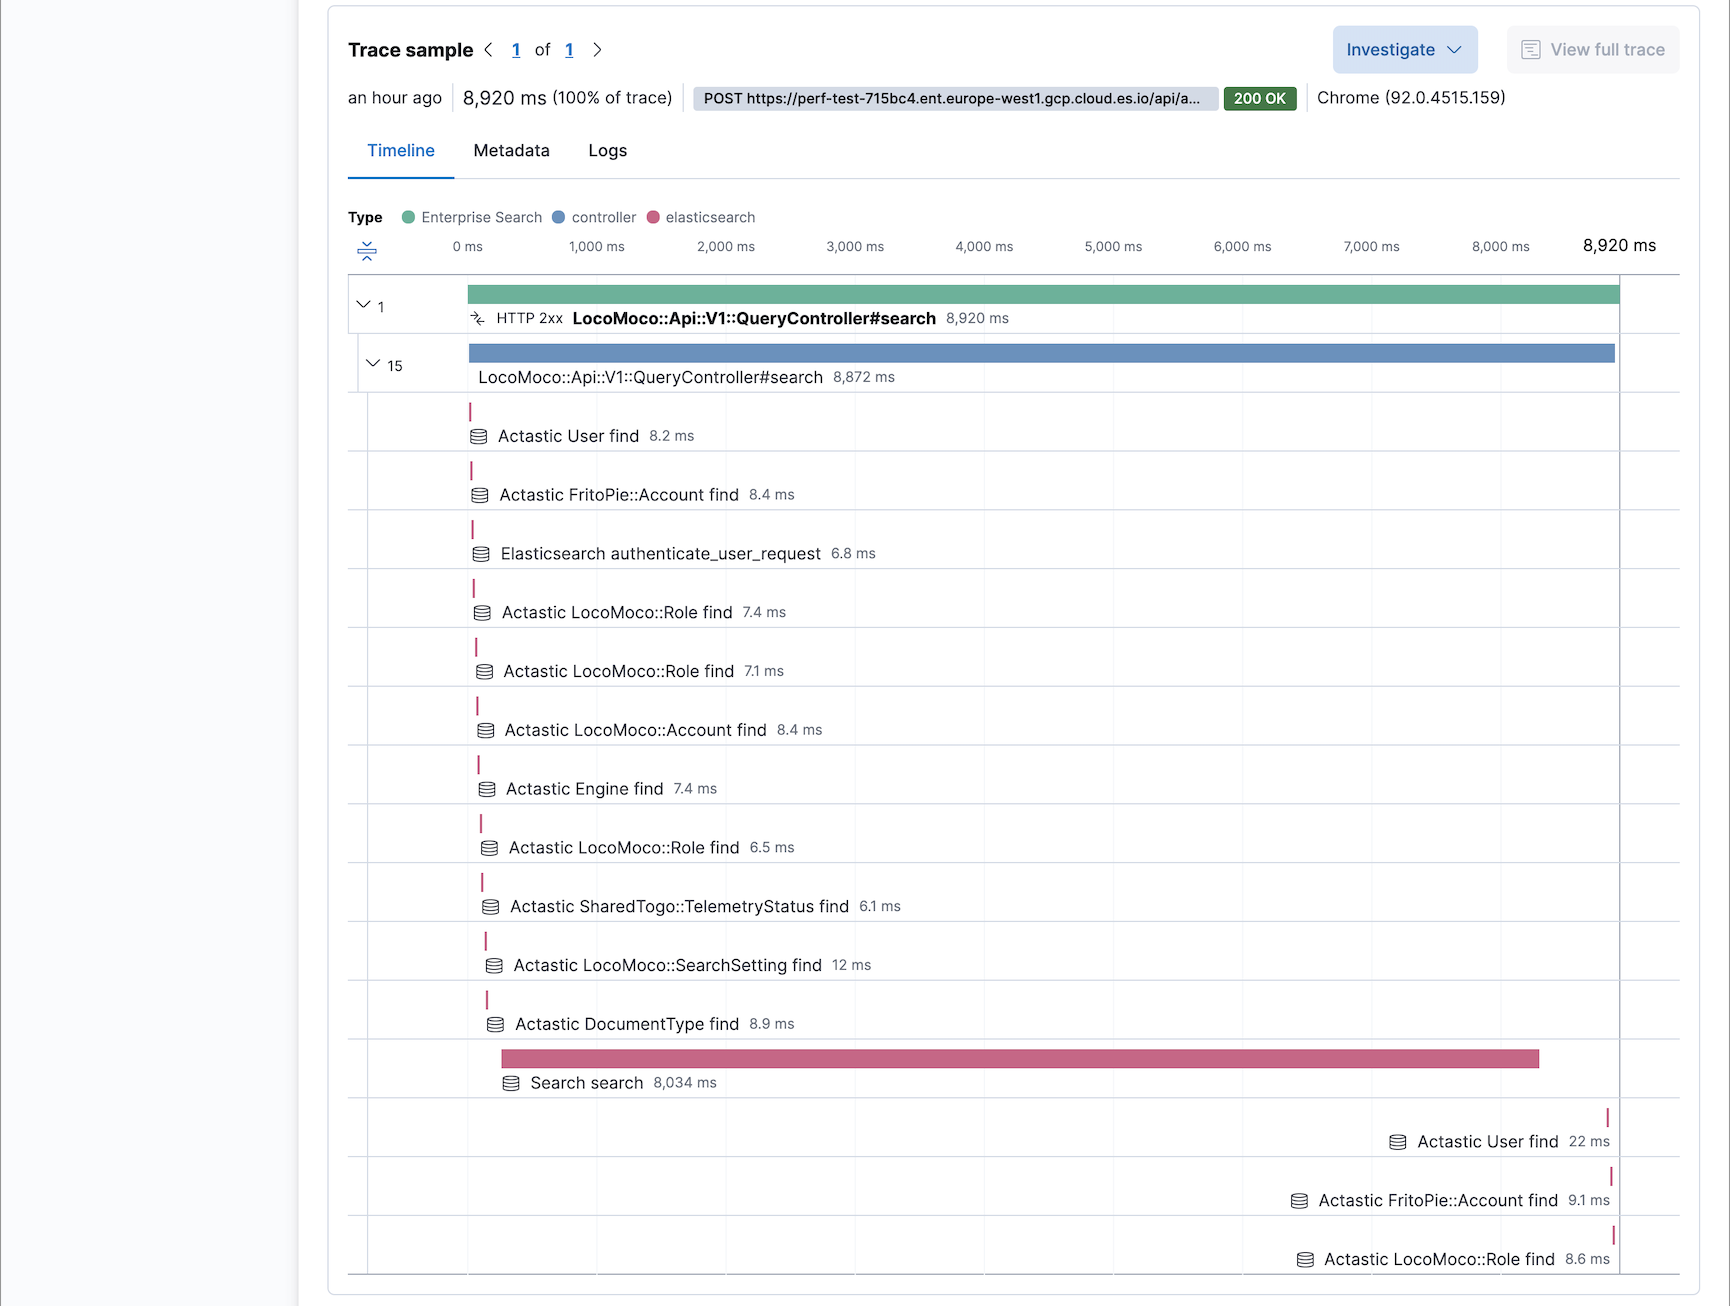
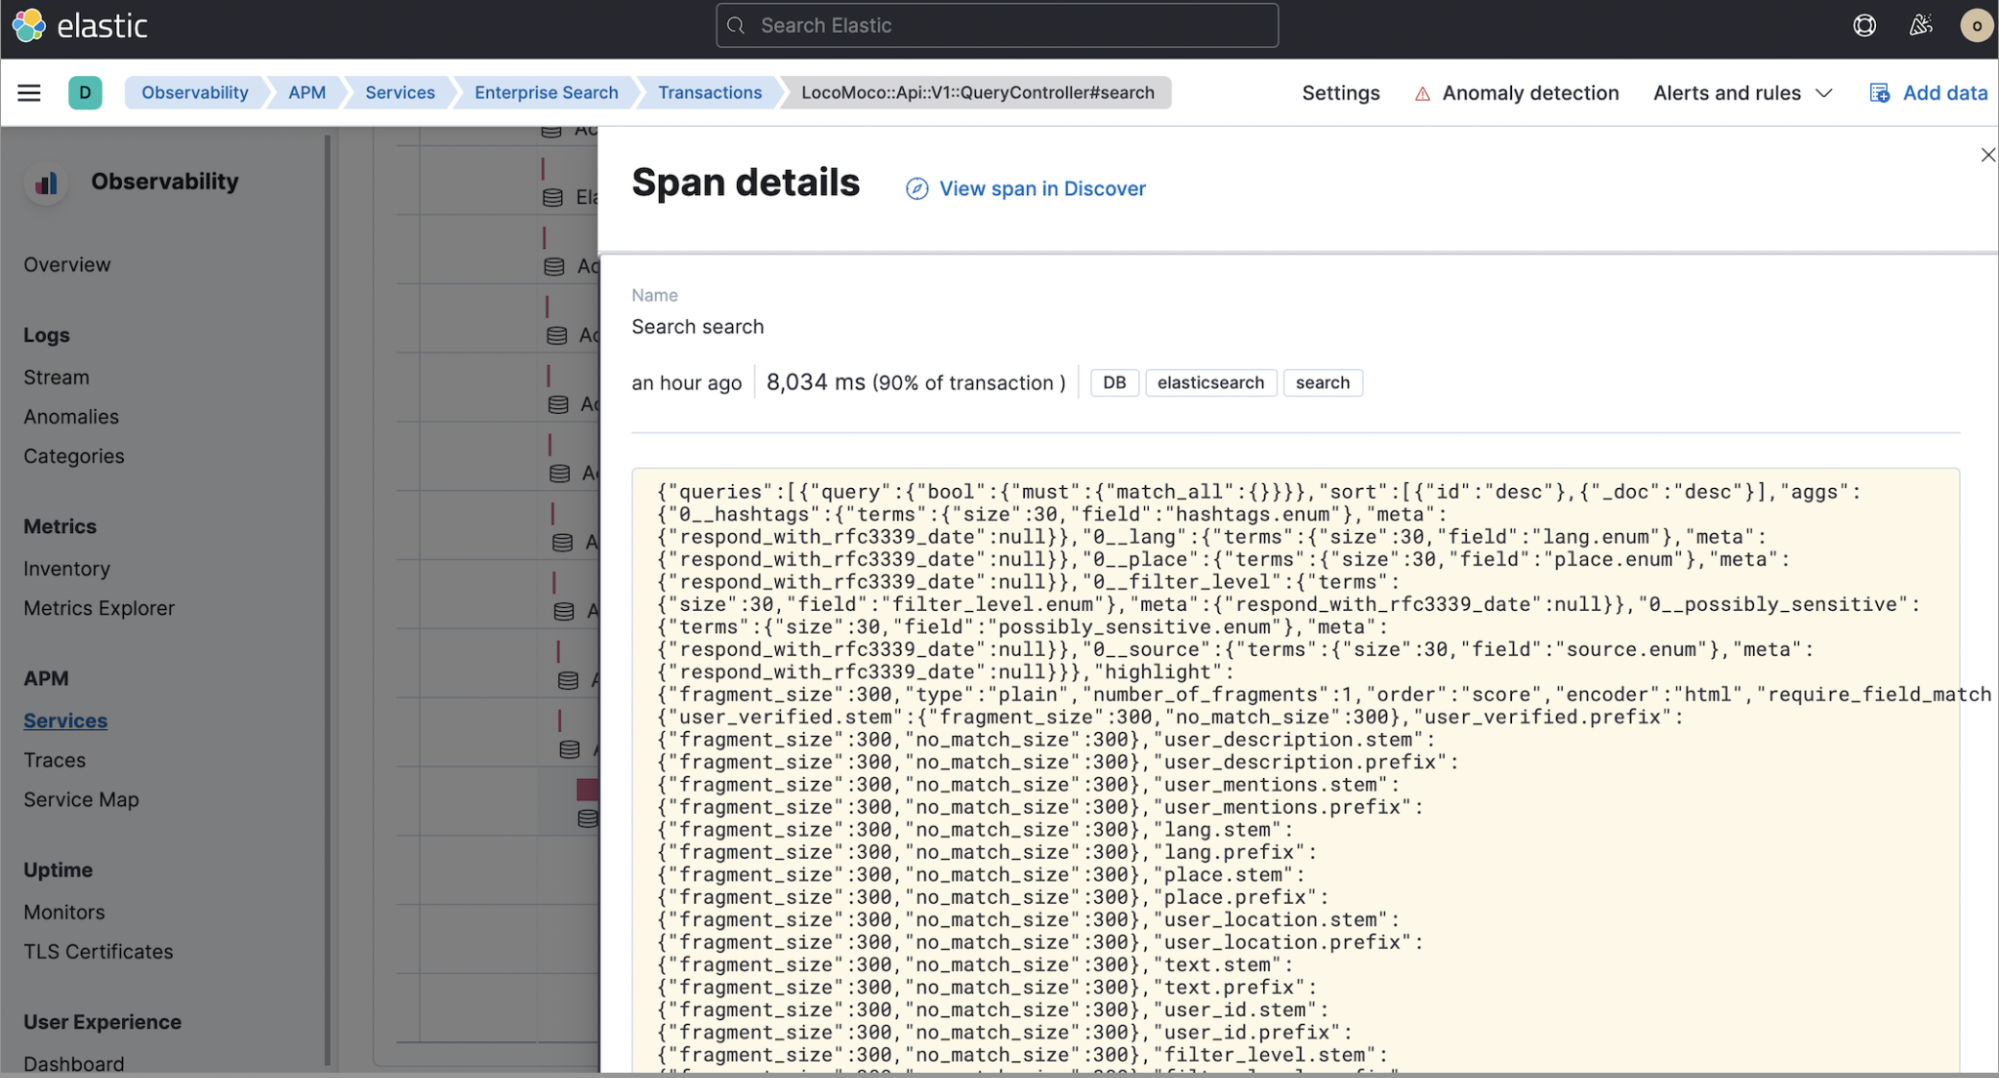
The Trace sample reveals that the majority of the LocoMoco::Api::V1::QueryController#search duration (8034ms) was spent executing an Elasticsearch query. Clicking on the "Search search 8,034ms" Elasticsearch entry provides detailed information on the transaction span and the underlying Elasticsearch request sent by Enterprise Search:
For more information on viewing APM transactions in Kibana, see the documentation.
With Elastic APM enabling Enterprise Search developers to quickly pinpoint where things are slow, we can now focus on advanced Elasticsearch performance troubleshooting to proactively speed up App Search requests.
Share
- Share on Twitter
Share on Twitter
- Share on LinkedIn
Share on LinkedIn
- Share on Facebook
Share on Facebook
- Share by Email
Share by Email
- Print this page
Print