Kubernetes observability tutorial: Log monitoring and analysis
Kubernetes has emerged the de facto container orchestration technology, and an integral technology in the cloud native movement. Cloud native brings speed, elasticity, and agility to software development, but also increases the complexity — with hundreds of microservices on thousands (or millions) of containers, running in ephemeral and disposable pods. Monitoring such a complex, distributed, transient system is challenging, and at the same time very critical. Fortunately, Elastic makes it easy to bring observability to your Kubernetes environment.
In this Kubernetes observability tutorial series, we will explore how you can monitor all aspects of your applications running in Kubernetes, including:
- Ingesting and analysing logs
- Collecting performance and health metrics
- Monitoring application performance with Elastic APM
At the end of this tutorial, you will have a working example of an application that’s shipping all of its observability data to the Elastic Stack for monitoring and analysis.
Why choose Elastic Observability for Kubernetes?
Observability relies on three “pillar” data pieces: logs, metrics, and application performance monitoring (or APM for short). There is no shortage of articles that map different tools and vendors to piece together the “best of breed” monitoring for Kubernetes, Frankenstein-ing together 3-6 different tools, vendors, and technologies…
Fear not. Elastic Observability combines your logs, metrics, and APM data for unified visibility and analysis using one tool. Start troubleshooting based on a user-facing latency anomaly in APM data (detected by machine learning), pivot to metrics of a particular Kubernetes pod, look at the logs generated by that pod, and correlate them with metrics and logs describing the events occurring on the host and network — all while staying in the same user interface. Now, that is observability done right!
And while it makes it simple for users, there's a lot going on in the background because...
Kubernetes logs are moving targets
Kubernetes performs orchestration by deploying containers into available hosts. This natively distributes the application components across different hosts, making it impossible to know upfront where the component is going to land.
Containers running within Kubernetes pods produce logs as stdout or stderr. These logs are written to a location known to kubelet as files named after the pod id. In order to link the logs to the component or pod that produced them, users need to find out what component pods are running on the current host and what their ids are.
Adding more complexity, Kubernetes may decide to scale the application in or out, and as a result, the pod count representing the application component may change.
Luckily, Filebeat loves a moving target
All we need in order to collect pod logs is Filebeat running as a DaemonSet in our Kubernetes cluster. Filebeat can be configured to communicate with the local kubelet API, get the list of pods running on the current host, and collect the logs the pods are producing. Those logs are annotated with all the relevant Kubernetes metadata, such as pod id, container name, container labels and annotations and so on.
Filebeat uses these annotations to discover what kind of components are running in the pod and can decide which logging module to apply to the logs it is processing. Look ma, no hands! Ingesting Kubernetes logs with Filebeat is super easy. Ok, we're about to get started, but one quick (and large) note before we do:
| Before you get started: The following tutorial relies on having a Kubernetes environment setup. We’ve created a supplementary blog that walks you through the process of setting up a single-node Minikube environment with a demo application to run the rest of the activities. |
Collecting Kubernetes logs with Filebeat
We’ll be using Elasticsearch Service on Elastic Cloud. However, everything described here can work with Elastic clusters deployed on your own infrastructure, whether you self-manage or use orchestration systems like Elastic Cloud Enterprise (ECE) or Elastic Cloud on Kubernetes (ECK). The code for this tutorial is available in the following GitHub repo: http://github.com/michaelhyatt/k8s-o11y-workshop
Deploying Filebeat as a DaemonSet
Only one instance of Filebeat should be deployed per Kubernetes host. Once deployed, Filebeat communicates with the host via the kubelet API to retrieve information about the pods that are running, all the metadata annotations, as well as the location of the log files.
The deployment configuration of the DaemonSet is defined in the file $HOME/k8s-o11y-workshop/filebeat/filebeat.yml. Let's have a closer look at the deployment descriptor part representing the Filebeat configuration.
This part increases the overall number of possible fields to 5000 from the default 1000. Kubernetes deployments can introduce a large number of labels and annotations that result in schema fields that may exceed the default 1000.
setup.template.settings:
  index.mapping.total_fields.limit: 5000
Settings for auto-discovery mechanism instruct Filebeat to use Kubernetes autodiscovery and rely on hint driven autodiscovery that works on annotations.
filebeat.autodiscover:
 providers:
   - type: kubernetes
     host: ${NODE_NAME}
     hints.enabled: true
The next session defines the processor chain that will be applied to all the logs captured by this Filebeat instance. First, it will enrich the event with the metadata coming from Docker, Kubernetes, host and the cloud providers. Then, there is a drop_event section that filters out messages based on the content and some of the metadata fields created by preceding processors. This is useful when there is a noisy event type that keeps dominating the logs. Notice how logical and and or are being used to construct the match condition.
processors:
  - add_cloud_metadata:
  - add_host_metadata:
  - add_docker_metadata:
  - add_kubernetes_metadata:
  - drop_event:
      when:
        or:
        - contains:
            message: "OpenAPI AggregationController: Processing item k8s_internal_local_delegation_chain"
        - and:
          - equals:
              kubernetes.container.name: "metricbeat"
          - contains:
              message: "INFO"
          - contains:
              message: "Non-zero metrics in the last"
        - and:
          - equals:
              kubernetes.container.name: "packetbeat"
          - contains:
              message: "INFO"
          - contains:
              message: "Non-zero metrics in the last"
        - contains:
            message: "get services heapster"
        - contains:
            kubernetes.container.name: "kube-addon-manager"
        - contains:
            kubernetes.container.name: "dashboard-metrics-scraper"
Filebeat modules and autodiscovery using annotations
We saw above how autodiscovery will get the appropriate module applied to the stdout/stderr to parse them as a module-specific format. Learn more about autodiscovery in the Filebeat docs.
Now, let’s see how different components in our sample application are configured to work with Kubernetes hint-based autodiscovery.
NGINX example
Here is the code snippet from $HOME/k8s-o11y-workshop/nginx/nginx.yml instructs Filebeat to treat the logs from this pod as NGINX logs, where stdout represents access log, and stderr represents error log:
annotations:
  co.elastic.logs/module: nginx
  co.elastic.logs/fileset.stdout: access
  co.elastic.logs/fileset.stderr: error
Handling multiline application logs
Another example of hint based auto-discovery is configuring Filebeat to treat petclinic multiline log entries as a single log event. This is useful when components log multiline messages, such as Java stack traces that represent a single event, but will be by default treated as a single event per line delimited by the end of the line.
Here is a snippet from $HOME/k8s-o11y-workshop/petclinic/petclinic.yml that represents multiline event handling configuration that is understood by Filebeat using hint based autodiscovery:
annotations:
  co.elastic.logs/multiline.pattern: '^[0-9]{4}-[0-9]{2}-[0-9]{2}'
  co.elastic.logs/multiline.negate: "true"
  co.elastic.logs/multiline.match: "after"
Learn more on multiline event handling in the Filebeat docs.
Analysing Kubernetes logs in the Elastic Stack
Now that the logs have been ingested into Elasticsearch, this is the time to put them to good use.
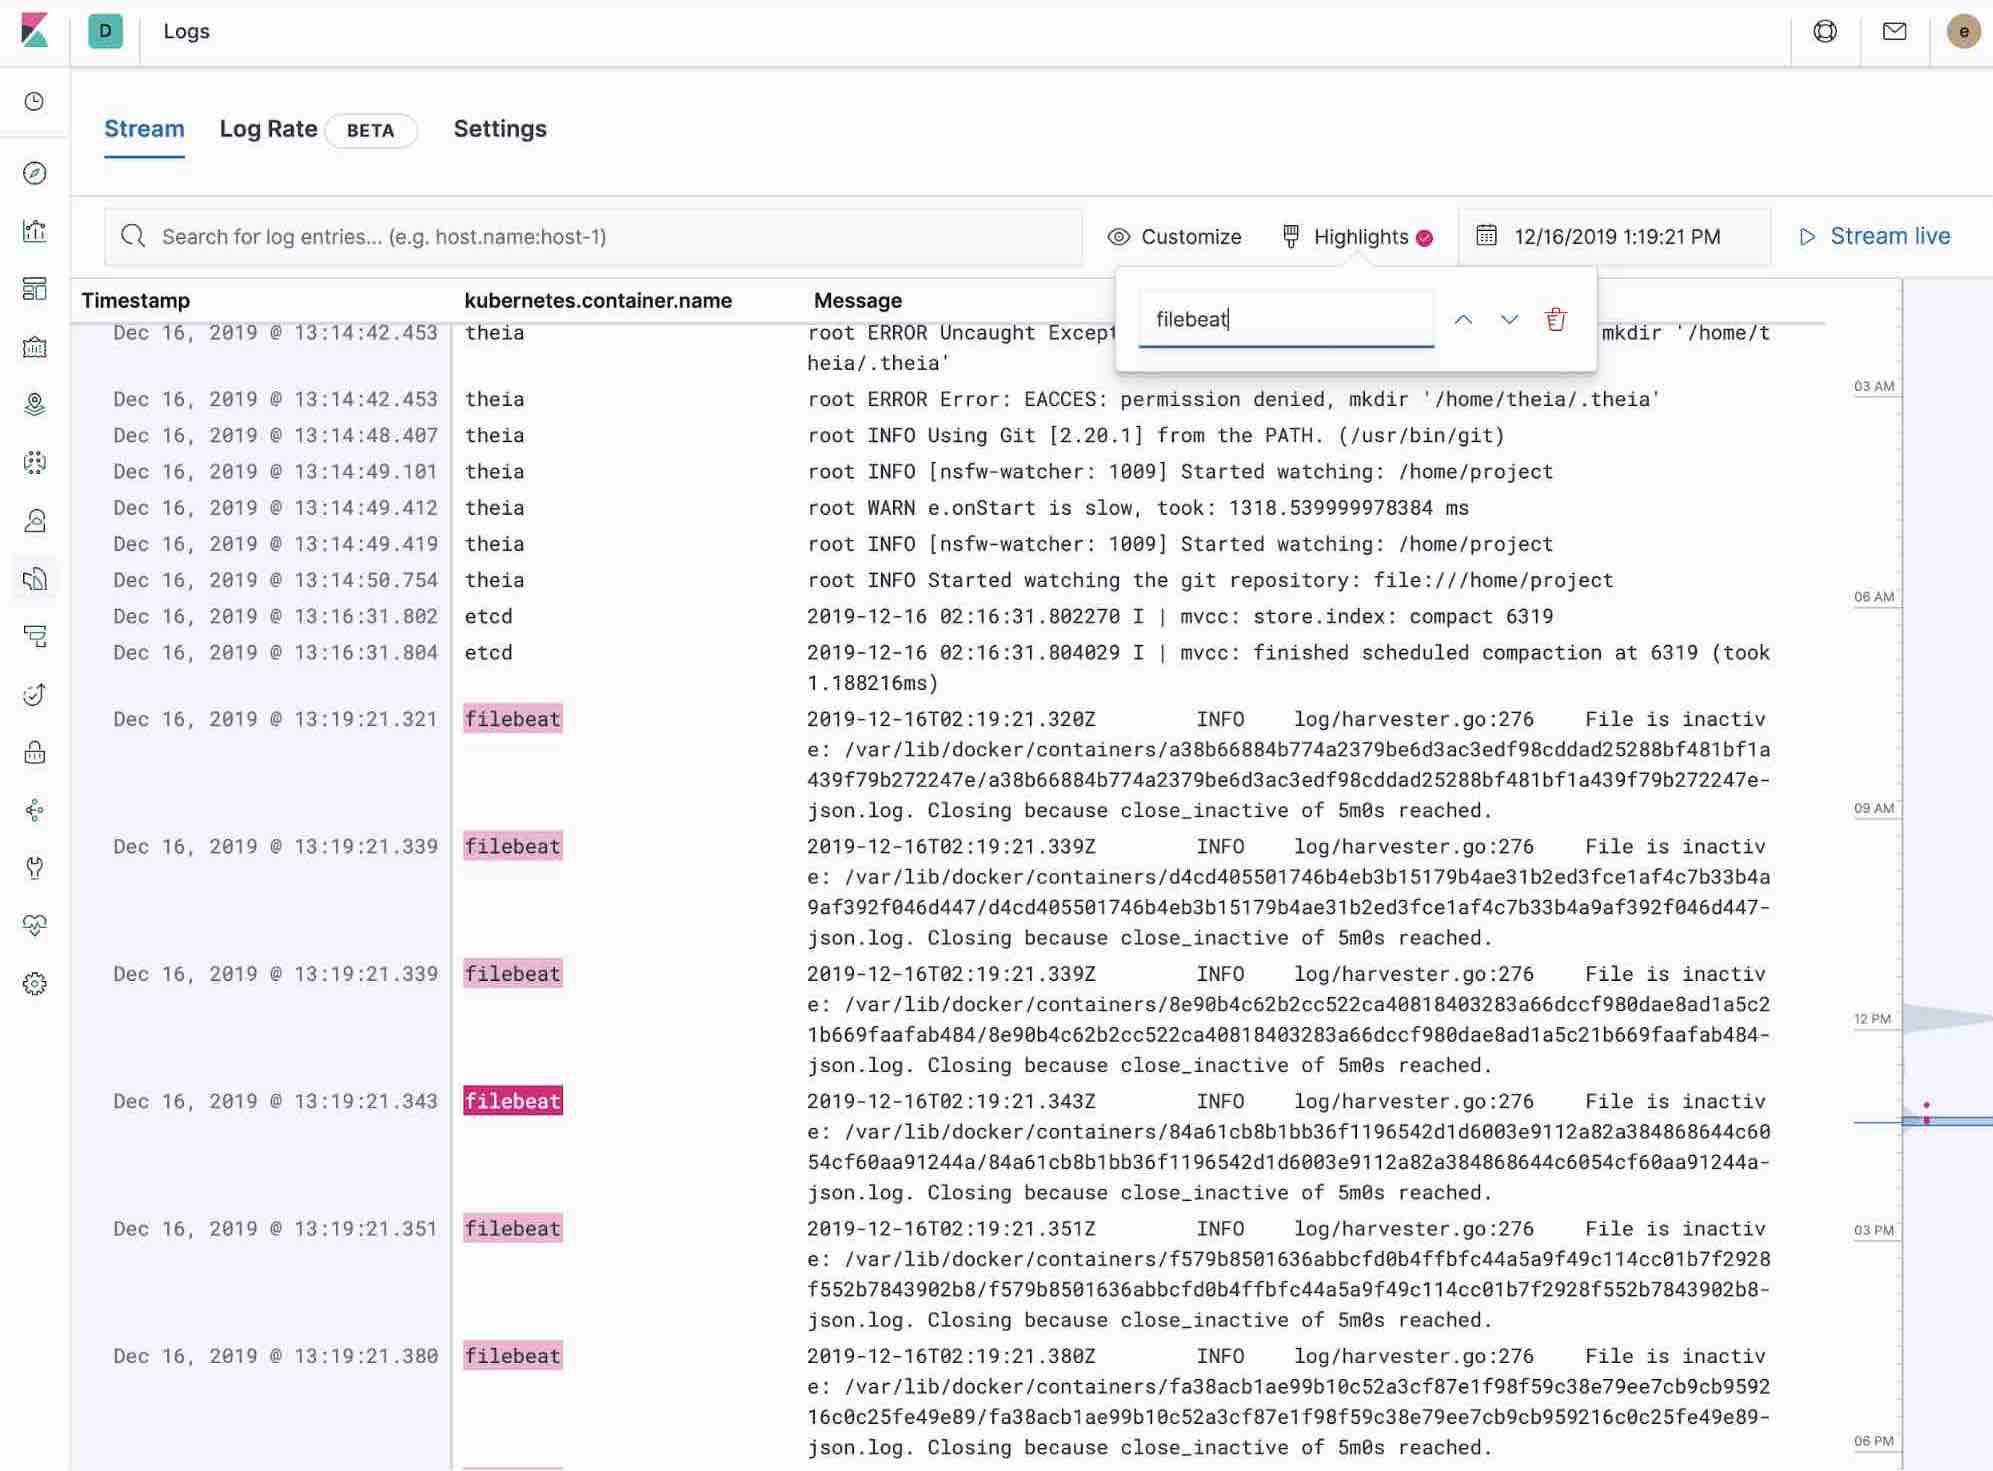
Using the Logs app in Kibana
The Logs app in Kibana allows you to search, filter and tail all the logs collected into Elastic Stack. Instead of having to ssh into different servers, having to cd into the directory and tail individual files, all the logs are available in one tool under Logs app.
- Check out filtering logs using the keyword or plain text search.
- You can move back and forth in time using the time picker or the timeline view on the side.
- If you just want to watch the logs update in front of you tail -f style, click on the Streaming button and use highlighting to accentuate that important bit of the info you are waiting to see.
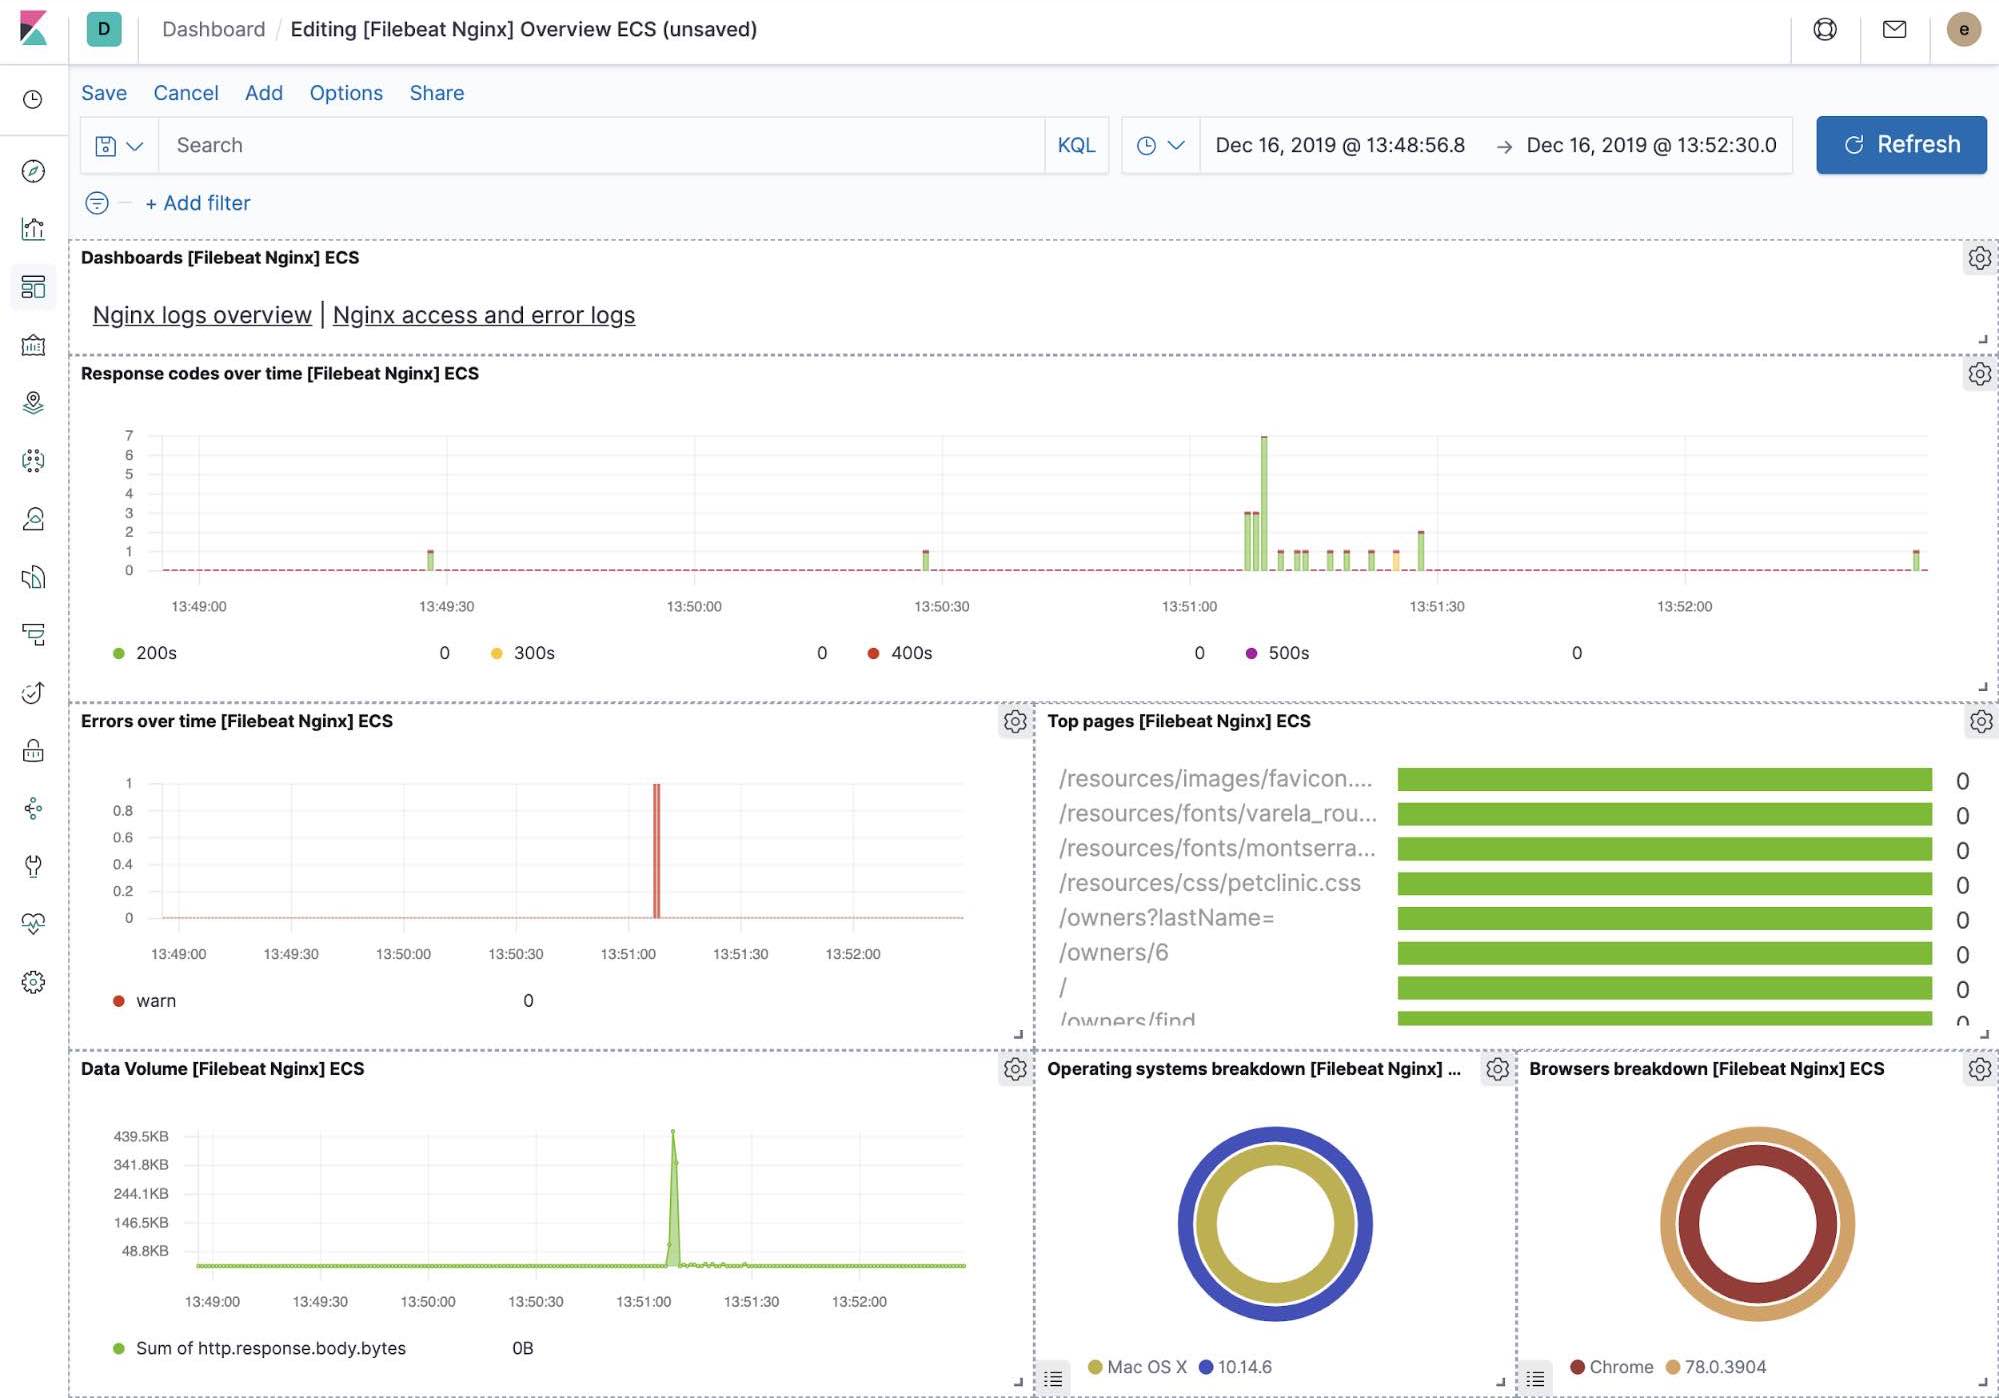
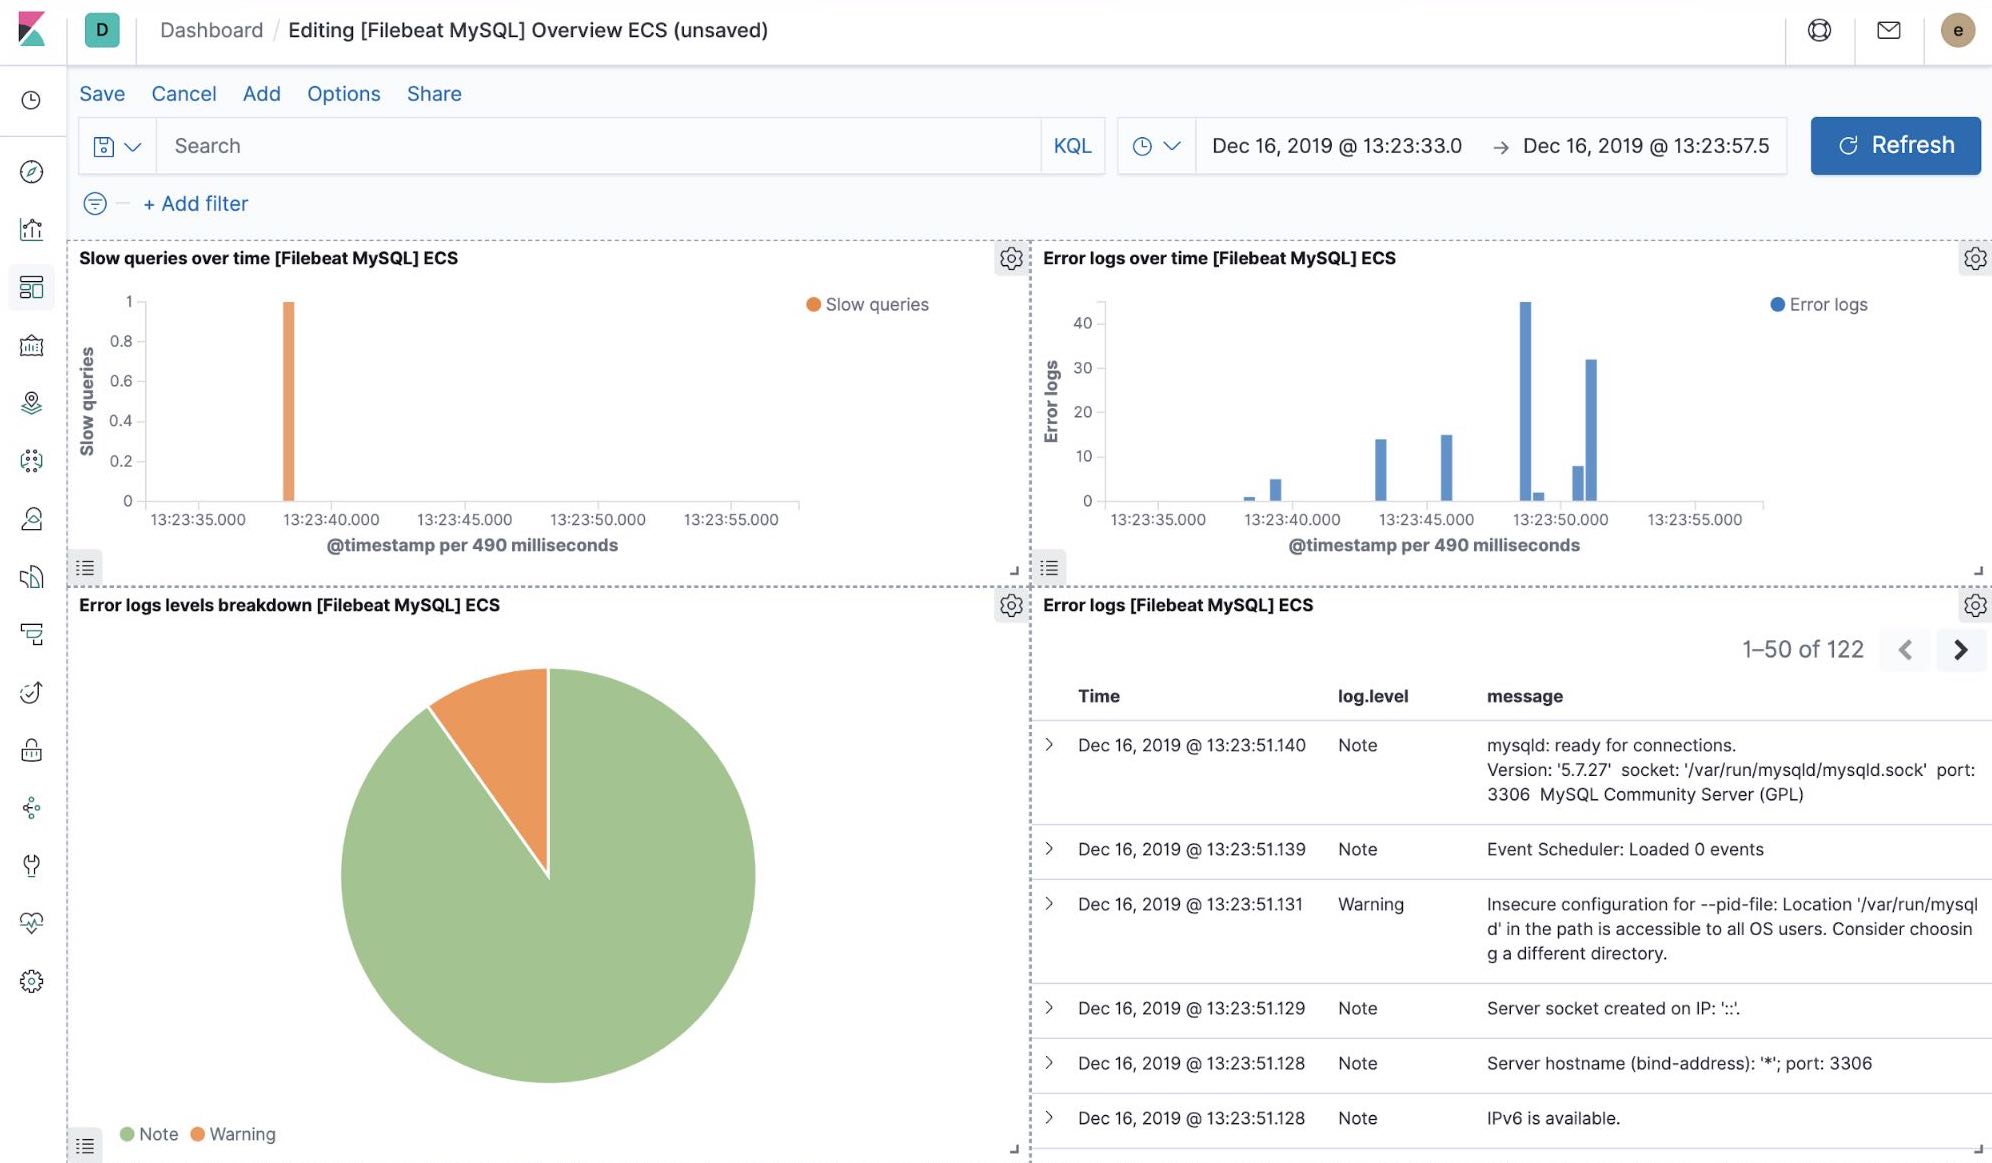
Out-of-the-box Kibana visualisations
When we run the filebeat-setup job, among other things, it pre-created a set of out-of-the-box dashboards in Kibana. Once our sample petclinic application is finally deployed, we can navigate to the out of the box Filebeat dashboards for MySQL, NGINX and see that Filebeat modules not only capture logs but can also capture metrics that the components log. Enabling these visualisations requires running MySQL and NGINX components of the example application.
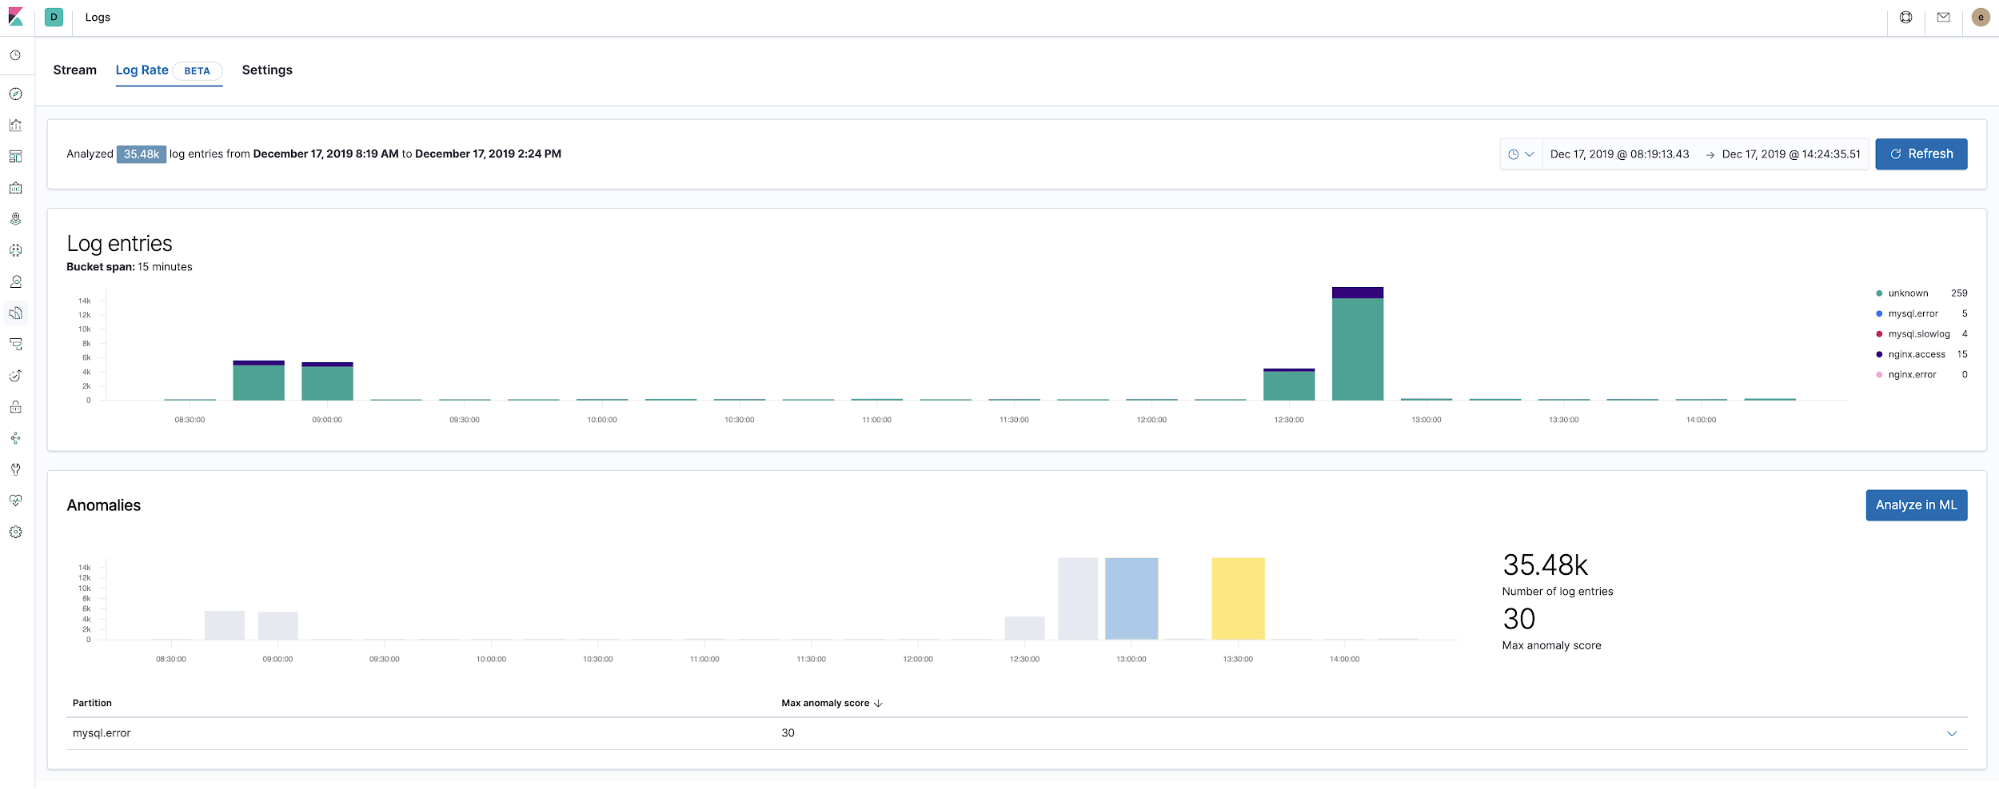
Machine learning and detecting logging anomalies
Starting with version 7.5, the Elastic Stack can detect anomalies in the log rate of application components. This can be used to detect things like:
- A new application or log source was just on-boarded
- Logging activity suddenly went up due to a promotion (or attack!)
- Log shipping suddenly stopped, perhaps due to an agent or ingest pipeline malfunction
We introduced the log rate anomalies feature right in the Logs app, which enables operators to get instant answers to the questions above. Enable it with a single click in Logs app.
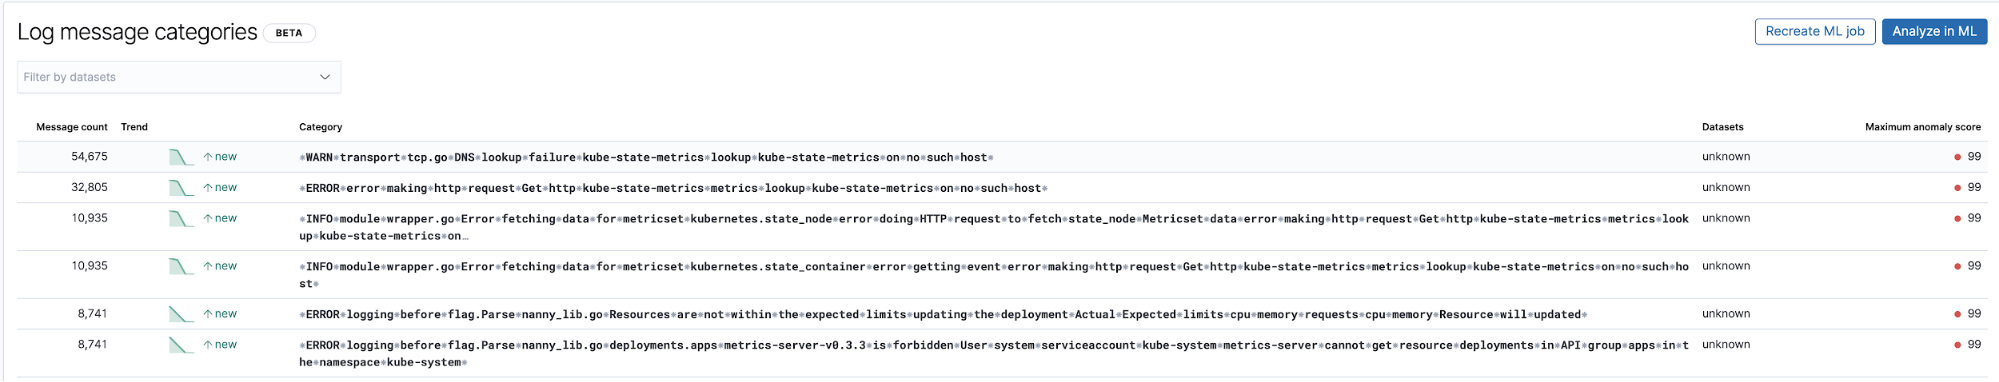
Detecting unknown unknowns with log entries classification
Another useful application of machine learning related to logs is detecting new log type entries that were not observed before. At the very high level, machine learning is stripping all the numeric and variable parts from the log entries, such as timestamps, numeric values, etc, captures what is left and performs categorisation of the fixed parts of the logged entries. Then, it tries to group them into buckets and continues to flag new buckets appearing as anomalies representing the log entries that were not seen before.
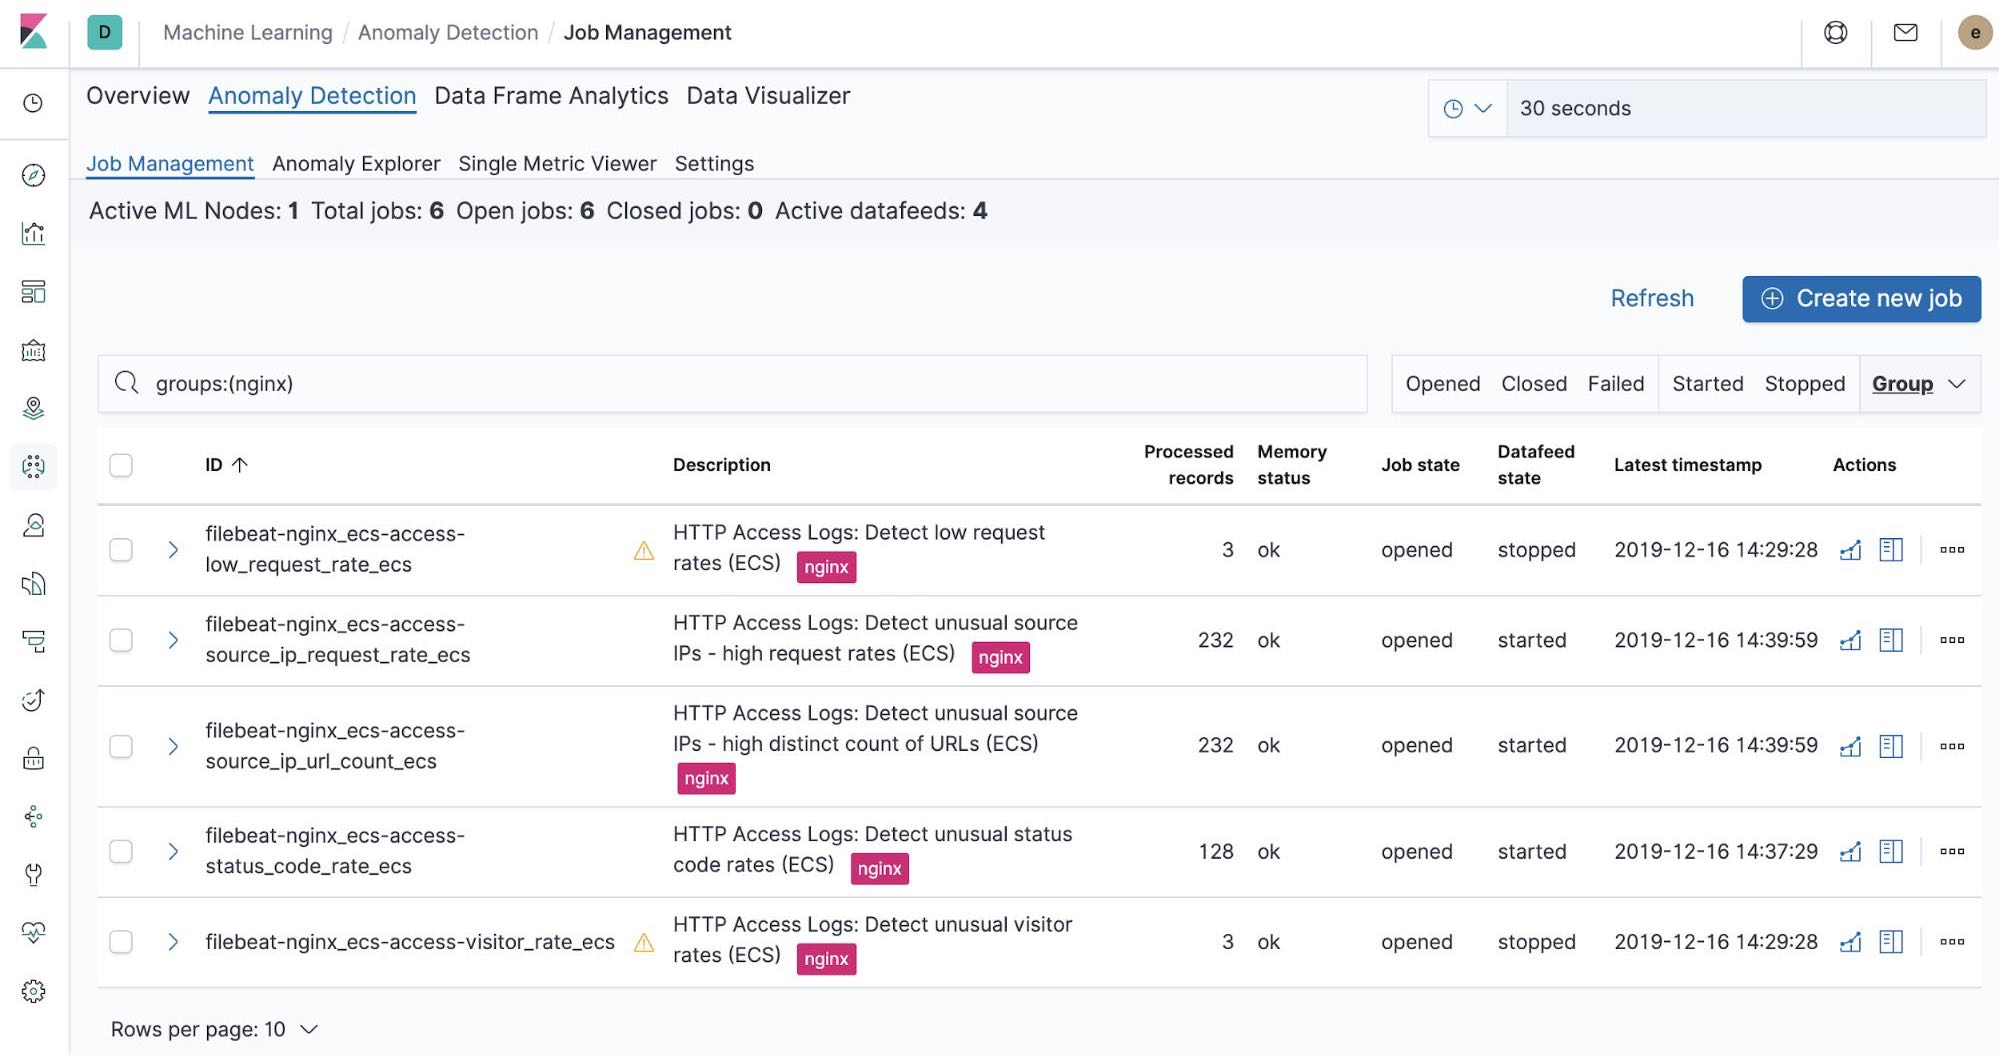
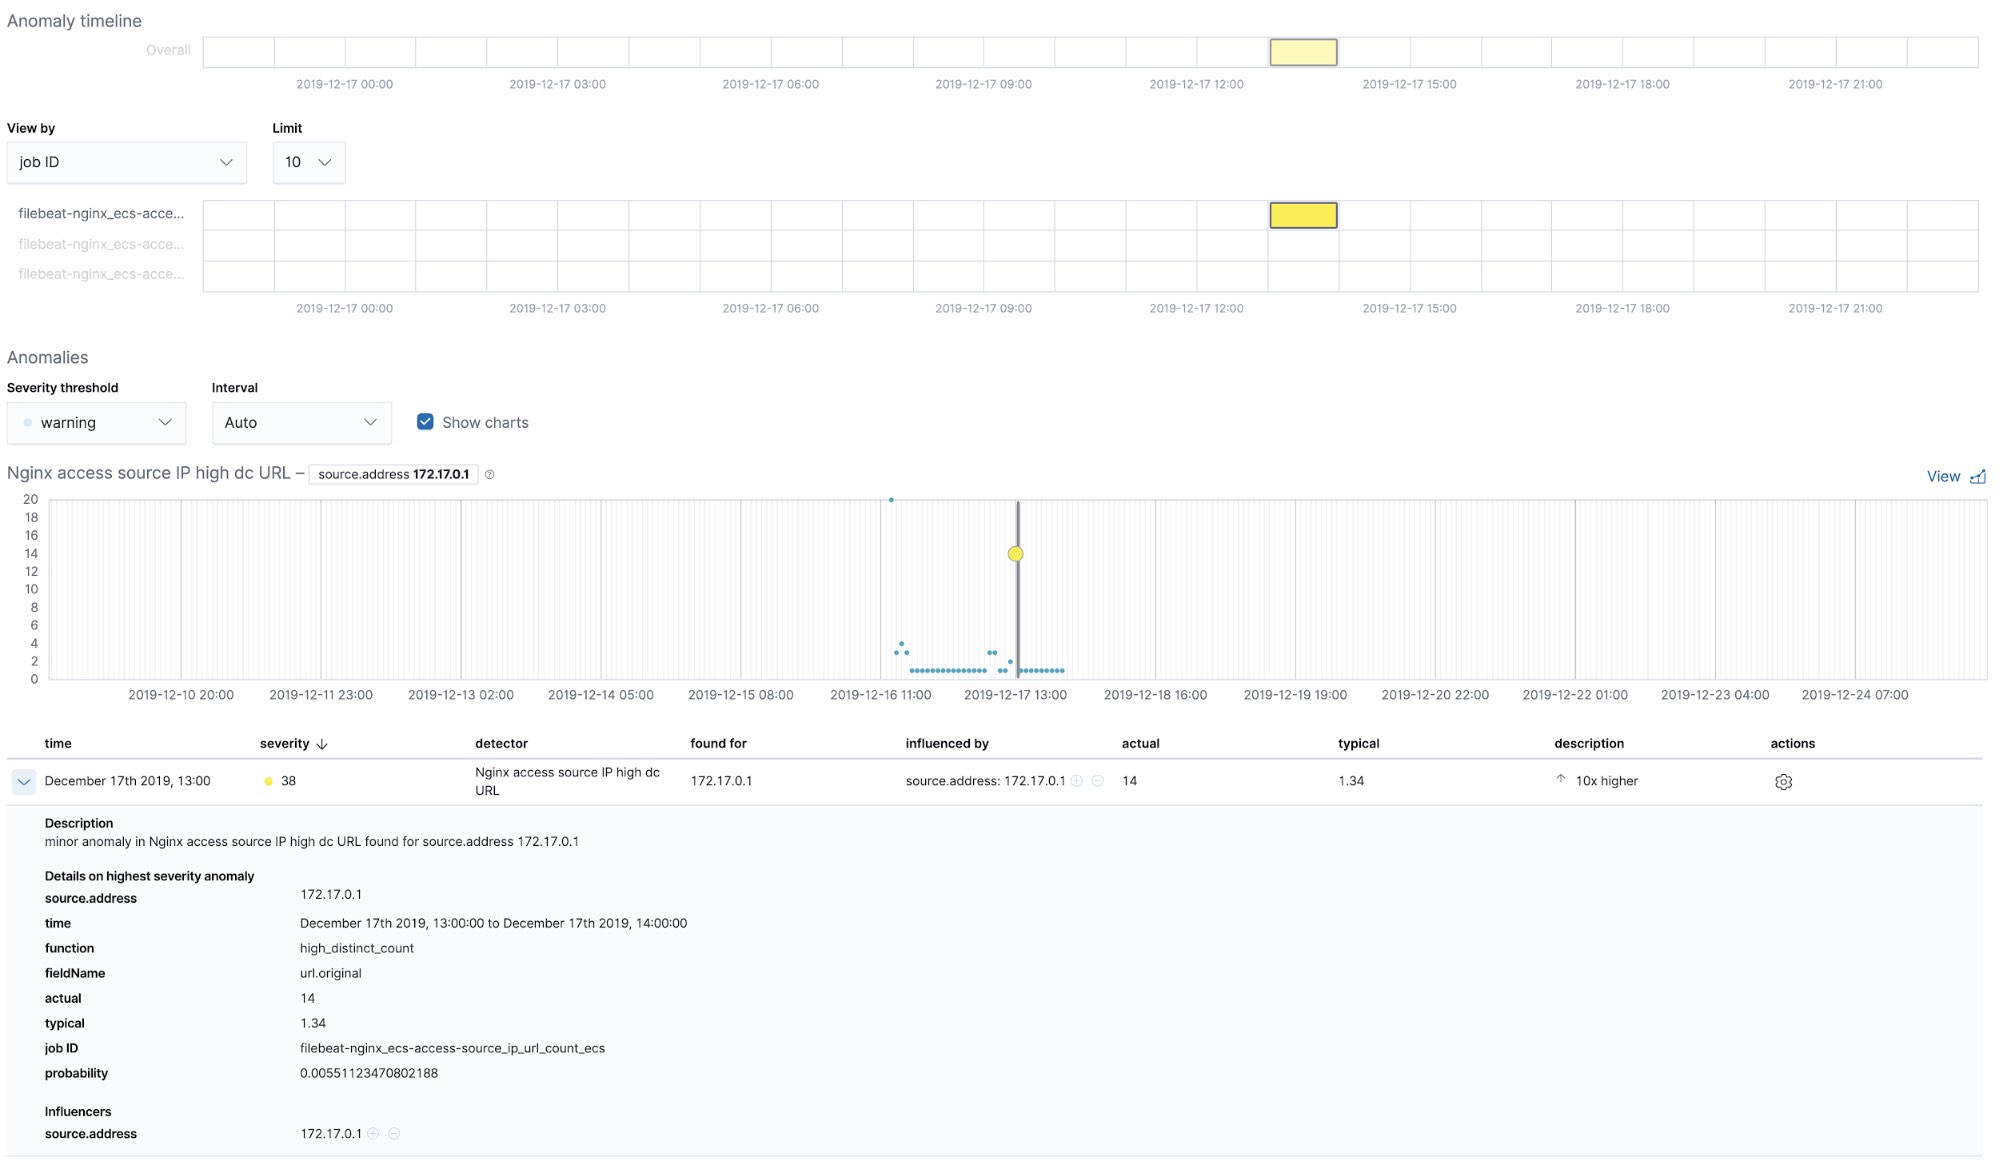
Out-of-the-box machine learning jobs — NGINX
At the time when we run the filebeat-setup job, it pre-created the out of the box machine learning jobs. If activated, they can start detecting anomalies in the NGINX stdout and stderr data ingested from Filebeat.
Summary
In this part, we ingested Kubernetes logs into Elastic Stack using Filebeat and its modules. You can get started log monitoring your systems and infrastructure today by signing up for a free trial of Elasticsearch Service on Elastic Cloud, or downloading the Elastic Stack and hosting it yourself. Once you are up and running, monitor the availability of your hosts with Elastic Uptime, and instrument the applications running on your hosts with Elastic APM. You'll be on your way to a fully observable system, completely integrated with your new metrics cluster. If you run into any hurdles or have questions, jump over to our Discuss forums or understand why Elastic Stack is a top choice for application search in the most diverse industries.