Kubernetes observability tutorial: Metrics collection and analysis
This post is the second in our Kubernetes observability tutorial series, where we explore how you can monitor all aspects of your applications running in Kubernetes, including:
- Ingesting and analysing logs
- Collecting performance and health metrics
- Monitoring application performance with Elastic APM
We’ll cover using Elastic Observability to ingest and analyze container metrics in Kibana using the Metrics app and out-of-the-box dashboards.
Collecting metrics from Kubernetes
Similar to the moving target of Kubernetes logs, collecting metrics from Kubernetes can pose a challenge for a few reasons:
- Kubernetes runs components on different hosts that need to be monitored by collecting metrics like CPU, memory, disk utilisation, and disk and network I/O.
- The Kubernetes containers, which are sort of mini-VMs, also produce their own set of metrics
- While both application servers and databases can run as Kubernetes pods, each technology has its own way to report the relevant metrics.
Organisations often use a number of technologies to handle metrics collection on Kubernetes which further complicate the task of monitoring their Kubernetes deployments. Here’s where Elastic Observability changes the narrative by combining your logs, metrics, and APM data for unified visibility and analysis using one tool.
K8s metrics collection with Metricbeat
Similar to Filebeat, Metricbeat is the only component we are going to use to collect various metrics from pods running in our Kubernetes cluster, as well as Kubernetes' own cluster metrics. Metricbeat modules provide a quick and easy way to pick up metrics from various sources and shipp them to Elasticsearch as ECS-compatible events, ready to be correlated with logs, uptime and APM data. Metricbeat is simultaneously deployed on Kubernetes in two ways:
- A single pod to collect Kubernetes metrics. This pod uses kube-state-metrics to collect cluster-level metrics.
- A DaemonSet that deploys Metricbeat as a single instance per Kubernetes host to collect metrics from pods deployed on that host. Metricbeat interacts with kubelet APIs to get the components running on that host and uses different methods, such as auto-detection, to further interrogate the components to collect technology-specific metrics.
| Before you get started: The following tutorial relies on having a Kubernetes environment setup. We’ve created a supplementary blog that walks you through the process of setting up a single-node Minikube environment with a demo application to run the rest of the activities. |
Collecting host, Docker, and Kubernetes metrics
Each DaemonSet instance will collect host, Docker and Kubernetes metrics, as defined in the YAML config $HOME/k8s-o11y-workshop/metricbeat/metricbeat.yml:
System (host) metric configuration
system.yml: |-
  - module: system
    period: 10s
    metricsets:
      - cpu
      - load
      - memory
      - network
      - process
      - process_summary
      - core
      - diskio
      # - socket
    processes: ['.*']
    process.include_top_n:
      by_cpu: 5      # include top 5 processes by CPU
      by_memory: 5   # include top 5 processes by memory
  - module: system
    period: 1m
    metricsets:
      - filesystem
      - fsstat
    processors:
    - drop_event.when.regexp:
        system.filesystem.mount_point: '^/(sys|cgroup|proc|dev|etc|host|lib)($|/)'
Docker metric configuration
docker.yml: |-
  - module: docker
    metricsets:
      - "container"
      - "cpu"
      - "diskio"
      - "event"
      - "healthcheck"
      - "info"
      # - "image"
      - "memory"
      - "network"
    hosts: ["unix:///var/run/docker.sock"]
    period: 10s
    enabled: true
Kubernetes metrics configuration
This includes metrics collection from pods deployed onto the host by communicating with kubelet API:
kubernetes.yml: |-
  - module: kubernetes
    metricsets:
      - node
      - system
      - pod
      - container
      - volume
    period: 10s
    host: ${NODE_NAME}
    hosts: ["localhost:10255"]
  - module: kubernetes
    metricsets:
      - proxy
    period: 10s
    host: ${NODE_NAME}
    hosts: ["localhost:10249"]
For more information about Metricbeat modules and data behind the metricsets, check out the Metricbeat documentation.
Collecting Kubernetes state metrics and events
A single instance is deployed to collect Kubernetes metrics. It is integrated with the kube-state-metrics API to monitor state changes of objects managed by Kubernetes. This is the section of the config that defines state_metrics collection. $HOME/k8s-o11y-workshop/Metricbeat/Metricbeat.yml:
kubernetes.yml: |-
  - module: kubernetes
    metricsets:
      - state_node
      - state_deployment
      - state_replicaset
      - state_pod
      - state_container
      # Uncomment this to get k8s events:
      - event
    period: 10s
    host: ${NODE_NAME}
    hosts: ["kube-state-metrics:8080"]
Metricbeat autodiscovery using pod annotations
The Metricbeat DaemonSet deployment has the ability to autodetect the component running in the pod and apply a specific Metricbeat module to collect technology-specific metrics. One of the ways to enable autodiscovery is using pod annotations to indicate which module to apply alongside other module-specific configuration. This section of Metricbeat config enables Kubernetes-based autodiscovery. $HOME/k8s-o11y-workshop/metricbeat/metricbeat.yml:
metricbeat.autodiscover:
  providers:
   - type: kubernetes
     host: ${NODE_NAME}
     hints.enabled: true
There are two components in this tutorial that make use of hint-based autodiscovery:
- NGINX definition $HOME/k8s-o11y-workshop/nginx/nginx.yml
template:
  metadata:
    labels:
      app: nginx
    annotations:
      co.elastic.metrics/module: nginx
      co.elastic.metrics/hosts: '${data.host}:${data.port}'
- MySQL definition $HOME/k8s-o11y-workshop/mysql/mysql.yml
template:
  metadata:
    labels:
      app: mysql
    annotations:
      co.elastic.metrics/module: mysql
      co.elastic.metrics/hosts: 'root:petclinic@tcp(${data.host}:${data.port})/'
See the Metricbeat documentation for more information on hints-based autodiscovery.
Collecting application metrics, Prometheus-style
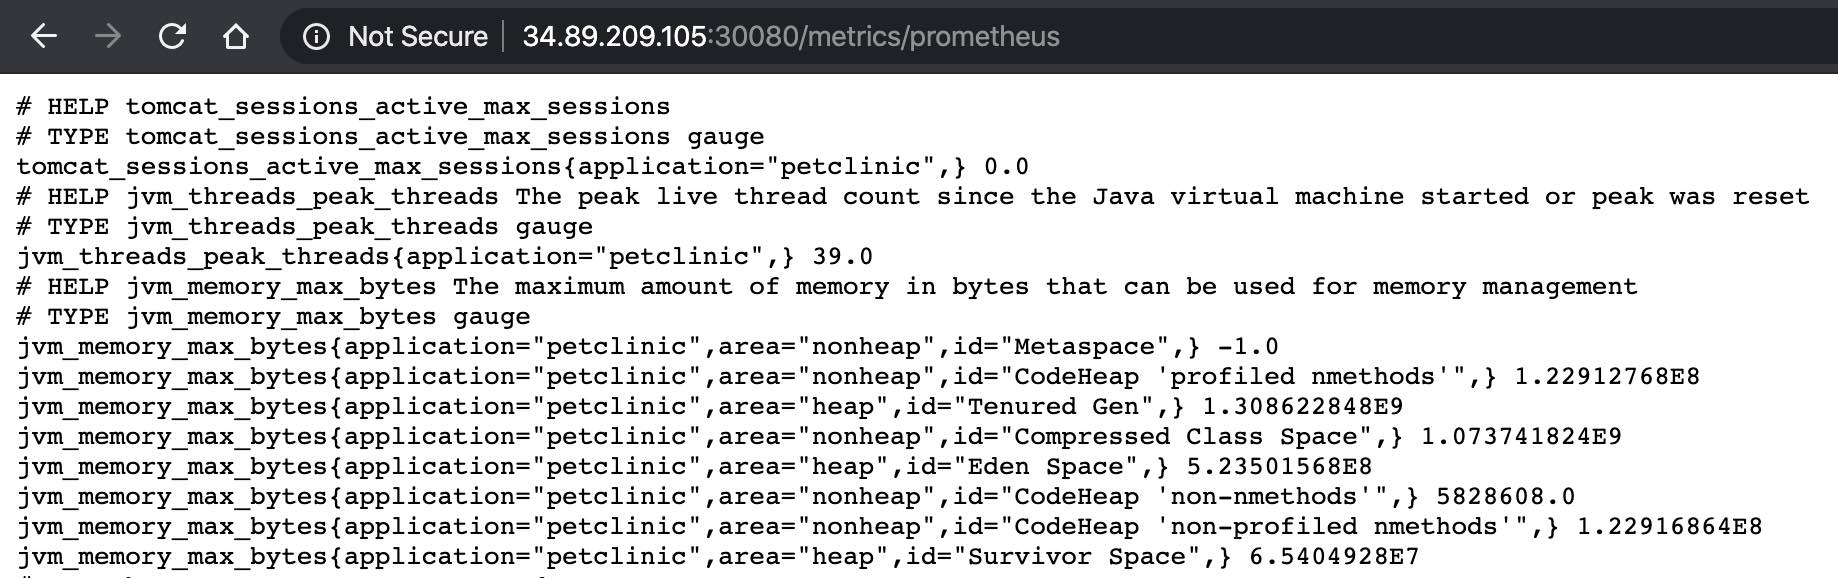
Our Spring Boot petclinic application exposes the whole range of application-specific metrics exposed in a form that can be scraped by Prometheus. You can navigate to the application http endpoint at http://<public-ip>:30080/metrics/Prometheus to see how the metrics are reported in their raw form. However, in our tutorial, we will be using Metricbeat to collect these metrics keeping up with the spirit of just using Elastic components for all our observability needs.
Here is an example of what our application reports:
And here is the configuration of the hints in petclinic YAML deployment config to tell Metricbeat to collect these metrics using the Prometheus module. $HOME/k8s-o11y-workshop/petclinic/petclinic.yml:
template:
  metadata:
    labels:
      app: petclinic
    annotations:
      co.elastic.metrics/module: prometheus
      co.elastic.metrics/hosts: '${data.host}:${data.port}'
      co.elastic.metrics/metrics_path: '/metrics/prometheus'
      co.elastic.metrics/period: 1m
In general, Metricbeat can augment or replace the Prometheus server altogether. If you already have deployed and using Prometheus server, Metricbeat can export the metrics out of the server using Prometheus Federation API, thus providing visibility across multiple Prometheus servers, Kubernetes namespaces and clusters, enabling correlation of Prometheus metrics with Logs, APM and uptime events. If you chose to simplify your monitoring architecture, use Metricbeat to collect Prometheus metrics and ship them straight into Elasticsearch.
Metadata enrichment
All the events collected by Metricbeat are enriched by the following processors. $HOME/k8s-o11y-workshop/metricbeat/metricbeat.yml:
processors:
  - add_cloud_metadata:
  - add_host_metadata:
  - add_kubernetes_metadata:
  - add_docker_metadata:
This allows correlation of metrics with the hosts, Kubernetes pods, Docker containers, and cloud-provider infrastructure metadata and correlation with other pieces of observability puzzle, such as application performance monitoring data and logs.
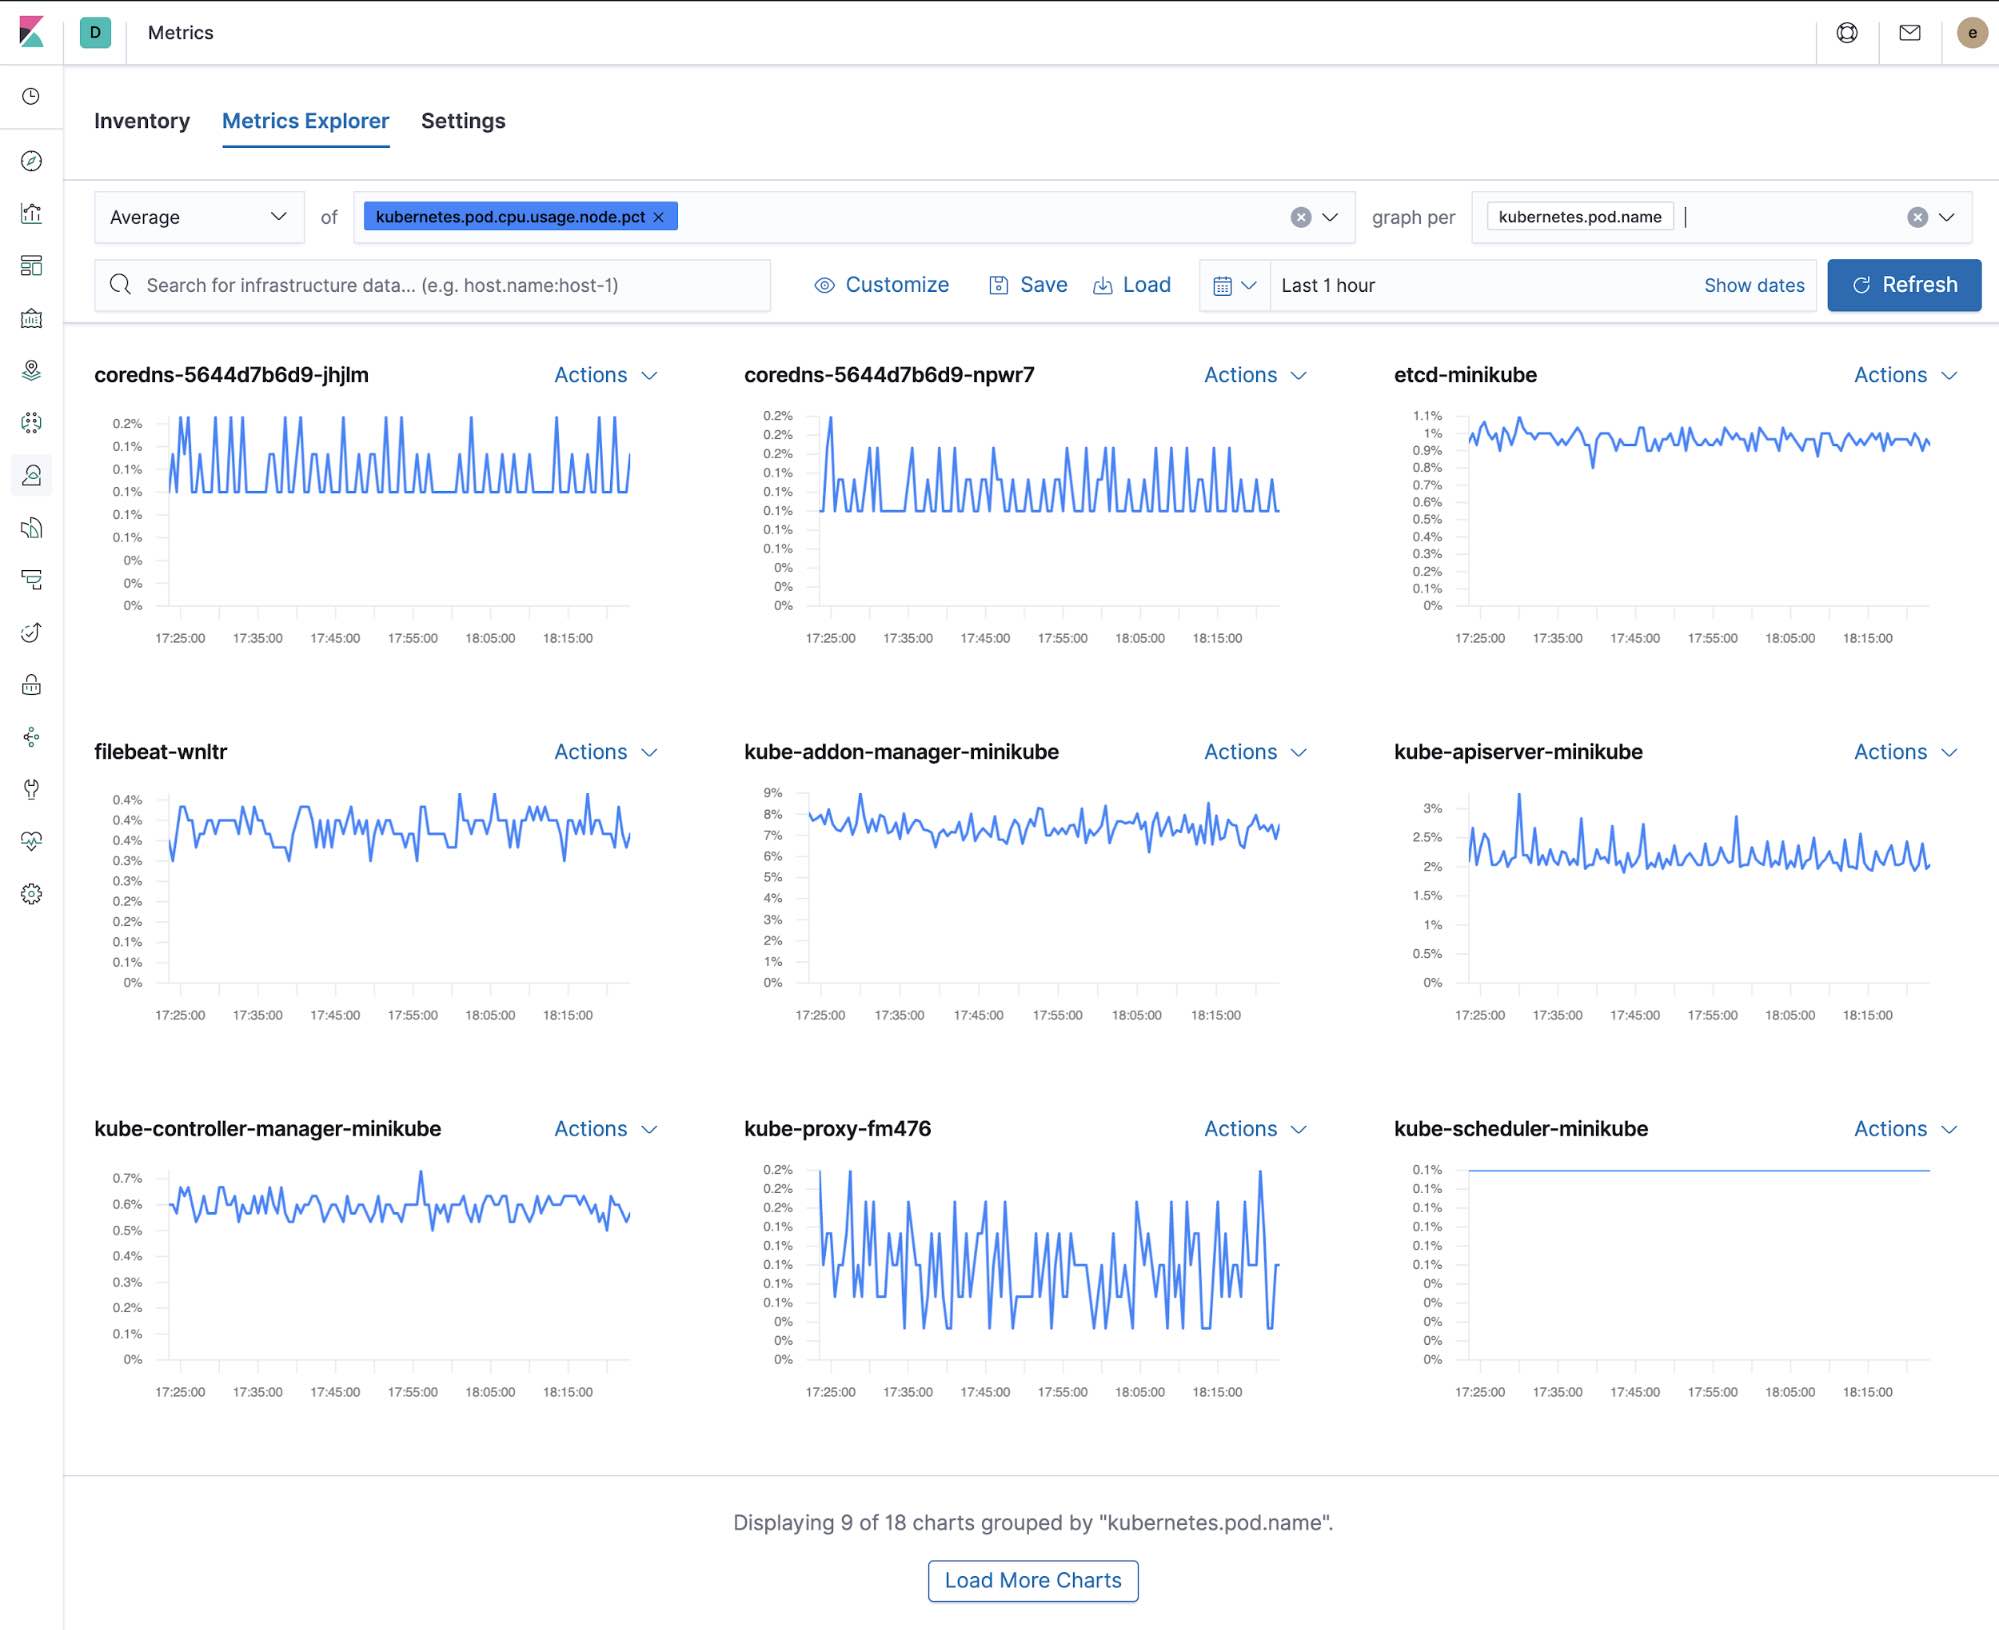
Metrics in Kibana
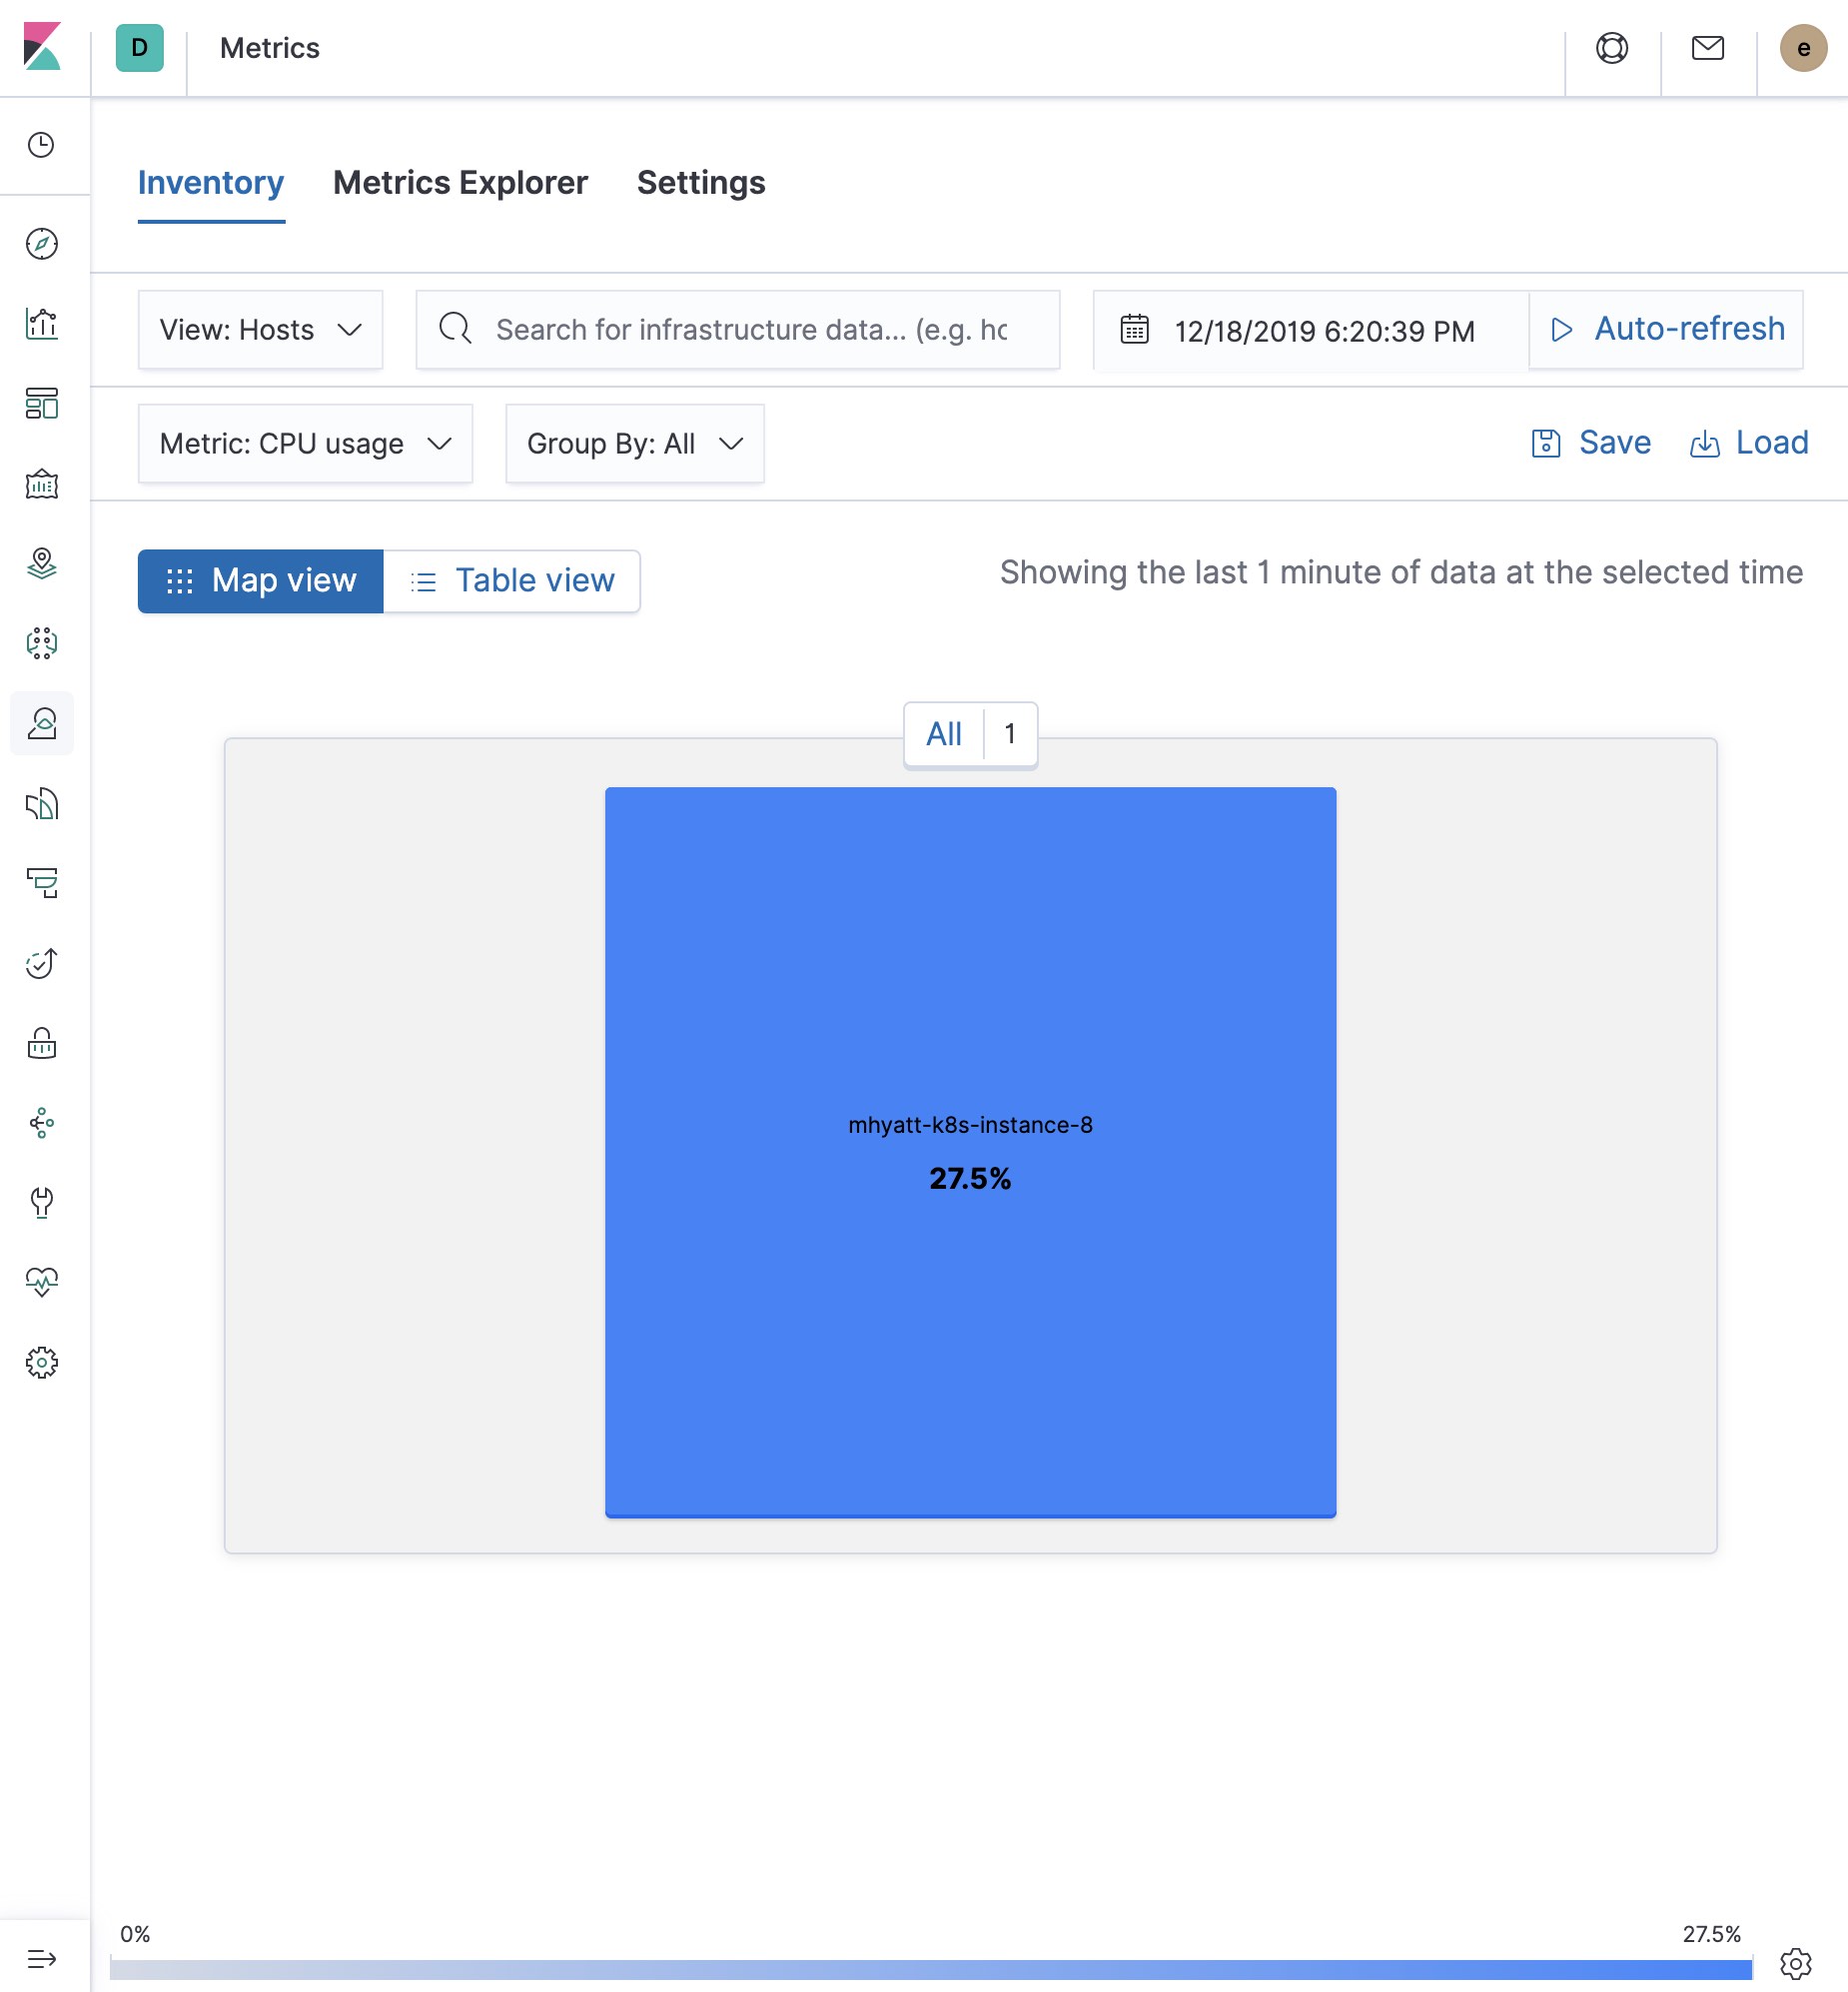
The Metricbeat configuration in our tutorial drives the following views in the Metrics app. Feel free to click around and review those. Notice how everywhere you go in Kibana, there is a search bar that allows you to, you know, search for things. It’s a great way to filter the views and zoom in into things when you are looking for that needle in a haystack. In our tutorial, we only have one host, so here it is:
Host infrastructure metrics
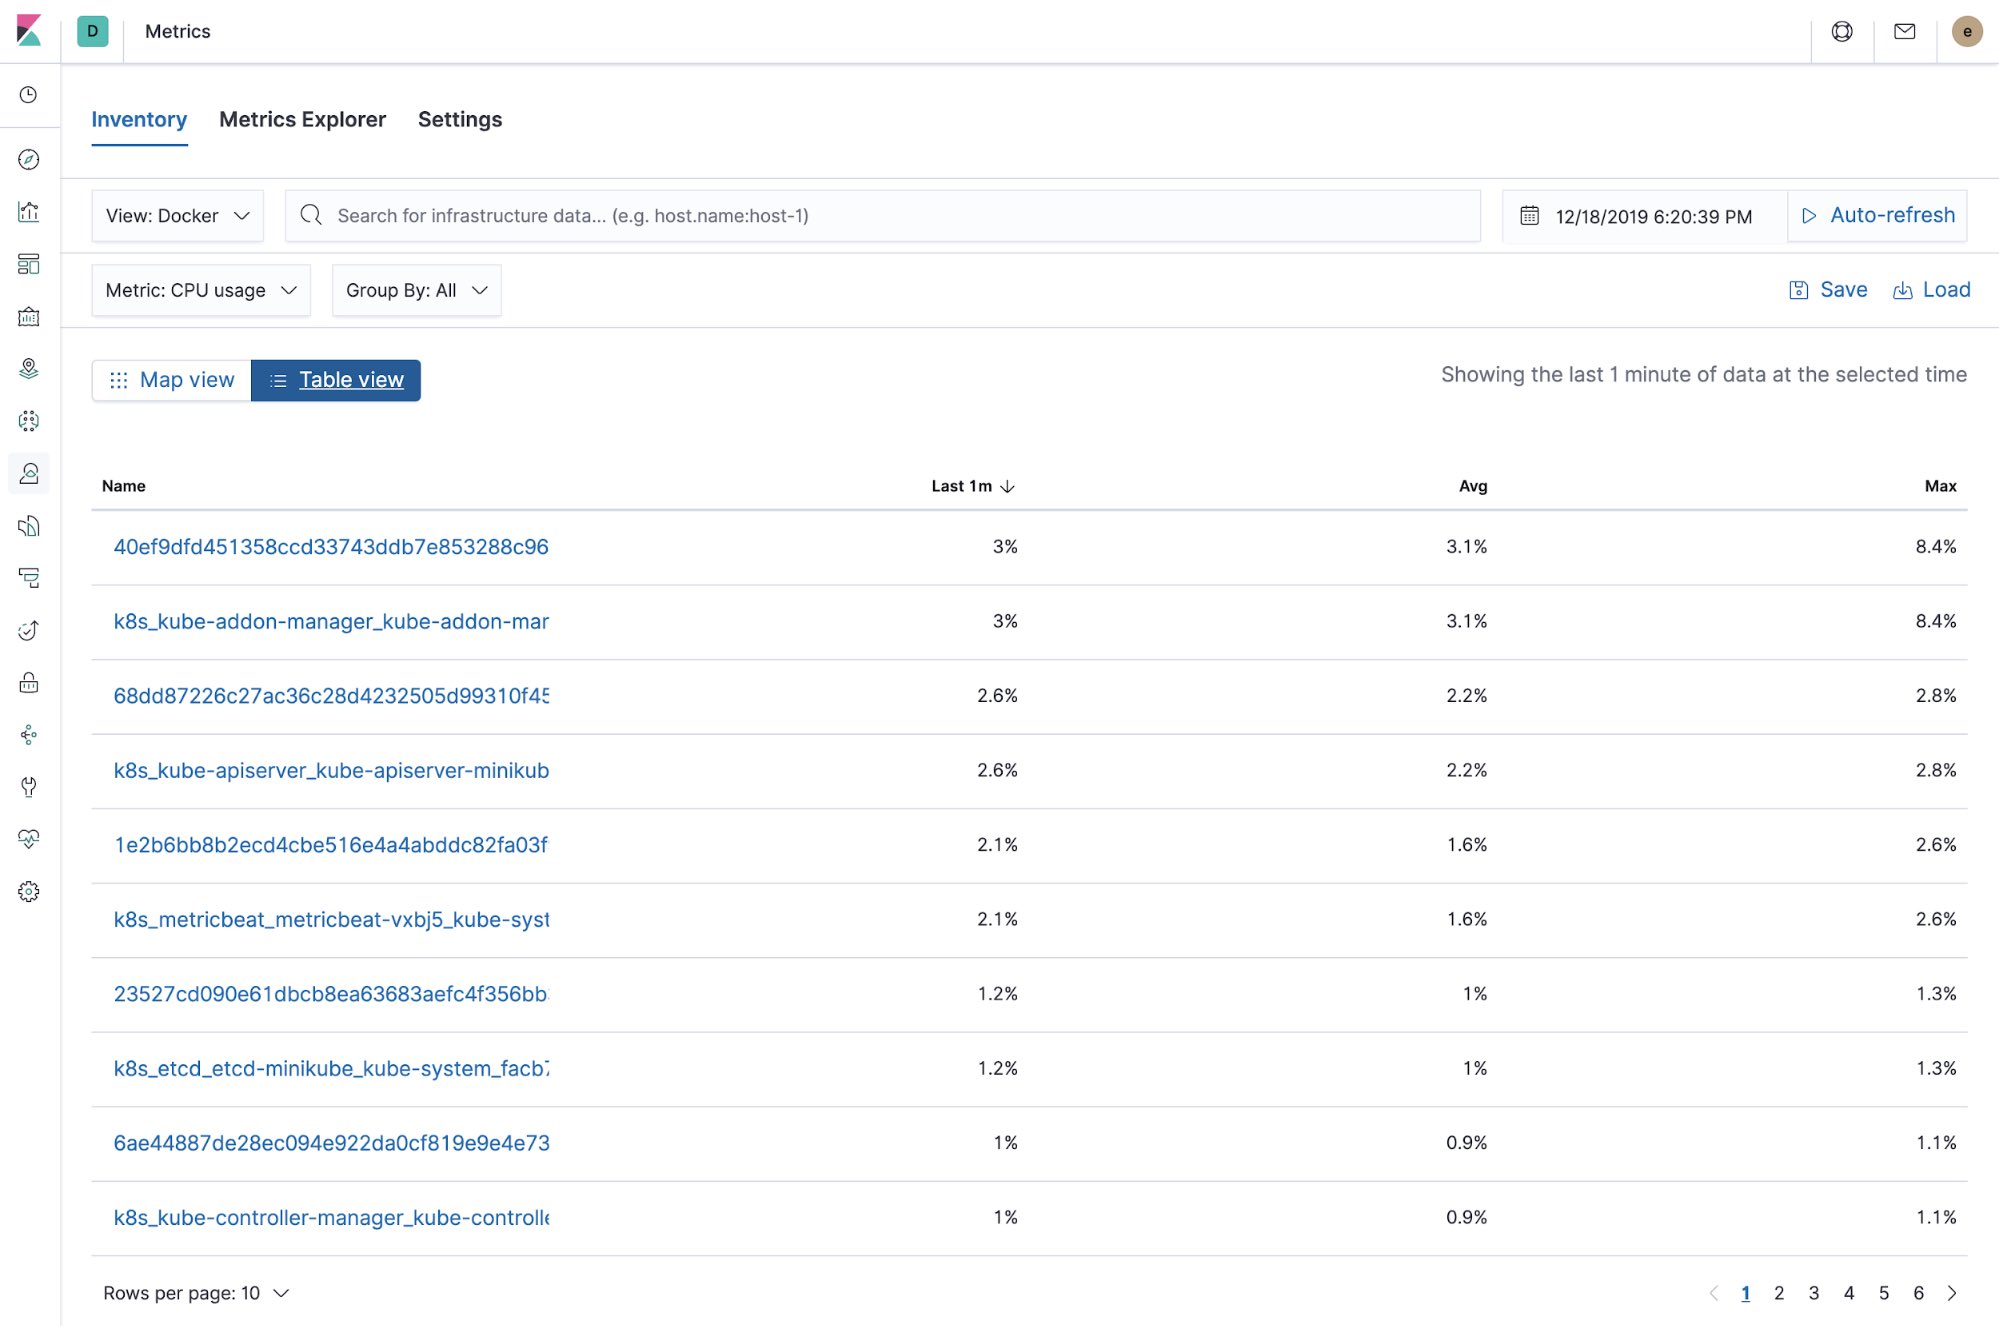
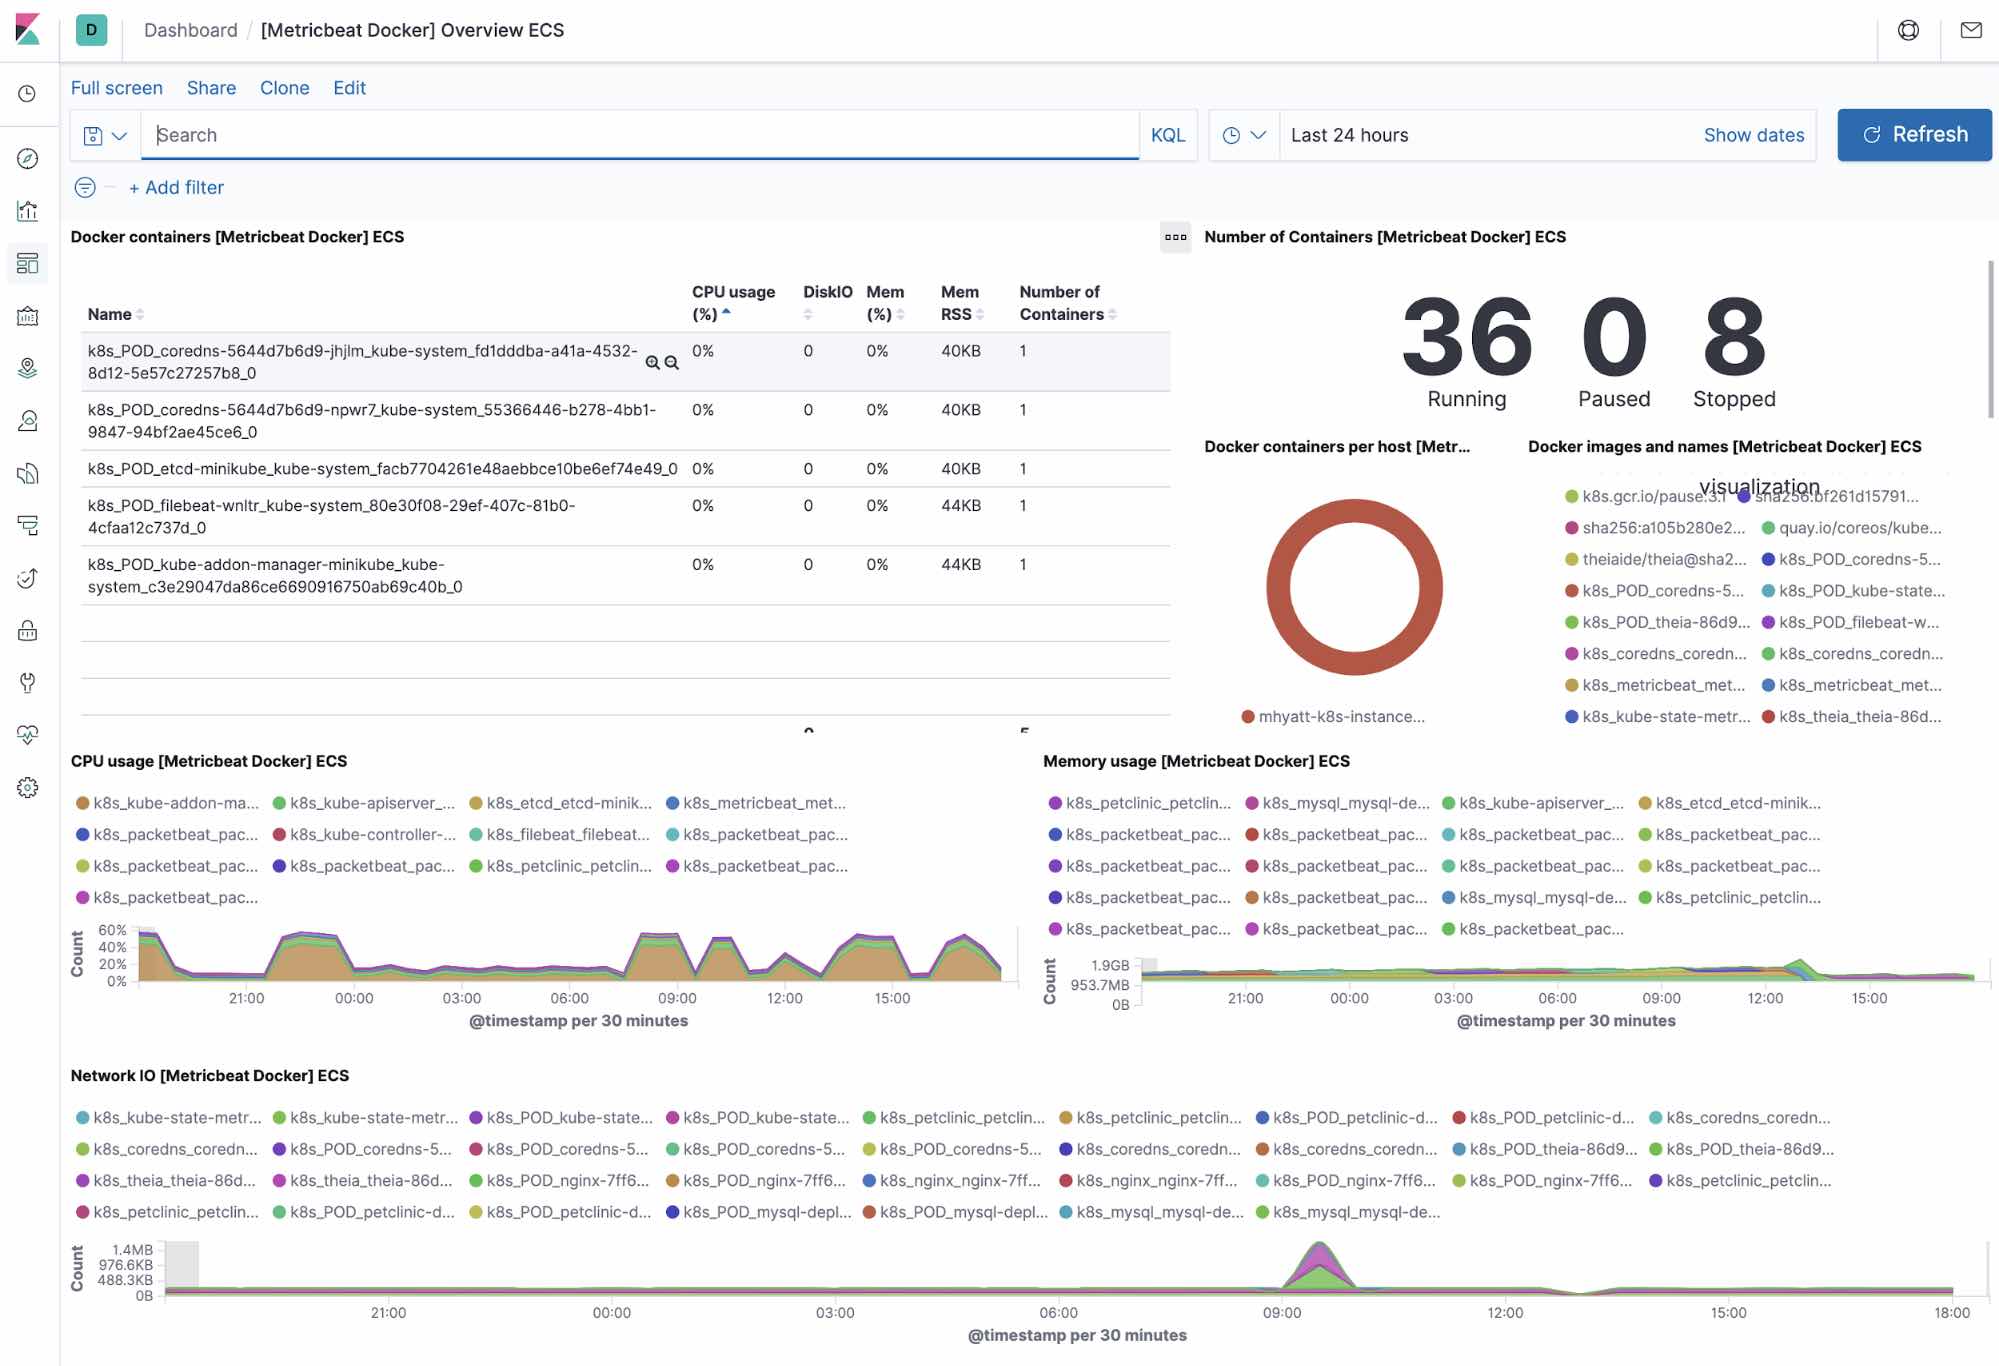
Docker infra and metrics (table view)
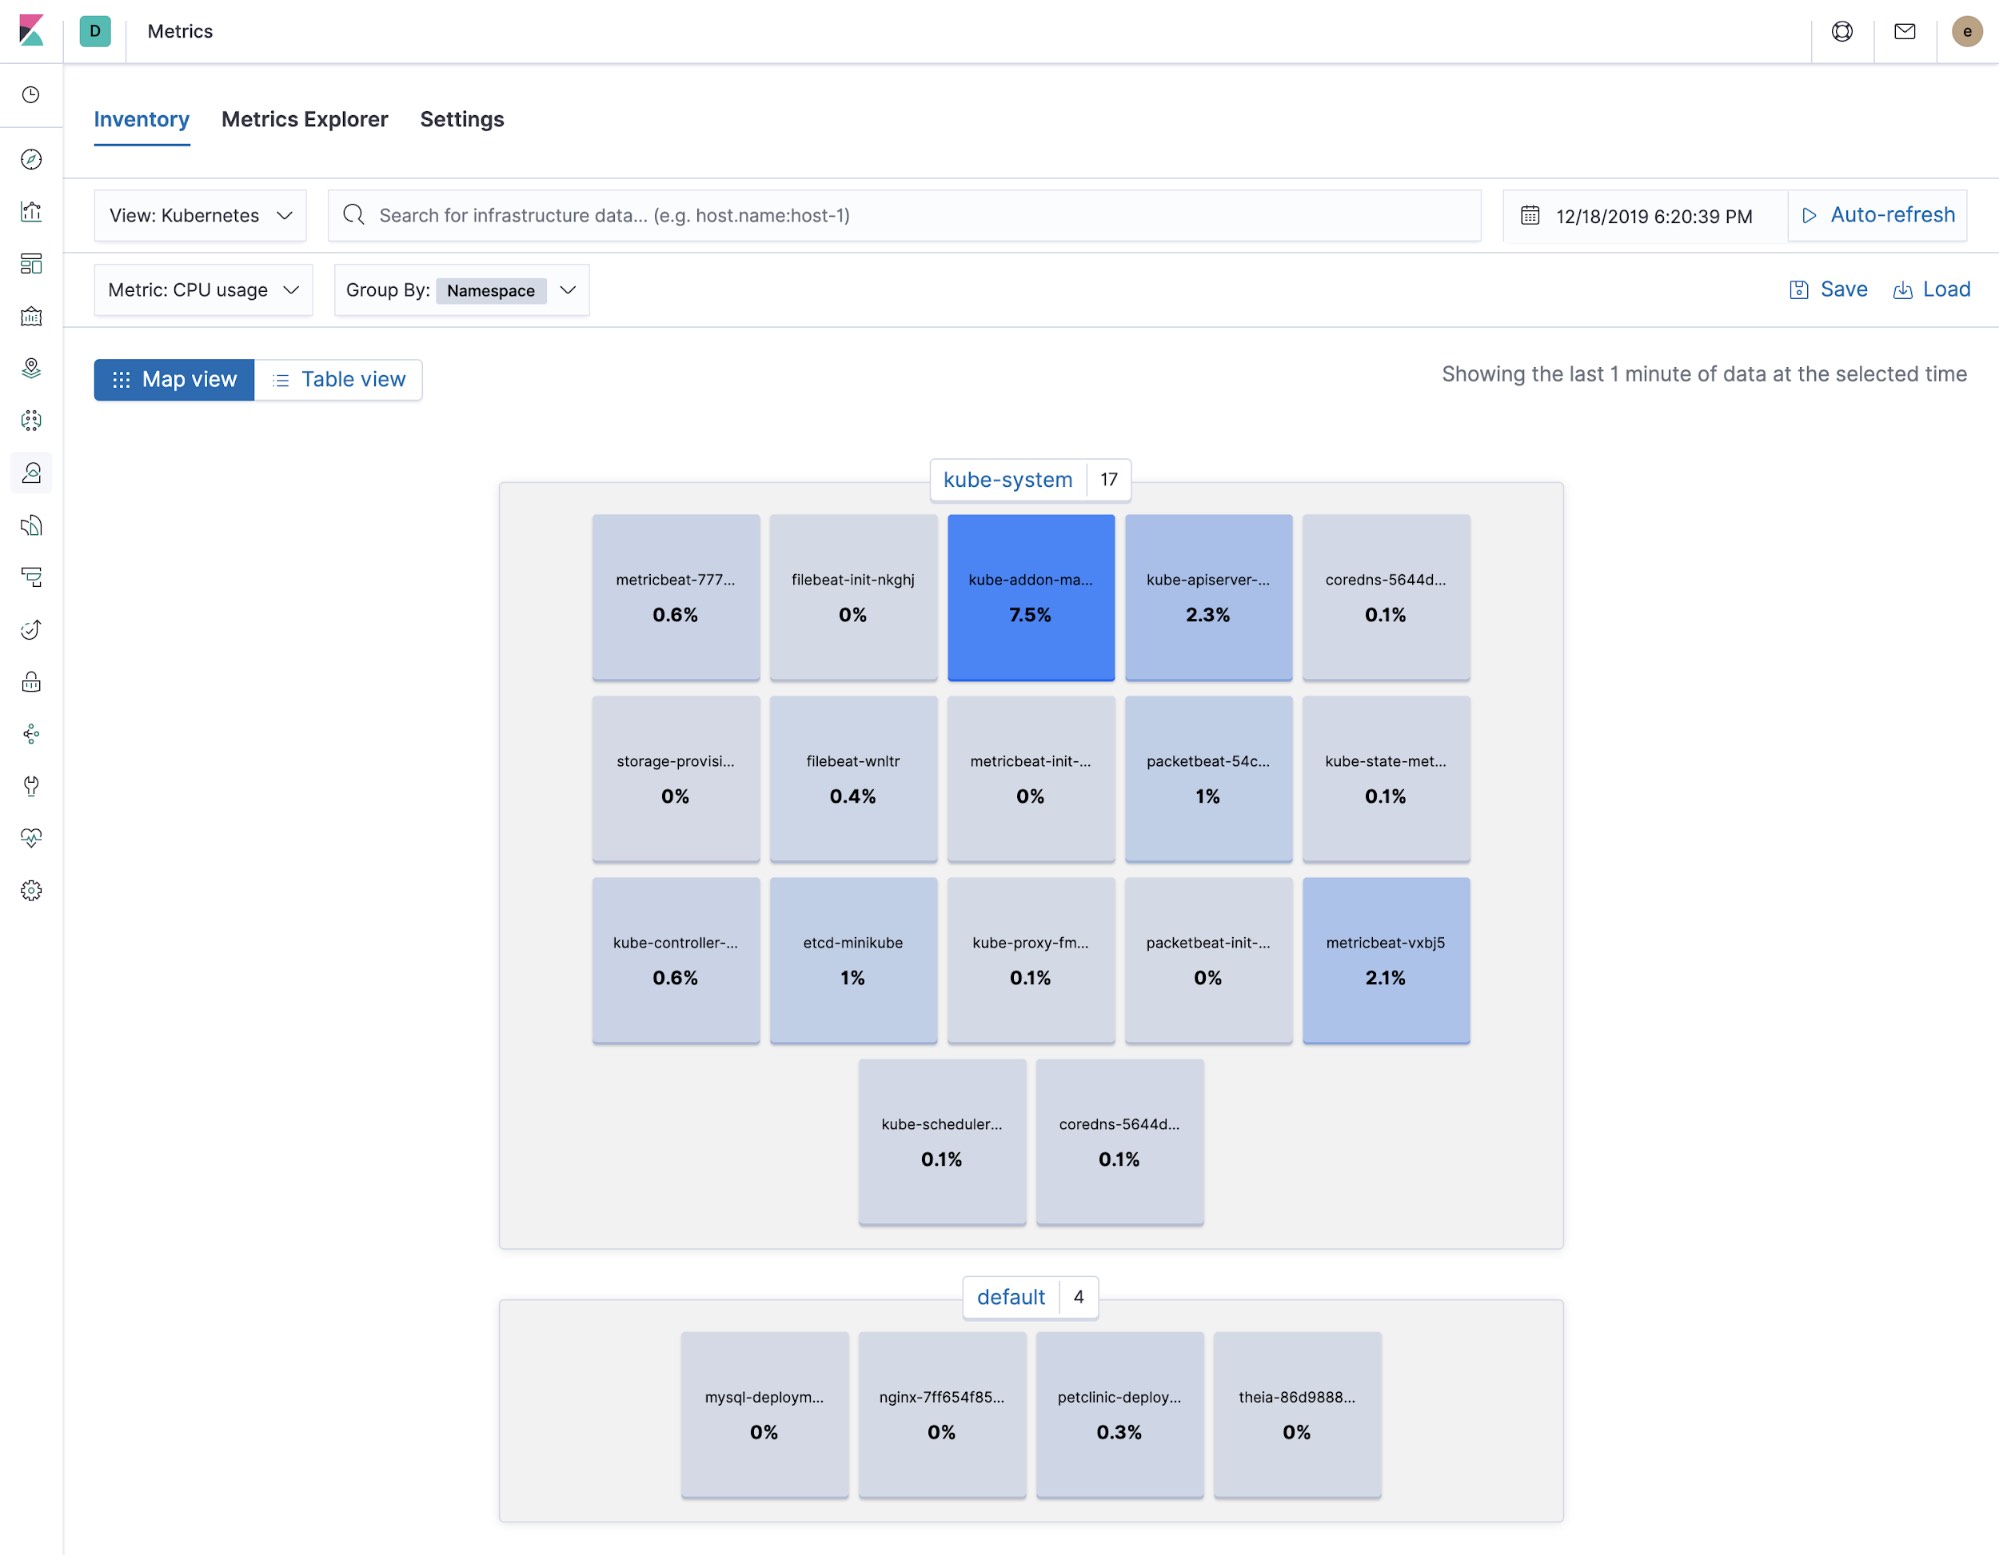
Kubernetes infra and metrics
Metrics explorer
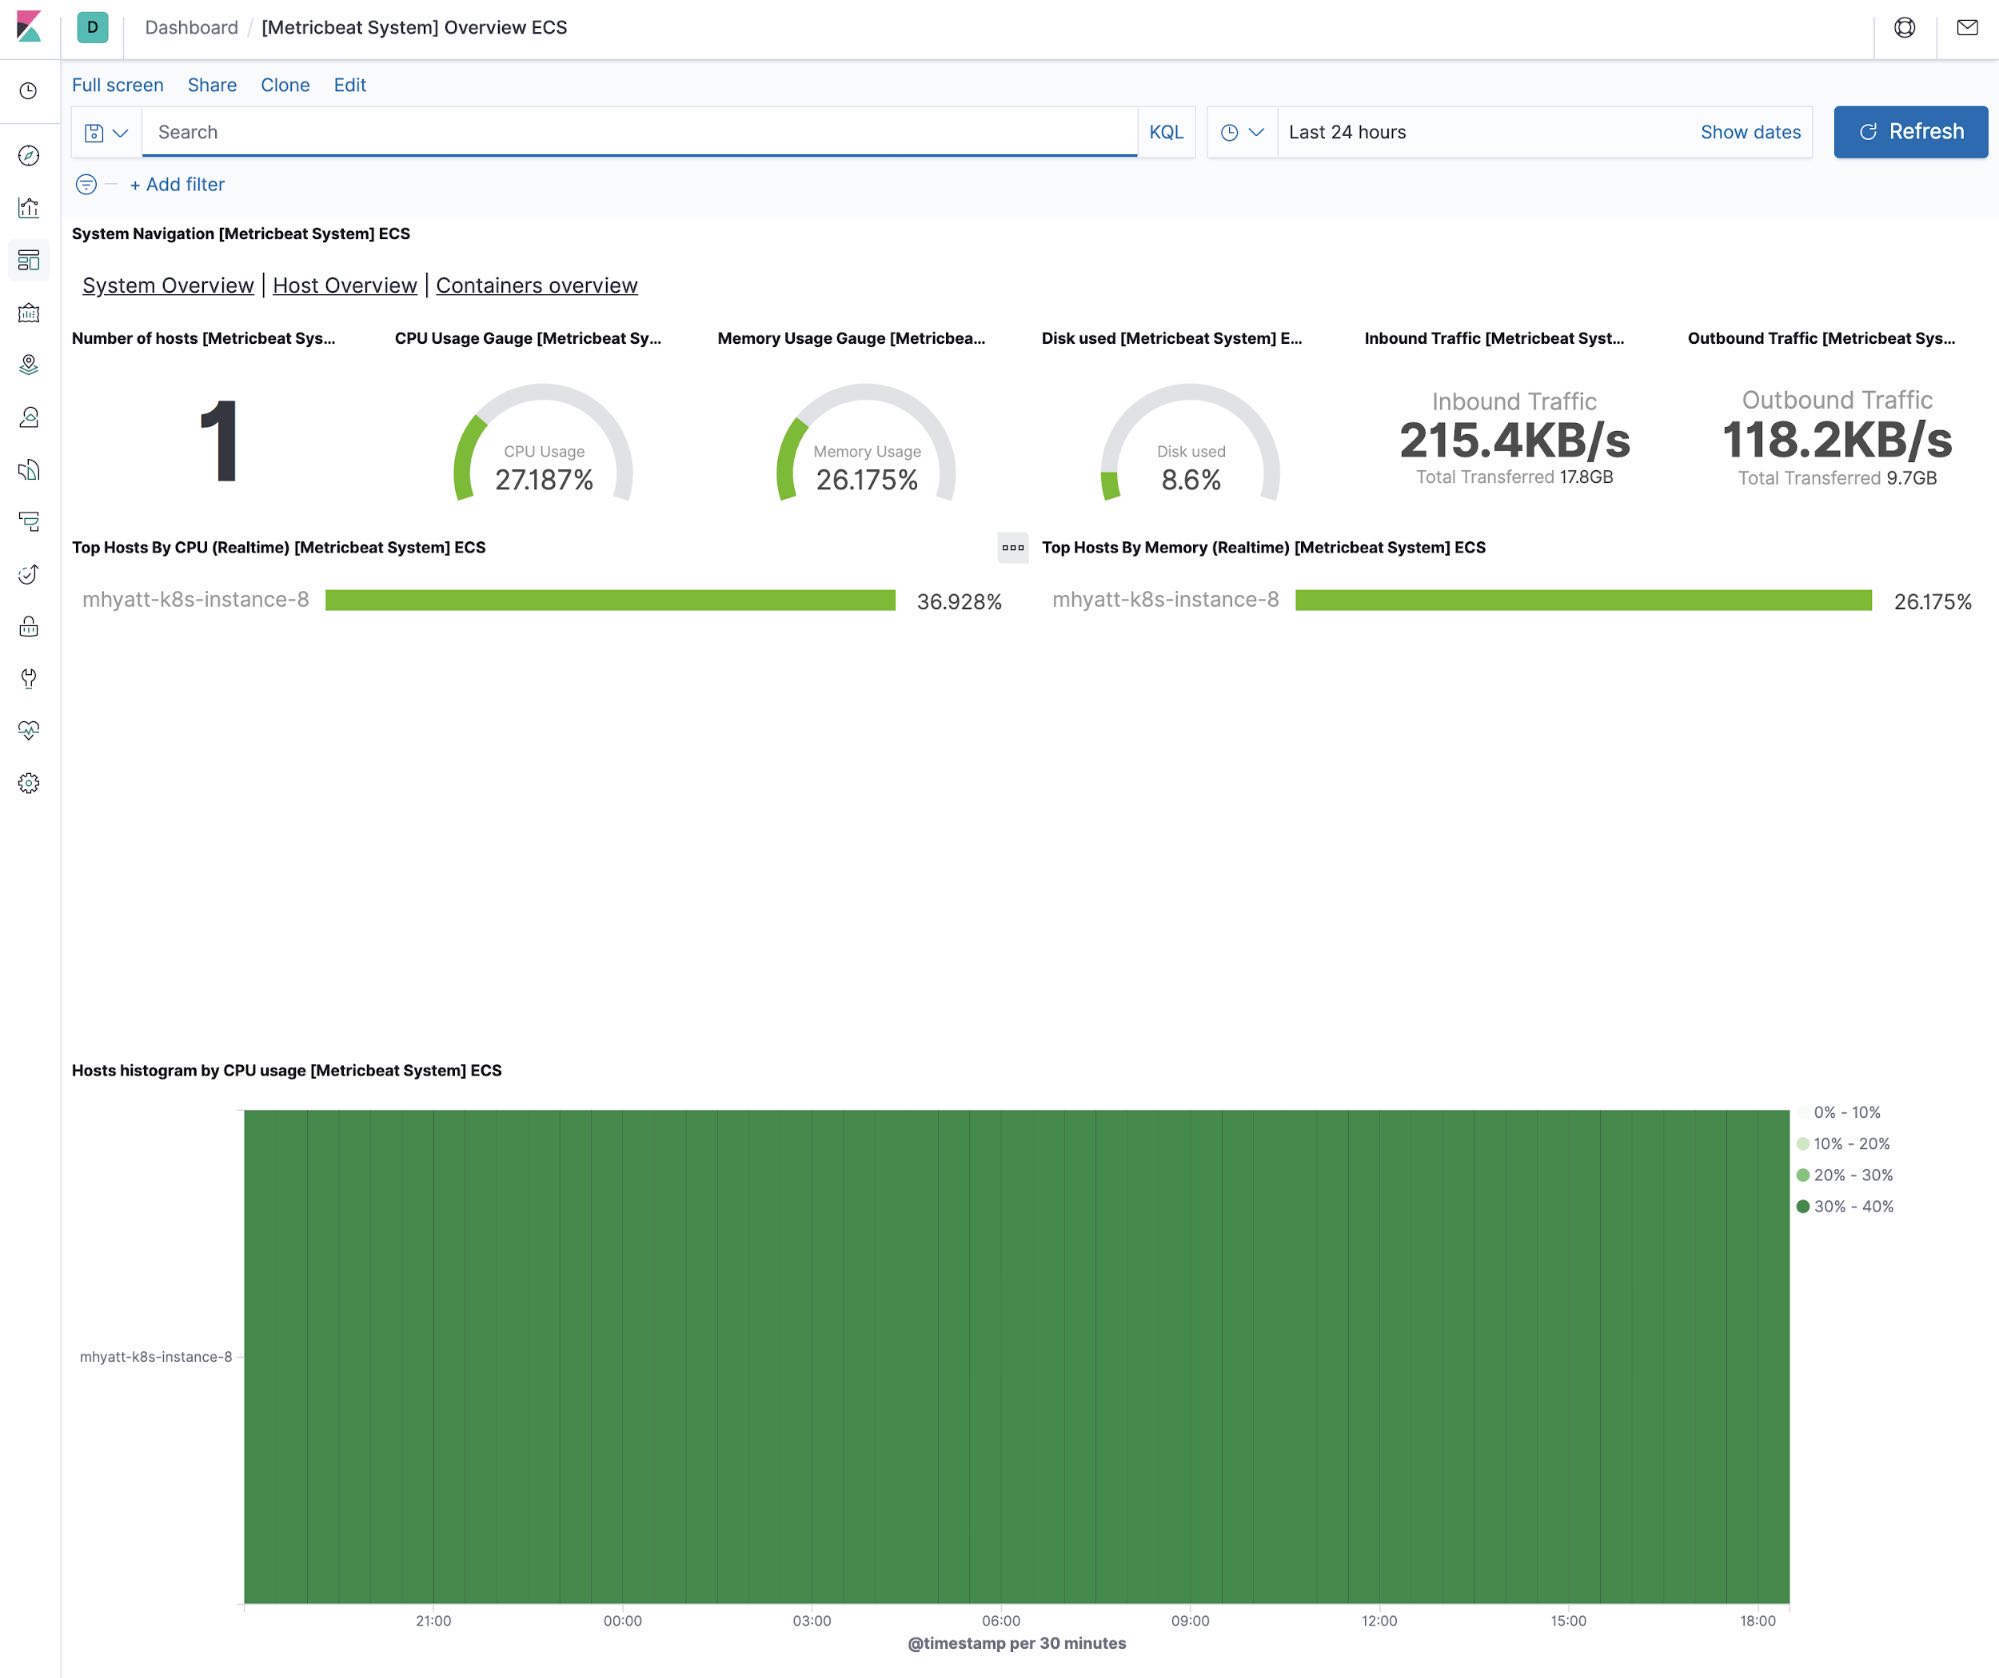
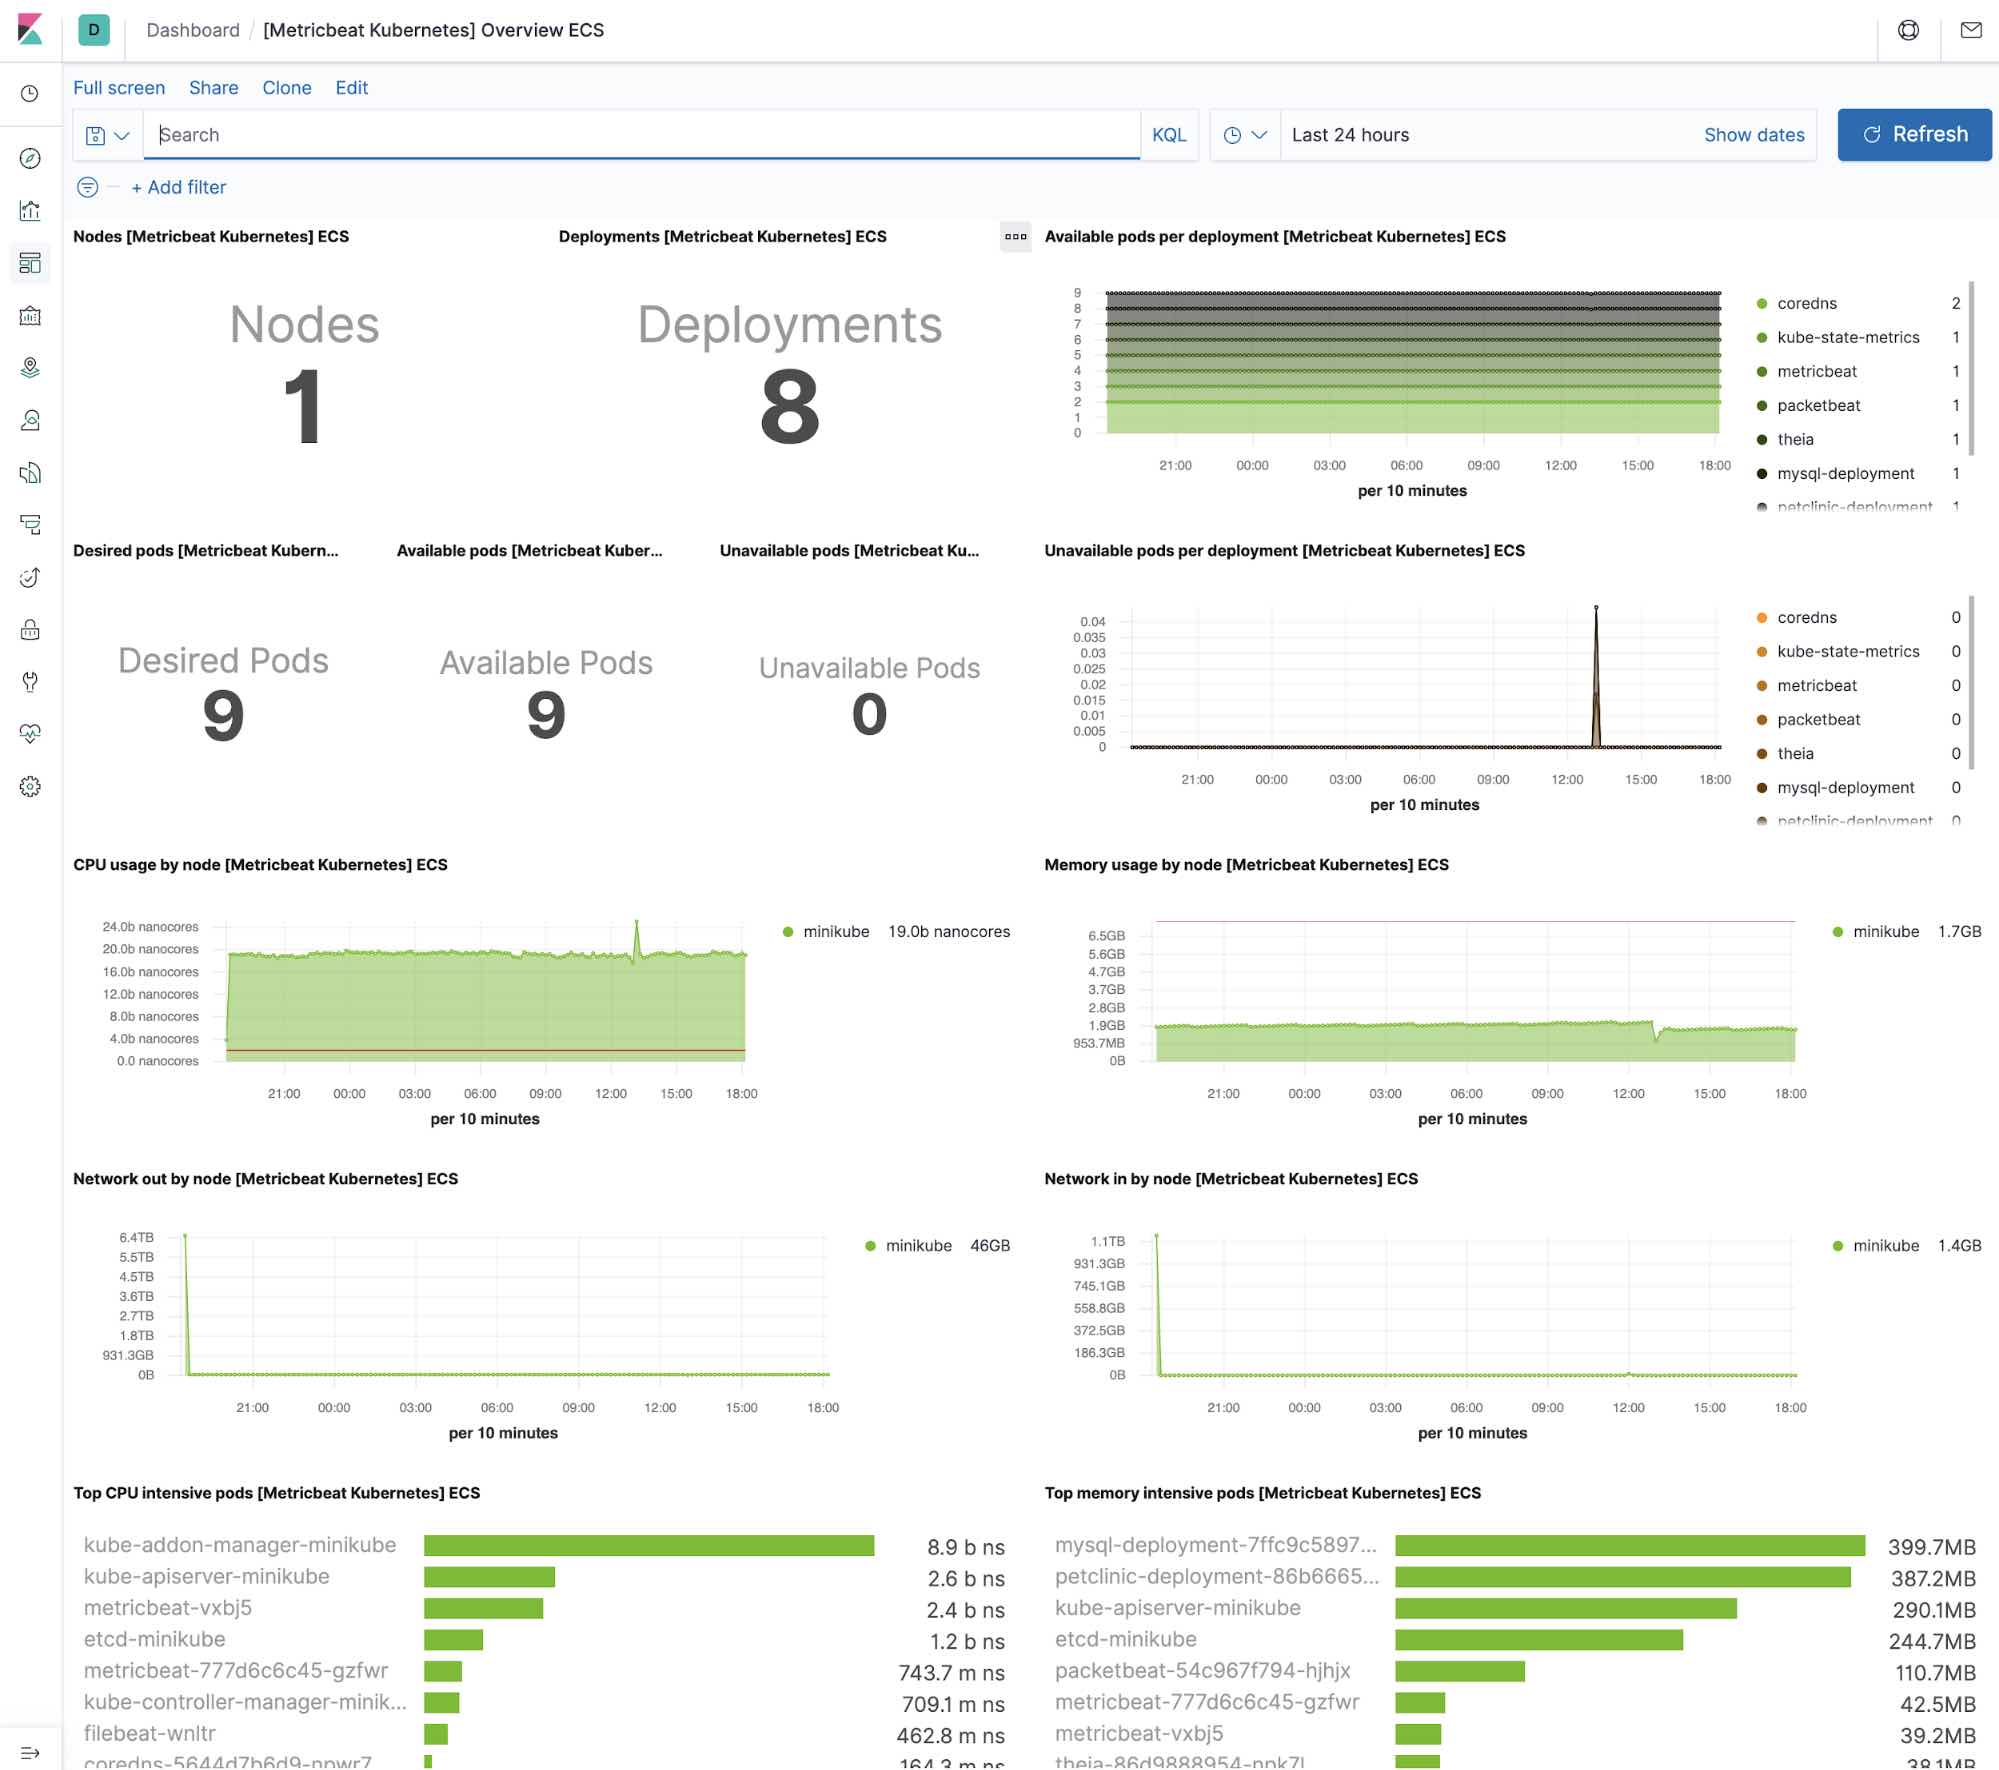
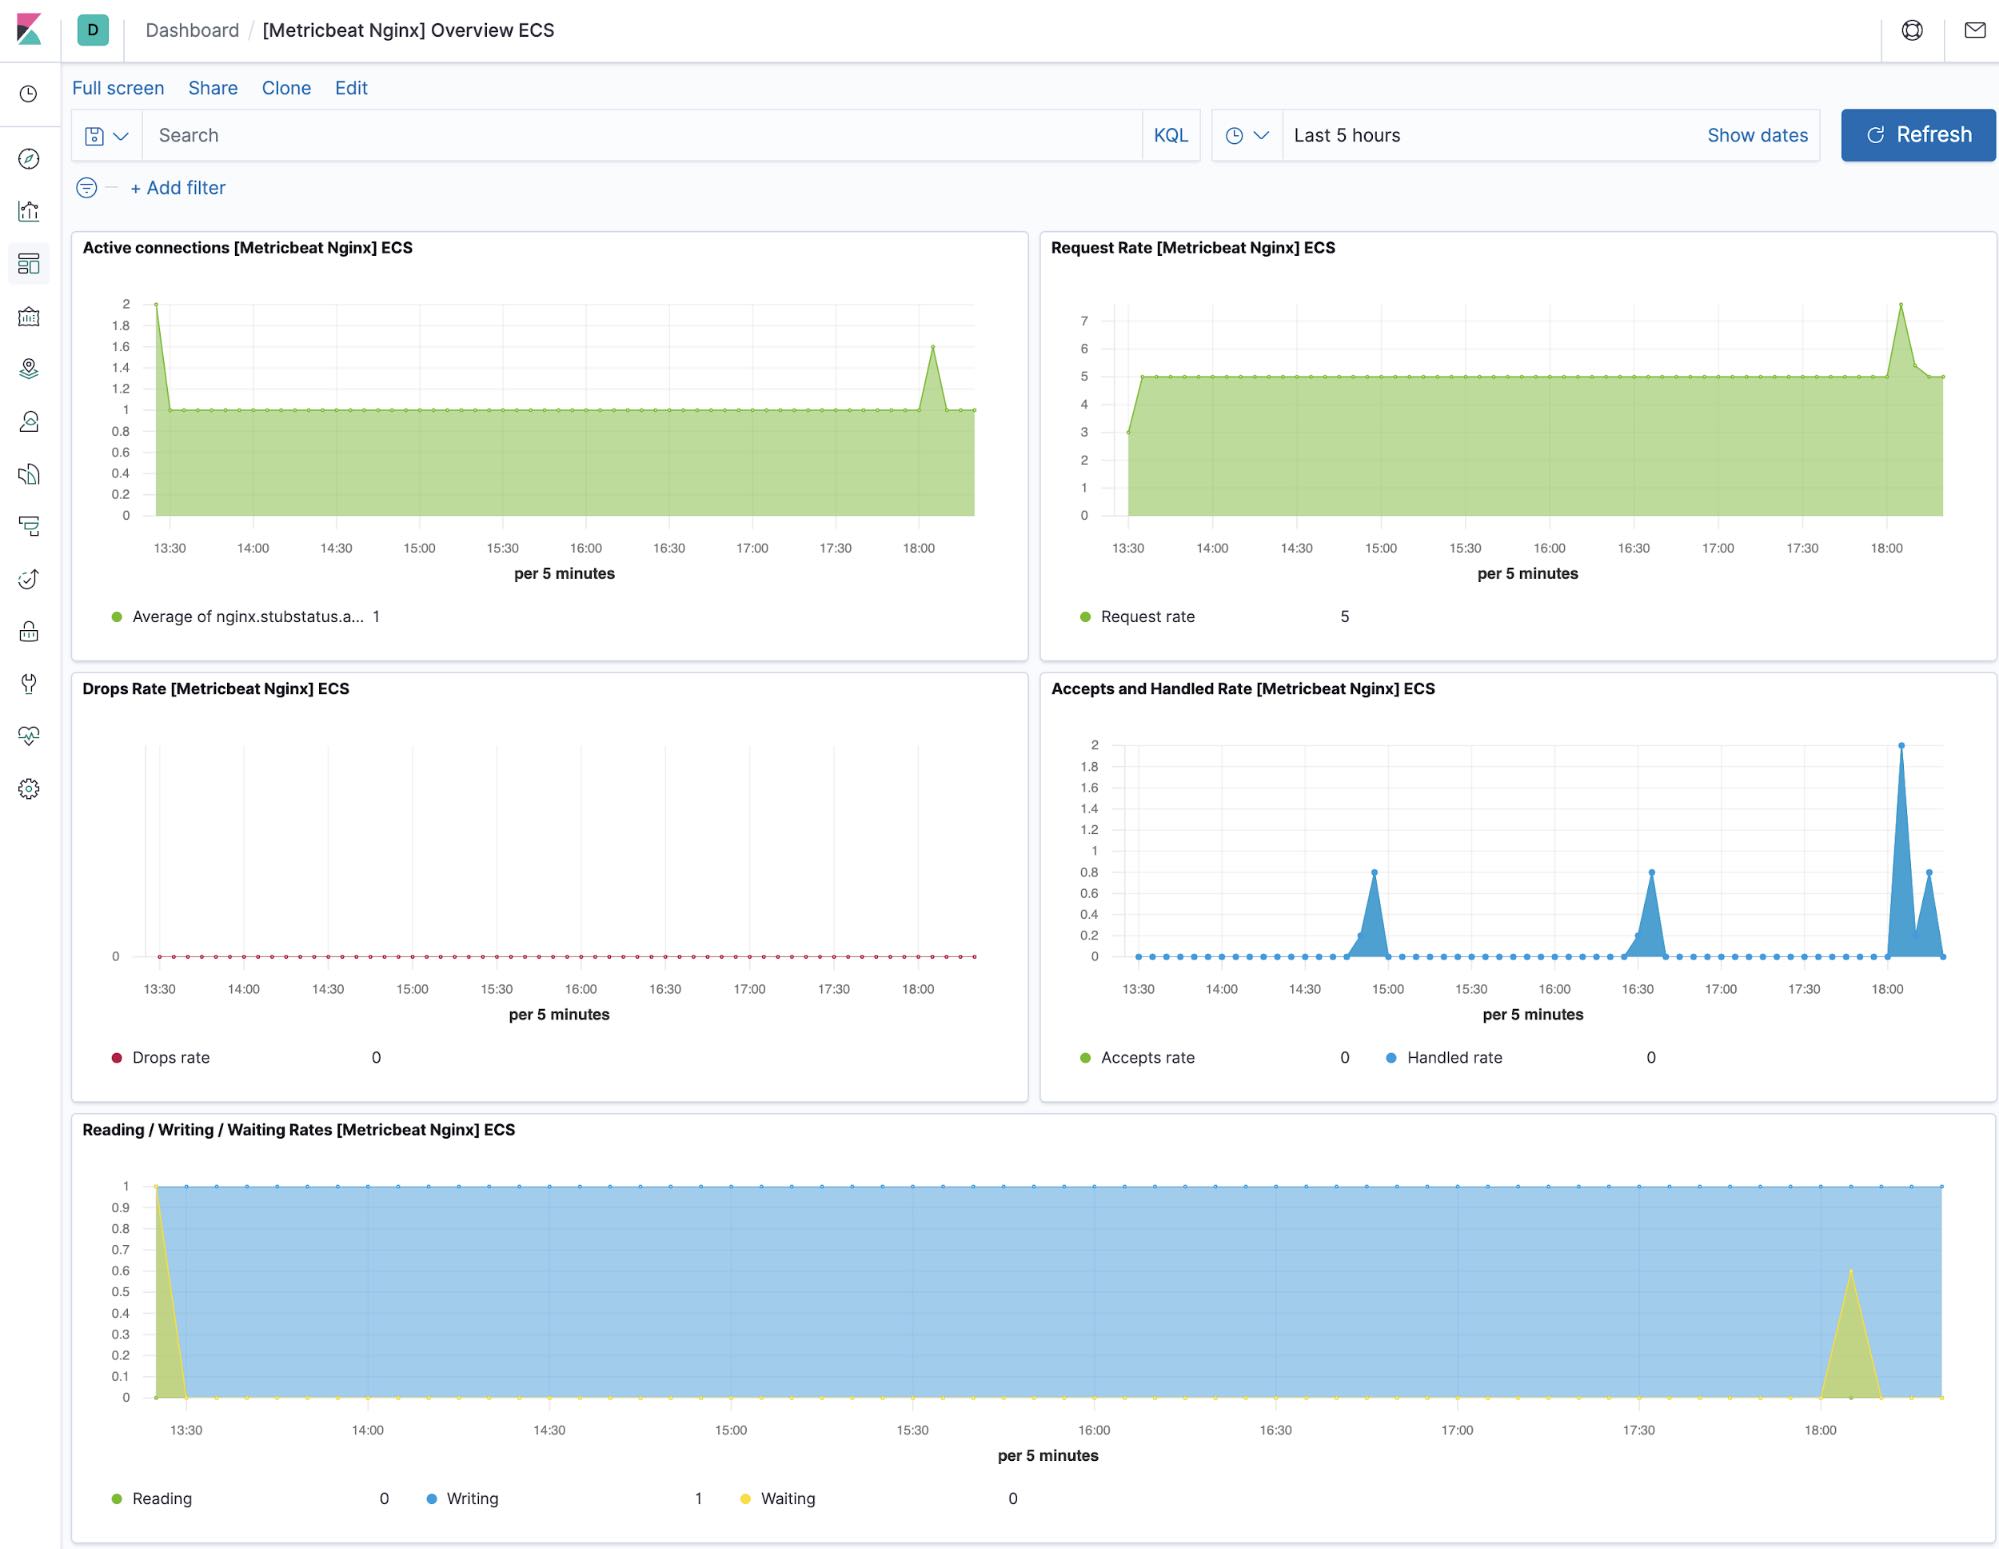
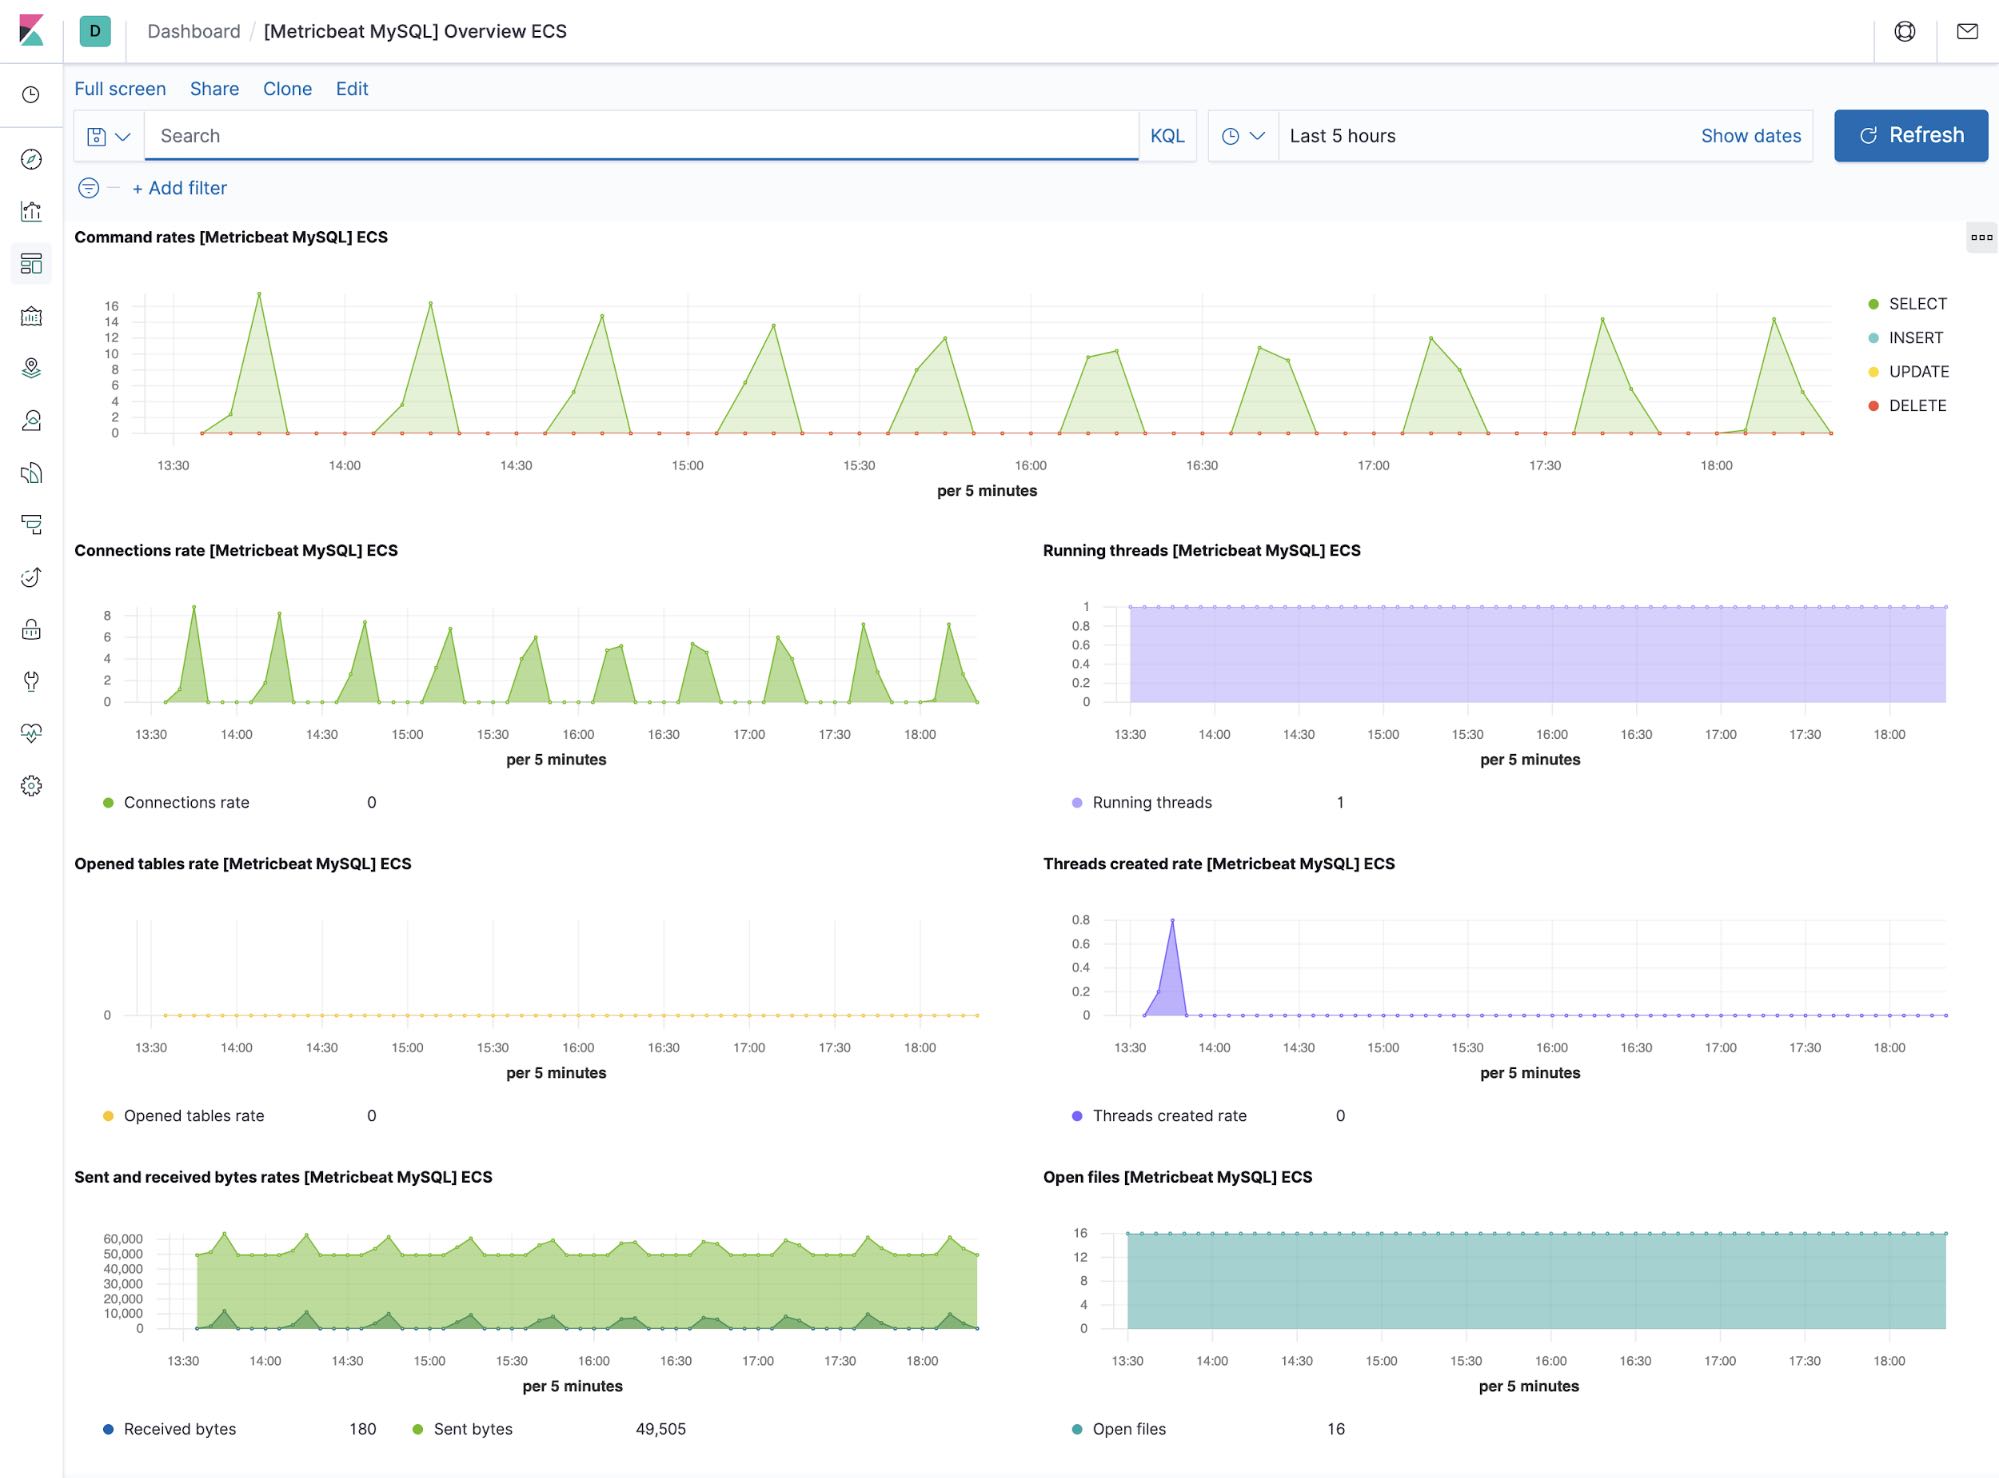
Out-of-the-box Kibana dashboards
Metricbeat ships with a variety of pre-built Kibana dashboards that can easily be added to your cluster with a single command. You can then use these dashboards as they are, or as a starting point for custom dashboards tailored to your needs. Here are dashboards that will help clearly display the data from your tutorial environment.
Host
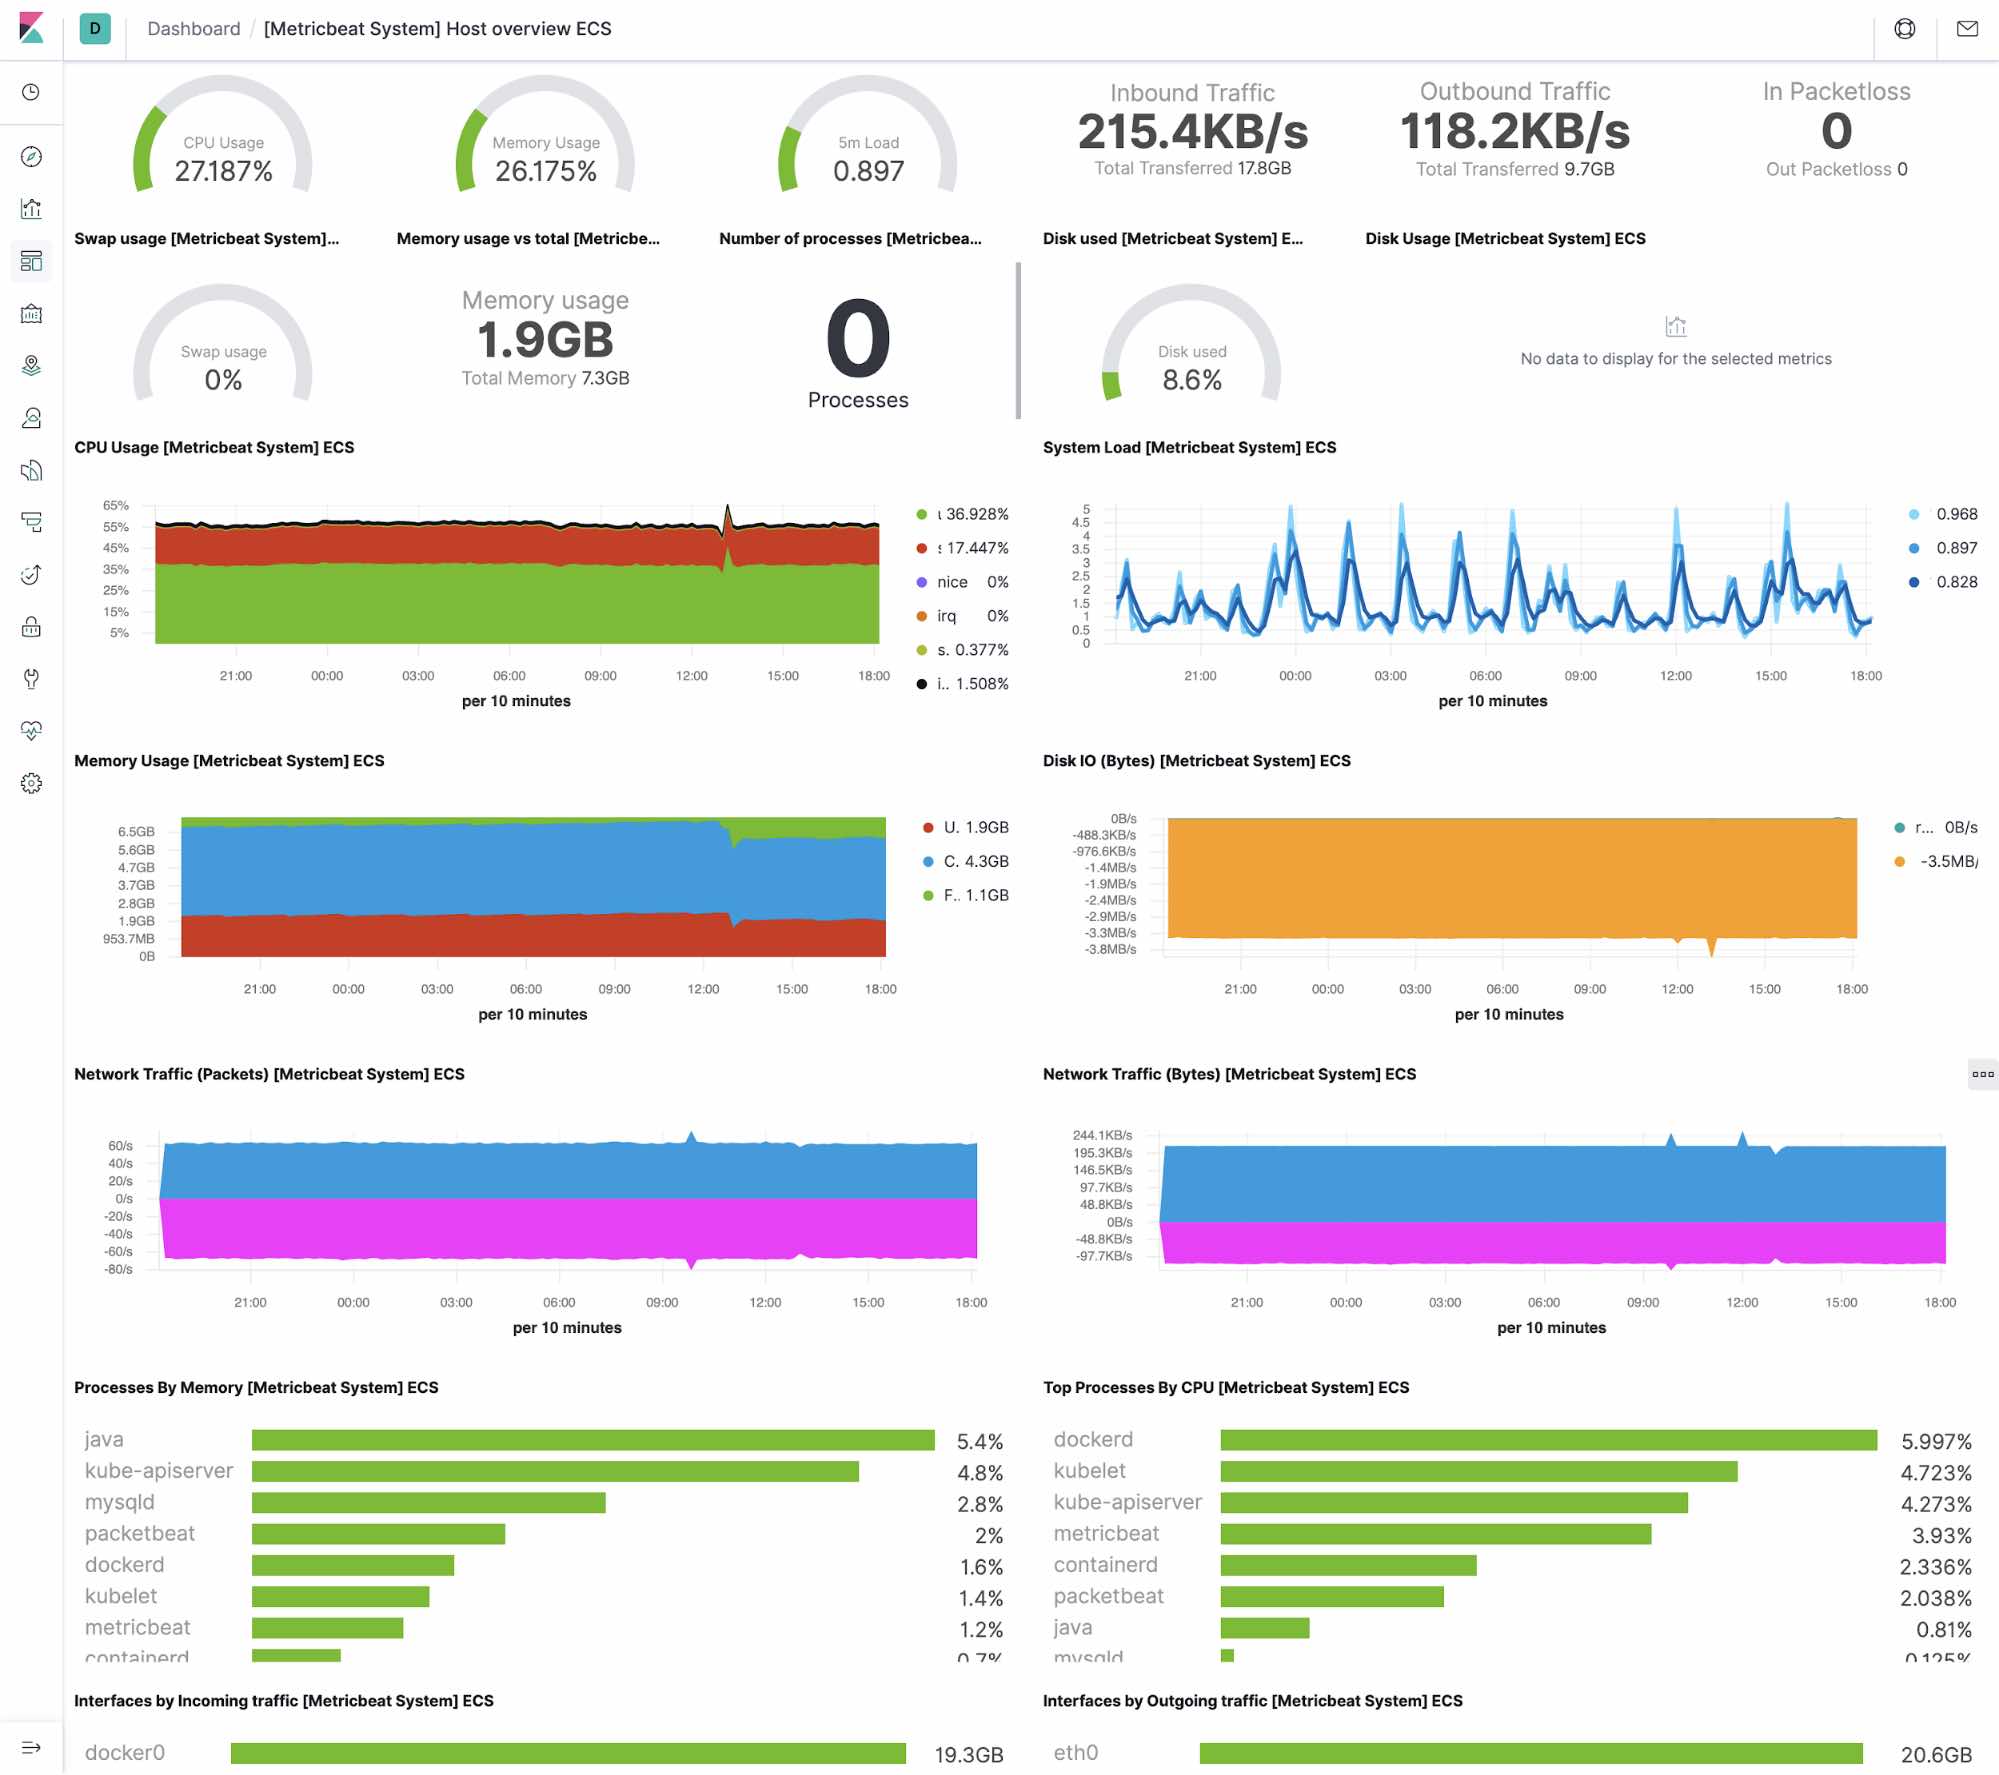
System
Docker
Kubernetes
NGINX
MySQL
Summary
In this part, we looked at collecting application and Kubernetes metrics with Metricbeat. You can get started monitoring your systems and infrastructure today. Sign up for a free trial of Elasticsearch Service on Elastic Cloud, or download the Elastic Stack and host it yourself.
Once you are up and running, monitor the availability of your hosts with uptime monitoring, and instrument the applications running on your hosts with Elastic APM. You'll be on your way to a fully observable system, completely integrated with your new metrics cluster. If you run into any hurdles or have questions, jump over to our Discuss forums — we're here to help.
Up next: Monitoring application performance with Elastic APM