Discovering anomalous patterns based on parent-child process relationships
As antivirus and machine learning-based malware detection have increased their effectiveness in detecting file-based attacks, adversaries have migrated to “living off the land” techniques to bypass modern security software. This involves executing system tools preinstalled with the operating system or commonly brought in by administrators to perform tasks like automating IT administrative tasks, running scripts on a regular basis, executing code on remote systems, and much more. Attackers using trusted OS tools like powershell.exe, wmic.exe, or schtasks.exe can be difficult to identify. These binaries are inherently benign and commonly used in most environments, so attackers can trivially bypass most first-line defenses simply by blending in with the noise of what’s executing on a recurring basis. Detecting patterns like this post-compromise requires sifting through millions of events with no clear starting point.
In response, security researchers have begun authoring detectors to target suspicious parent-child process chains. Using MITRE ATT&CK™ as a playbook, researchers can write detection logic to alert on a specific parent launching a child process with certain command line arguments. A good example is alerting on an MS Office process spawn powershell.exe with base64 encoded arguments. However, this is a time-consuming process requiring domain expertise and an explicit feedback loop to tune noisy detectors.
Security workers have open-sourced several Red vs. Blue Frameworks to simulate attacks and evaluate detector performance — but no matter how effective the detector, its logic can only solve one specific attack. A failure of detectors to generalize and detect emergent attacks presents a unique opportunity for machine learning.
Thinking in graphs
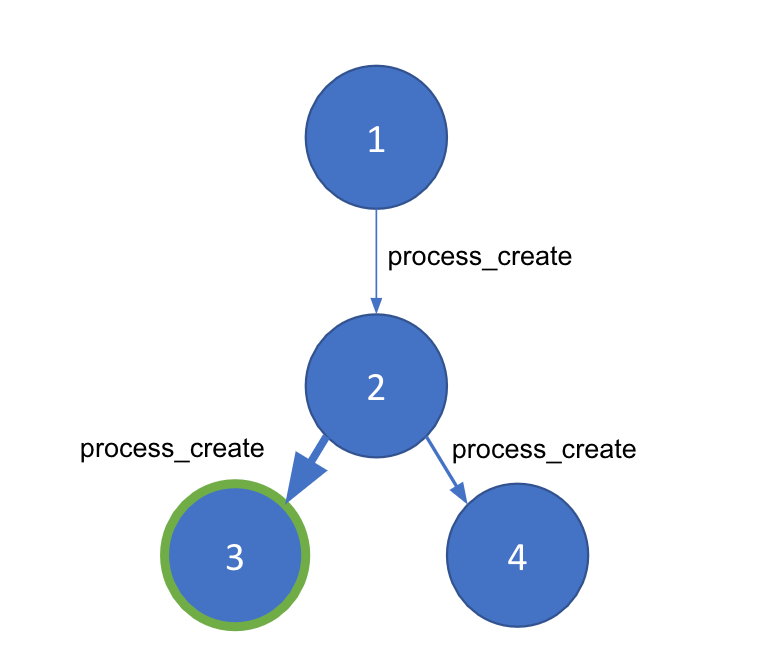
When we first started thinking about detecting anomalous parent-child processes, I immediately jumped at the idea of turning this into a graph problem. After all, process execution can be expressed as a graph for a given host. The nodes in our graph will be individual processes broken out by process ID (PID), while each of the edges, which connect the nodes, will be a process_creation event. A given edge will be packed with important metadata derived from the event like timestamps, command-line arguments, and the user.
Now we have a graph representation of a host machine’s process events. However, living off the land attacks can spawn from the same system-level processes that are always executing. We need a way to separate good and bad process chains within a given graph. Community detection is a technique that segments a large graph into smaller “communities” based on the density of the edges between our nodes. To use this, we need a way to generate a weight between nodes to ensure community detection works properly and identifies the anomalous portion(s) of our graph. For this, we will turn to machine learning.
Machine learning
To generate our edge weight model, we will use supervised learning, a machine learning approach that requires labeled data to feed to the model. Luckily, we can use the open source Red and Blue frameworks mentioned above to help generate some training data. Below are a few of the Open Source Red and Blue Frameworks used in our training corpus:
Red team frameworks
- Atomic Red Team (Red Canary)
- Red Team Automation (Endgame/Elastic)
- Caldera Adversary Emulation (MITRE)
- Metta (Uber)
Blue team frameworks
- Atomic Blue (Endgame/Elastic)
- Cyber Analytics Repository (MITRE)
- MSFT ATP Queries (Microsoft)
Data ingest & normalization
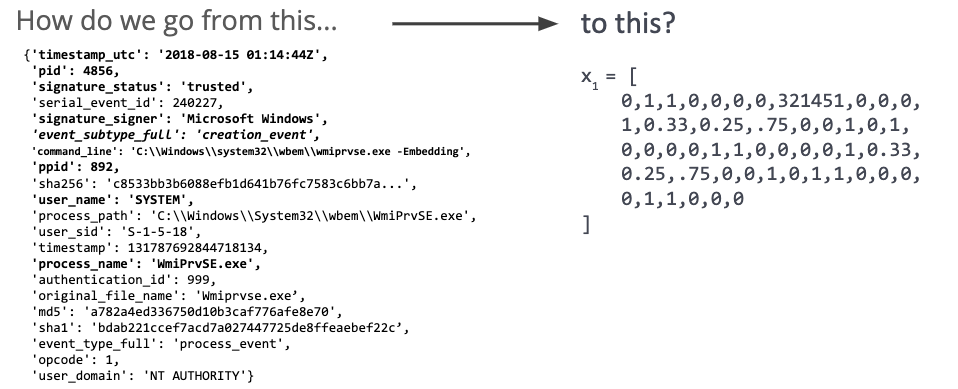
Once we’ve ingested some event data, we will need to transform it into a numeric representation (Fig 2). This representation will allow the model to learn broader details of a parent-child relationship in the scope of an attack, which helps it avoid merely learning signatures.
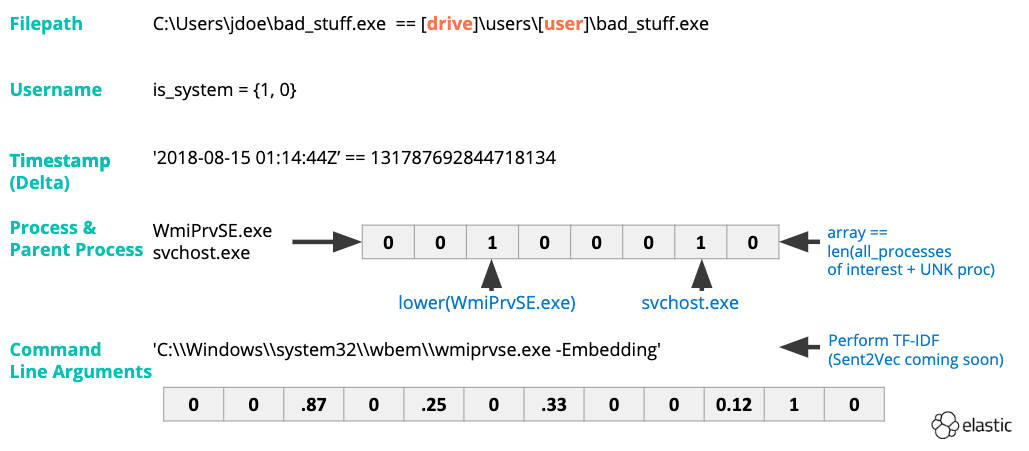
First, we perform feature engineering (Fig 3) on process names and command-line arguments. TF-IDF vectorization will capture the statistical importance of a given word to an event across our dataset. Converting timestamps to integers will allow us to determine the delta between the parent process start time and when a child process was launched. Other features are binary in nature (e.g., 1 or 0, yes or no). Good examples of this feature type are:
- Is the process signed?
- Do we trust the signer?
- Is the process elevated?
After our dataset has been transformed, we will use it to train a supervised learning model (Fig 4). The model serves to provide an “anomalous score” for a given process creation event between 0 (benign) and 1 (anomalous). We can use the anomalous score as an edge weight in our graph!
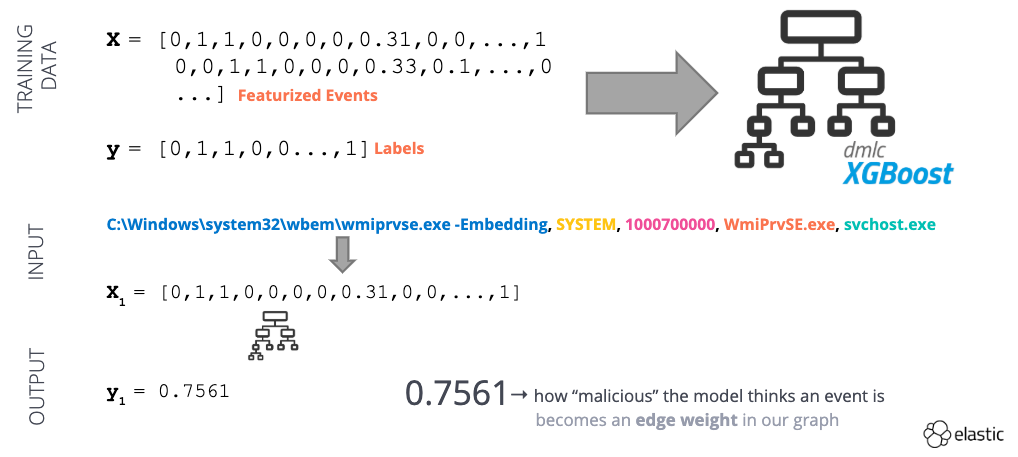
Fig 4 - Example of a supervised machine learning workflow
Prevalence service


Fig 5 - Conditional probabilities used by the Prevalence Engine
Now we have a weight graph — courtesy of our machine learning model. Mission accomplished, right? The model we’ve trained does a great job of making a good/bad decision for a given parent-child chain based on our global understanding of good and bad. But every customer environment is going to be different. There will be processes we’ve never observed before and system administrators who use PowerShell for … well, everything.
Basically, if we just used this model alone, we would likely see a deluge of false positives and we would increase the amount of data an analyst needs to sift through. To offset this potential problem, we’ve developed a prevalence service to tell us how common a given parent-child process chain is within that environment. Accounting for the local nuances of the environment will allow us to more confidently elevate or suppress suspicious events and draw out truly anomalous process chains.
The prevalence service (Fig 5) relies on two statistics derived from conditional probability that allow us to state: “From this parent, I’ve seen this child more than X% of other child processes” AND “From this process, I’ve seen this command-line more than X% of other command-lines associated w/ the process.” Once we have the Prevalence Service in place, we can put the finishing touches on our core detection logic, find_bad_communities.
Finding “bad” communities
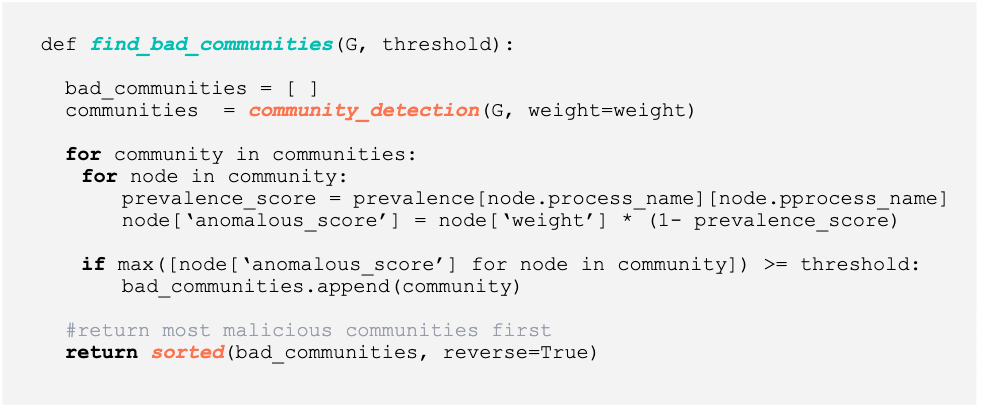
Fig 6 - Python code for discovering anomalous communities
Above (Fig 6) we see the Python code used to generate the bad communities. The logic for find_bad_communities is very straightforward:
- Classify each process_create event for a host machine to generate a node pair (e.g., parent node and child node) and an associated weight (e.g. the output from our model)
- Construct a directed graph
- Perform community detection to generate a list of communities in the graph.
- Within each community, we determine how prevalent a parent-child is (e.g. each connection). We account for the commonness of a parent-child event in the final anomalous_score.
- If the anomalous_score meets or exceeds a threshold, we set aside that entire community for analyst review
- After each community has been analyzed, we return a list of “bad” communities sorted by the max anomalous_score
Results
We trained the final model on a combination of real-world and simulated benign and malicious data. Benign data consisted of 3 days of Windows process event data gathered on our internal network. The sources of this data were a mix of user workstations and servers to replicate a small organization. We generated malicious data by detonating all the ATT&CK techniques available via the Endgame RTA framework, as well as launching macro and binary-based malware from advanced adversaries like FIN7 and Emotet.
For our main experiment, we decided to use event data from the MITRE ATT&CK Evaluation provided by Roberto Rodriguez’s Mordor project. The ATT&CK Evaluation sought to emulate APT3 activity using FOSS/COTS tools like PSEmpire and CobaltStrike. These tools allow living off the land techniques to be chained to perform Execution, Persistence, or Defense Evasion tasks.
The framework was able to identify several multi-technique attack chains using exclusively process creation events. Discovery (Fig 7) and Lateral Movement (Fig 8) we discovered and highlighted for analyst review.
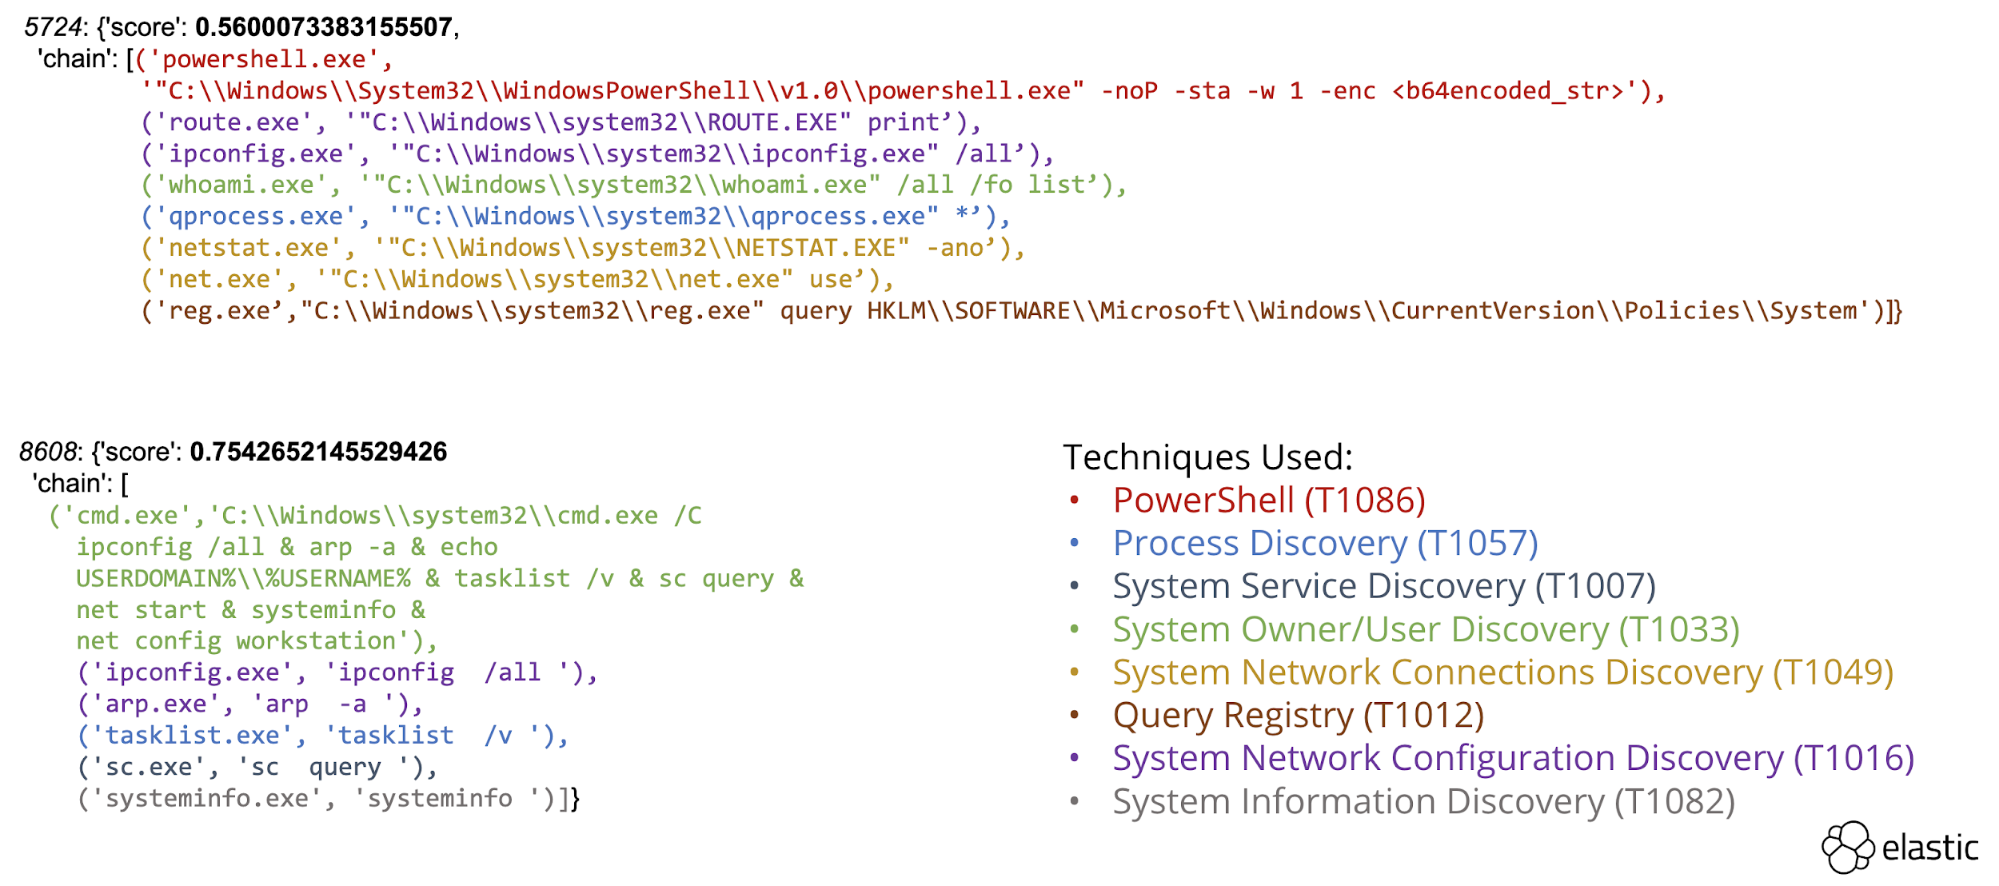
Fig 7 - Process chain performing “Discovery” techniques
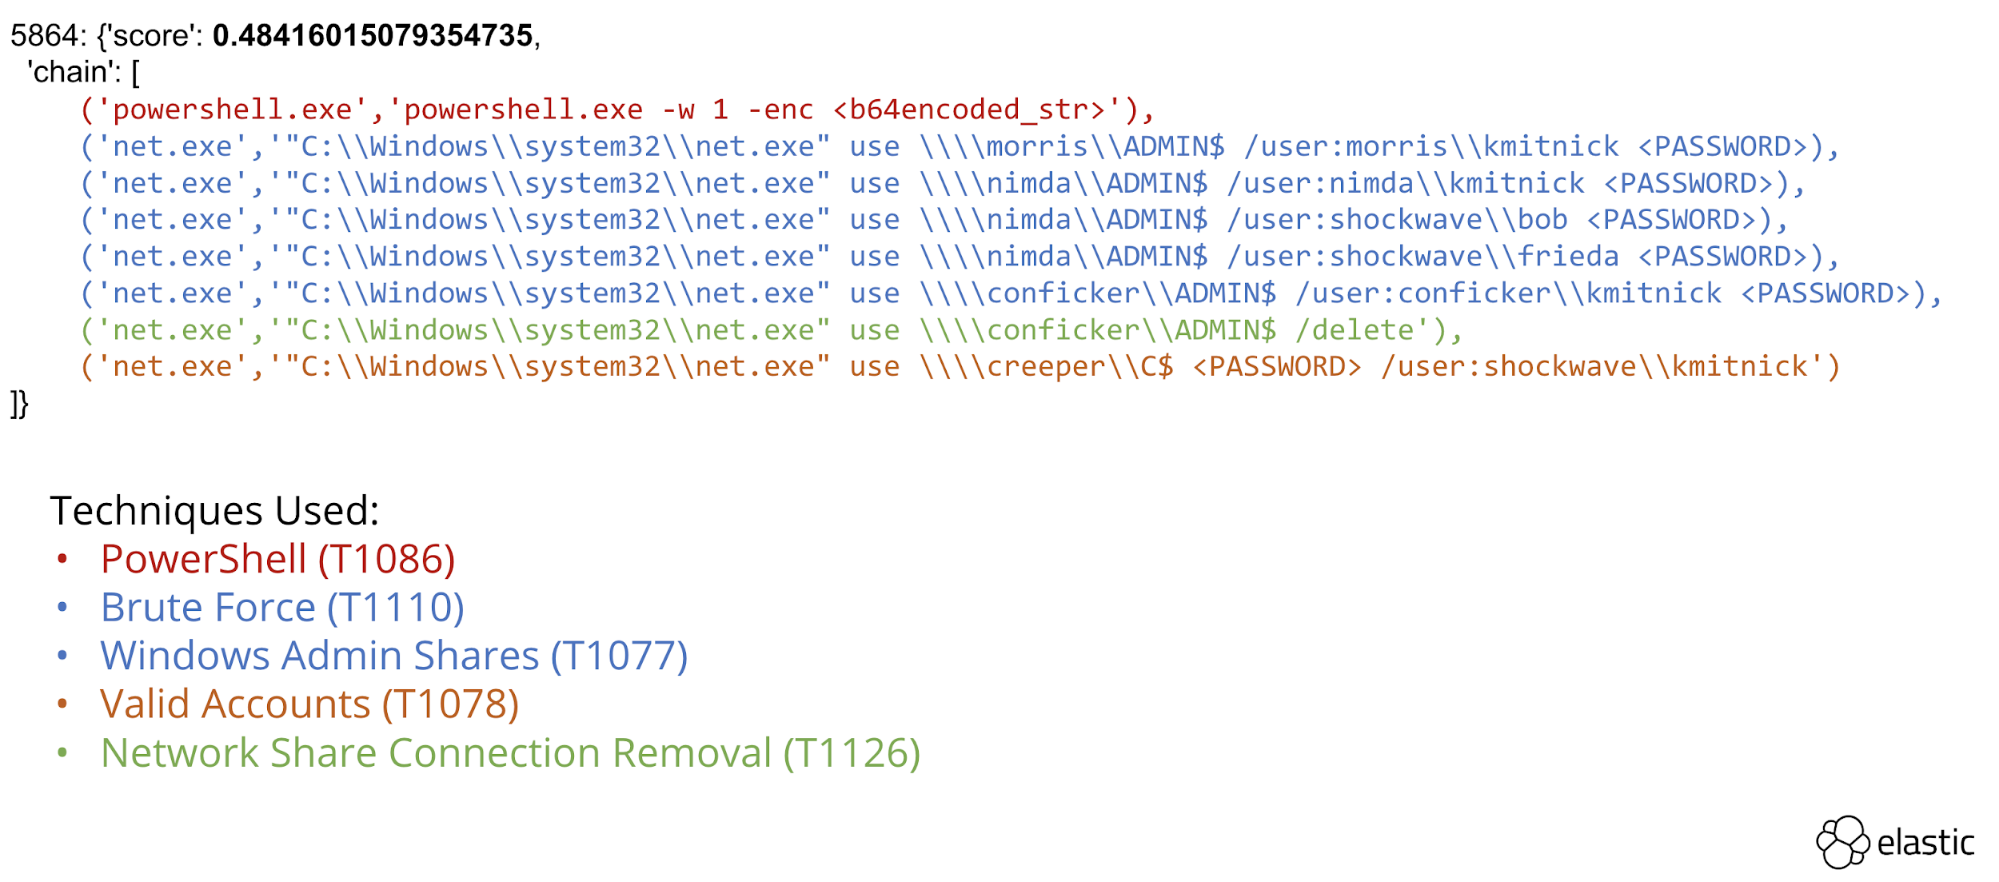
Fig 8 - Process chain performing lateral movement
Data reduction
A byproduct of our approach is not only the ability to discover anomalous process chains, but also the ability to demonstrate the value of the prevalence engine in suppressing false positives. In combination, we were able to drastically reduce the amount of event data that needed to be reviewed by an analyst. By the numbers:
- We tallied ~10K process creation events per endpoint in the APT3 scenario (5 endpoints total).
- We identified ~6 anomalous communities per endpoint.
- Each community consisted of ~6-8 events apiece.
Looking ahead
We’re in the process of taking this research from proof-of-concept to integrated solution as an Elastic Security feature. The most promising feature is the \prevalence engine. Prevalence engines highlighting frequency of occurrence of files are common, but describing prevalence of relationships between events will help security professionals detect threats in new ways, both by looking at what is rare/common in their enterprise and eventually augmented by measurements of what is rare globally.
Conclusion
We presented this graph-based framework (called ProblemChild) at VirusBulletin and CAMLIS last year with the goal of reducing the need for domain expertise in the detector writing process. By applying supervised machine learning to derive a weighted graph, we demonstrated an ability to identify communities of seemingly disparate events into larger attack sequences. Our framework applies conditional probability to automatically rank anomalous communities, as well as suppress commonly occurring parent-child chains. When applied towards both goals, this framework can be used by analysts to aid in the crafting or tuning of detectors and reduce false positives over time.