Seven Tips for Better Elasticsearch Benchmarks
This blog post is based on the talk Seven Deadly Sins of Elasticsearch Benchmarking at Elastic{ON} 2018.
Performance is a key feature of Elasticsearch. Our development team runs benchmarks to evaluate the performance characteristics of new features or to measure the effectiveness of performance improvements. Benchmarks also guide our decisions for good out-of-the-box defaults for Elasticsearch. To measure changes in performance over time we run nightly and release benchmarks with our benchmarking software Rally.
In this blog post, we want to share our experiences and provide seven tips to keep in mind when you are benchmarking. While we use Elasticsearch as an example you can use these guidelines to benchmark a variety of systems.
1. System setup
On which hardware and software do you run benchmarks? The benchmarked system needs to be as close to production as possible (hint: a developer laptop is not close). Differences in hardware, software versions or system configuration will affect performance. Also consider the network in which you run: The only traffic on that network should be due to your benchmarks.
You also need to ensure the entire system is tuned to get reproducible numbers. This means for example:
- Keep the software stable: Different JVM or kernel versions will have an impact on performance.
- Review and turn off system daemons if necessary: You do not want to skew your results because a system maintenance job is running in the background.
In cloud environments you might not have full control over all parameters like JVM or other system settings. You should still aim to keep all parameters constant that are under your control. For example, you should perform all your experiments on the very same instance. Use statistical tests to check whether differences in performance are statistically significant (see also tip seven).
2. Warm-up
You don't get peak performance from the first second. For example, the JVM has a just-in-time (JIT) compiler built-in that optimizes hot code paths at runtime. Therefore, it takes time until the system has stabilized.
Buffers absorb (initial) spikes and thus throughput in the beginning might be better than sustained throughput. Also, caches avoid that potentially expensive operations are done multiple times. And caches are everywhere: in the CPU or other hardware, the operating system and the application.
Therefore:
- Define an explicit warm-up phase in your benchmarks. JITWatch visualizes JIT compiler behavior and can help you to settle on a "good" warm-up period.
- Think about buffers and caches in your system. Measure cache hit rates on various levels to ensure you are exercising the entire system and not only caches.
In the picture below you can see how indexing throughput in Elasticsearch behaves over time in a benchmark. The red part is the warmup phase, the blue one the actual measurement phase. We see that throughput is steadily rising. Due to empty buffers the system is even able to absorb even more load at the beginning. Over time the system stabilizes and we begin measuring.
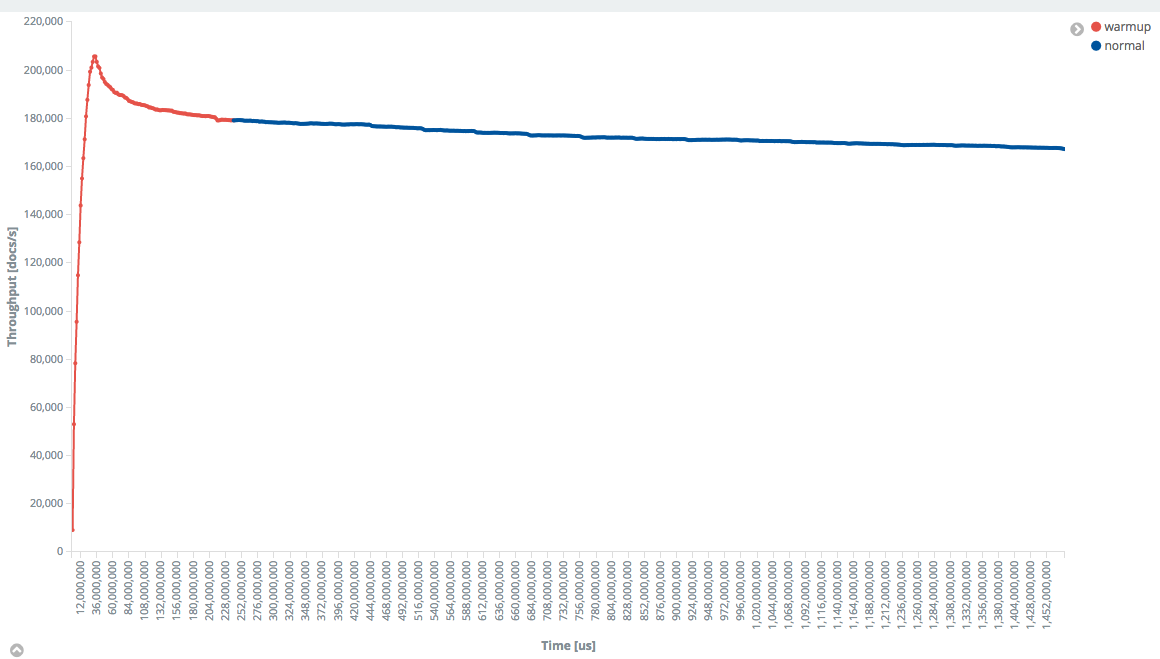
Rally supports warmup out of the box. You can either choose to use a specific time-period for warmup or run an operation for a certain number of warmup iterations (see docs). It will record all samples and tags each one with the sample-type “warmup” or “normal” so you can clearly see which is which.
3. Workload
You should model the same access patterns in your benchmark as in production. How many clients are hitting your system concurrently? Are they independent of each other (think: several Internet users hitting your system)? What queries are executed, how often and at what times during the day do you run batch jobs? You should ask yourself these questions when creating a benchmark.
There are two important classes of API calls which you need to treat differently in benchmarks:
- Interactive operations, for example, searches: Limit the throughput on these operations to a realistic level. In Rally you can specify that with the target-throughput property. You can use your production metrics as guidance for what value to choose. Humans don't like to wait, hence measure request latency.
- Batch operations, for example, bulk indexing: Run at maximum throughput and measure the achieved throughput. For batch operations finishing as early as possible (high throughput) is more important than a low request latency.
Limiting the throughput of interactive operations is crucial for getting more realistic results. Latency is determined by two components: Waiting time and service time. For example, in a coffee shop, the waiting time is the time you spend in the waiting line and the service time is the time it takes the barista to prepare your coffee. If you saturate the system, latency is dominated by waiting time. In our coffee shop example, this means that if new customers arrive all the time, the barista is always busy and the waiting line is long. Hence, customers spend most of their time waiting to get in front of the line. This is not how you operate your systems in production so limit throughput to a sustainable level. For a more in-depth explanation of this phenomenon, we recommend you read Relating Service Utilisation to Latency.
One other important aspect to consider is clients arrivals at your endpoint. There are two typical cases:
- Open systems: New requests arrive independently of each other. This is typical for Internet services as users do not coordinate with each other.
- Closed systems: A new request arrives after a previous request has finished. “Think time” in between requests is used to throttle throughput. An example for this behavior is an internal batch job that synchronizes your relational database with Elasticsearch.
Both systems behave very differently and thus it is important to model the correct type of system to get realistic results. Different load generators support different models, for example Rally implements an open system model. If you are interested in this topic, the paper Open Versus Closed: A Cautionary Tale provides a good overview of the differences in behavior of open and closed systems.
4. Benchmarking software has bugs too
Benchmarking software, like any other software, has bugs so don't trust the results per se. Set up experiments to see how the benchmarking software behaves. Some scenarios that you want to consider:
- What is the maximum throughput that the benchmarking software can achieve? You can use a mock target that returns static responses to stress-test the benchmarking software.
- Does the benchmarking software recognize and report request errors? Consider you mistype a request path and the target system returns HTTP status code 404 (“not found”). Usually, producing an error response is cheap for the target system so your response times might be spectacularly low.
- Is the client aborting requests because the socket timeout is too low?
5. Beware of Accidental Bottlenecks
Your benchmarking environment is a system consisting of many components. In a benchmark, you want the target system to be your bottleneck, otherwise you will get bogus results. We already mentioned that your benchmarking software might be the bottleneck if it cannot inject enough load. Another common problem is that the network in between is saturated. In the former case, you measure the performance of your benchmarking software and in the latter the maximum performance of your network instead of measuring the performance of your target system.
Approach your search for bottlenecks methodically and check for example with the USE method developed by Brendan Gregg.
6. Use a Structured Process
Chaos is all too common in benchmarking, yet it is poisonous. Follow this process:
- Reset the environment to a known stable state
- Change one variable
- Run the experiment
It sounds simple but is hard to do in practice. Some specific tips:
- Document your known stable state including hardware specification, kernel version and JVM version. Rally can help you here as it records meta-data for each metrics record.
- Use the very same hardware and software for all your benchmarking experiments. This is especially important in cloud environments: Different results on different instances (of the same type) might either be due to instance-to-instance variation or it might be a real difference. You cannot tell.
- Reset transient and persistent state: Reboot machines and consider trimming your SSD before each benchmark.
7. Statistics to the Rescue
When benchmarking each configuration just once you are ignoring run-to-run variation. Even if you are tightly controlling every variable that you can (see the previous section), there is still run-to-run variation: The garbage collector runs at different times, the JIT compiler might optimize slightly differently, client requests have different interleaving or the OS scheduler might decide to migrate your process to a different CPU. Therefore, you need to repeat the same experiment multiple times and conduct a statistical significance test. We recommend you read section 3 in the paper Statistically Rigorous Java Performance Evaluation for a detailed how-to guide.
Summary
Benchmarking is tricky: It's simple to create a script that generates load and produces some numbers. But as you have seen, it is hard to come up with meaningful numbers. Pitfalls await at every corner: Which hardware do you choose? How do you model user behavior? Can you be sure that you are really benchmarking the target system and not - say - the network in between? And you do you make sense of the numbers you get? We hope that with these seven tips you are able to get better measurements to guide your decisions.
The title image Apple puzzle has been created by Salvatore Gerace and is licensed as CC BY-SA 2.0.