Monitoring a NATS messaging system with Beats
In a world where stateless applications are optimized to run blazingly fast, message exchanging cannot be allowed to affect their performance. Having the ability to process millions of messages per second, NATS is the sprinter of messaging systems.
While benchmarks are good indicators for choosing a tool, there is no way to confirm its value without monitoring its performance in production. As a team working together in the telecommunications sector, we're building NFV solutions on top of Kubernetes microservices, and we're using NATS as a messaging system to ensure the resiliency of the critical paths. These include the communication between the software components running on the clients’ data centers and our centralized platforms. It has allowed us to achieve high rates of message exchanging with great reliability. In this regard, we need to assure its health by providing actionable visibility in real-time. Given the fact that we use EFK to monitor our Kubernetes stack, monitoring of NATS had to be achieved by the exact same way.
Everything started with a goal: Ship NATS monitoring data to Elasticsearch.
What we achieved: Extending Beats, by providing NATS modules for both Metricbeat and Filebeat shippers. Get on board to find out how!
Motivated by an internal hackathon
We wanted results and we wanted them fast, but our internal backlog was full of requirements forcing our time to be very limited. Luckily, our company was organizing its annual hackathon. Without hesitation, we grabbed the opportunity to work on creating our own NATS Beat by leveraging the Beats extension mechanism. After two days of effort our NATS Beat succeeded into becoming part of the official list of community Beats. And that was only the beginning. Intrigued by the idea, the Elastic Beats team encouraged us to put our code into the core Beats project. With their support, we managed to develop a Metricbeat module for metrics collection, and a Filebeat module, for log aggregation. Today, NATS monitoring is deeply integrated into the core of Beats upstream.
How to monitor NATS
NATS is very helpful when it comes to providing monitoring data. If requested, NATS server can serve such data in JSON format by exposing four different HTTP endpoints:
- /varz: reports general statistics such as CPU utilization, memory consumption, etc.
- /connz: reports detailed information on client connections
- /routez: reports information on routes between servers of the NATS cluster
- /subz: reports detailed information about current subscriptions and the routing data structure
By querying these endpoints in a periodic way, user can understand a lot about the running state of his messaging queue. And so we did with the brand new NATS module of Metricbeat.
But NATS can provide more. Another interesting place to find useful information regarding monitoring is the server’s logs. If requested, NATS server can provide TRACE level logs for every message received or transmitted. These log entries can be proven really valuable if handled properly. Our NATS module for Filebeat did exactly that. Every log is parsed and all its meaningful bits are squeezed out of it.
NATS as a Metricbeat module
As it happens with any Metricbeat module, NATS needs to be activated and configured accordingly in order to fetch the data from the monitoring endpoints. Upon configured properly, it fetches data from the endpoints, curates them accordingly and ships them to Elasticsearch.
Configuration
The module can be configured as simple as this:
metricbeat.modules:
- module: nats
  metricsets: ["connections", "routes", "stats", "subscriptions"]
  period: 10s
  hosts: ["localhost:8222"]
  stats.metrics_path: "/varz"
  connections.metrics_path: "/connz"
  routes.metrics_path: "/routez"
  subscriptions.metrics_path: "/subsz"
  enabled: true
The above configuration provides the location of the NATS server(s) we want to monitor, the query interval for metrics, which metrics to fetch and the URIs under which they can be accessed.
Let the metrics speak
Fetching the data is one thing. Sending them to Elasticsearch is another. But what is the value of storing them if you cannot visualize them? With that in mind, this module ships with a pre-built dashboard which can be loaded automatically from Beats and give a good starting point to the user.
Let’s take a sneak peak:
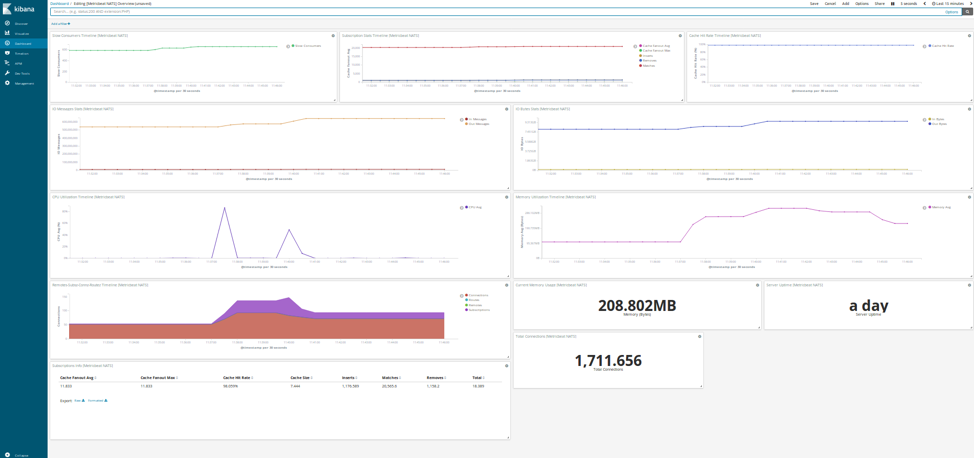
Users can detect slow consumers which may affect NATS performance, monitor how NATS cache is performing, or even realize the utilization of resources made by our NATS servers. Additionally, users can correlate the stored data according to their needs and extend the dashboard. It is in their hands!
NATS as a Filebeat module
After making Metricbeat module a reality, a brilliant idea was put on the table: Is there something we could do for NATS server logs? The answer was standing in front of us… Filebeat!
And so we did. Filebeat is an agent dedicated to fetching logs, parsing them with a wide range of text processors, and creating docs out of them in an Elasticsearch index. But to go far you need to start simple. Our very first version of NATS module was just extracting log timestamp, level, and message, and putting them into the datastore. The second version though is taking it to the next level. After investigating all log patterns we processed the log messages even more. The outcome is far more interesting, it can be visualized and it can offer a much deeper understanding of the NATS cluster’s state
Configuration
Filebeat module can be configured as the Metricbeat module by adding the following lines to the configuration file:
filebeat.modules:
- module: nats
  log:
    enabled: true
    var.paths:
      - /var/log/nats/nats.log*
As it can be easily observed, apart from enabling the module, the only configurable field a user has to set is a list of log path regular expressions. Given the location of the logs, NATS module has everything it needs to start scraping data from them.
Logs as a Dashboard (LAAD)
As the title implies, NATS module gives the opportunity to visualize the logs that the user's NATS cluster is producing. With the pre-built dashboard accompanying the module and the log trace option enabled to NATS server, user can come up with a dashboard as interesting as the following:
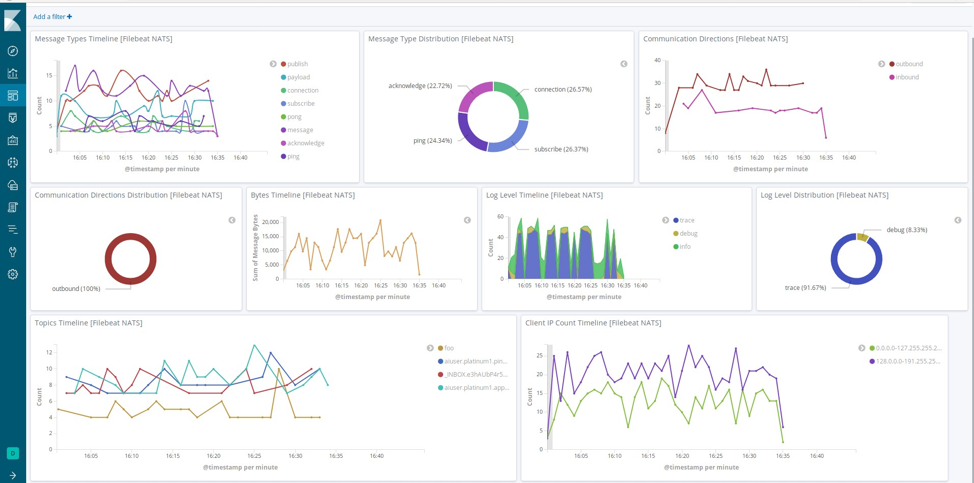
Filebeat dashboard can provide various forms of data and statistics. Users can observe the distribution of messages by its type, the heat received by the NATS subjects, and the type of logs produced in a timeline. Furthermore, users have a good indicator on messages’ traffic, both incoming and outgoing, as well as the IP range distribution of the clients. The most interesting part: All of the above can happen with a click of a button!
At the end of the day
All in all, time invested on this effort was definitely worth it. Not only did we solve our problem of NATS monitoring, which could be achieved with only the community Beat, but we also gained a lot of experience on the way. We had the chance to work with excellent engineers from Elastic and we felt the joy of giving back to the community. So it goes without saying that we enjoyed that and we would suggest such kind of contributions to everyone who faces similar situations.
Are you a NATS user? Download Metricbeat 7.0 and build Filebeat master branch, enable the NATS modules, and start looking under the covers to see what you can discover about your NATS environment.


Christos Markou is a systems and software engineer that's passionate about distributed systems and cloud technologies. He has hands-on experience in web services, cloud computing and large system architecture, and is an open source enthusiast with various contributions in high class projects.