Kibana 7.4.0 released
Today we are pleased to announce the release of Kibana 7.4.0. This release introduces some blockbuster features that will be core to your experience in Kibana. From PKI authentication to saved queries to customizing the time range for each panel on a dashboard, 7.4 will take your Kibana usage to the next level.
And that’s just the beginning! Also packed in this release are advancements like snapshot lifecycle management to simplify backing up data, outlier detection to detect anomalies in transforms, geospatial analytics on network data in SIEM, custom color ramps for data classification in Maps, and Metrics Explorer enhancements to personalize your infrastructure monitoring views.
Excited already? Take 7.4 for a spin by deploying Elasticsearch and Kibana on Elastic Cloud - the only hosted Elasticsearch offering to include these new features. If you’d like to try 7.4 in a self managed environment or simply take it for a test drive on your laptop, you can always download the latest versions of Kibana and the Elastic Stack.
For a full list of bug fixes and other changes, be sure to look at the Kibana 7.4.0 release notes. Kibana Plugin API Changes in 7.4 also provides visibility into the modifications made to Kibana APIs in this release.
Security — PKI Authentication and copy to Space
PKI authentication
Building off the success of features like feature controls in 7.2 and support for Kerberos in 7.3, we are excited to announce support for another highly requested authentication mechanism, Public Key Infrastructure (PKI). With native support for PKI authentication, users are now able to log into Kibana using X.509 client certificates and a two-way encryption system. This provides new ways to authenticate Kibana — from general client certificate authorization to identity card access. Ready to start using PKI in production? Check out our documentation.

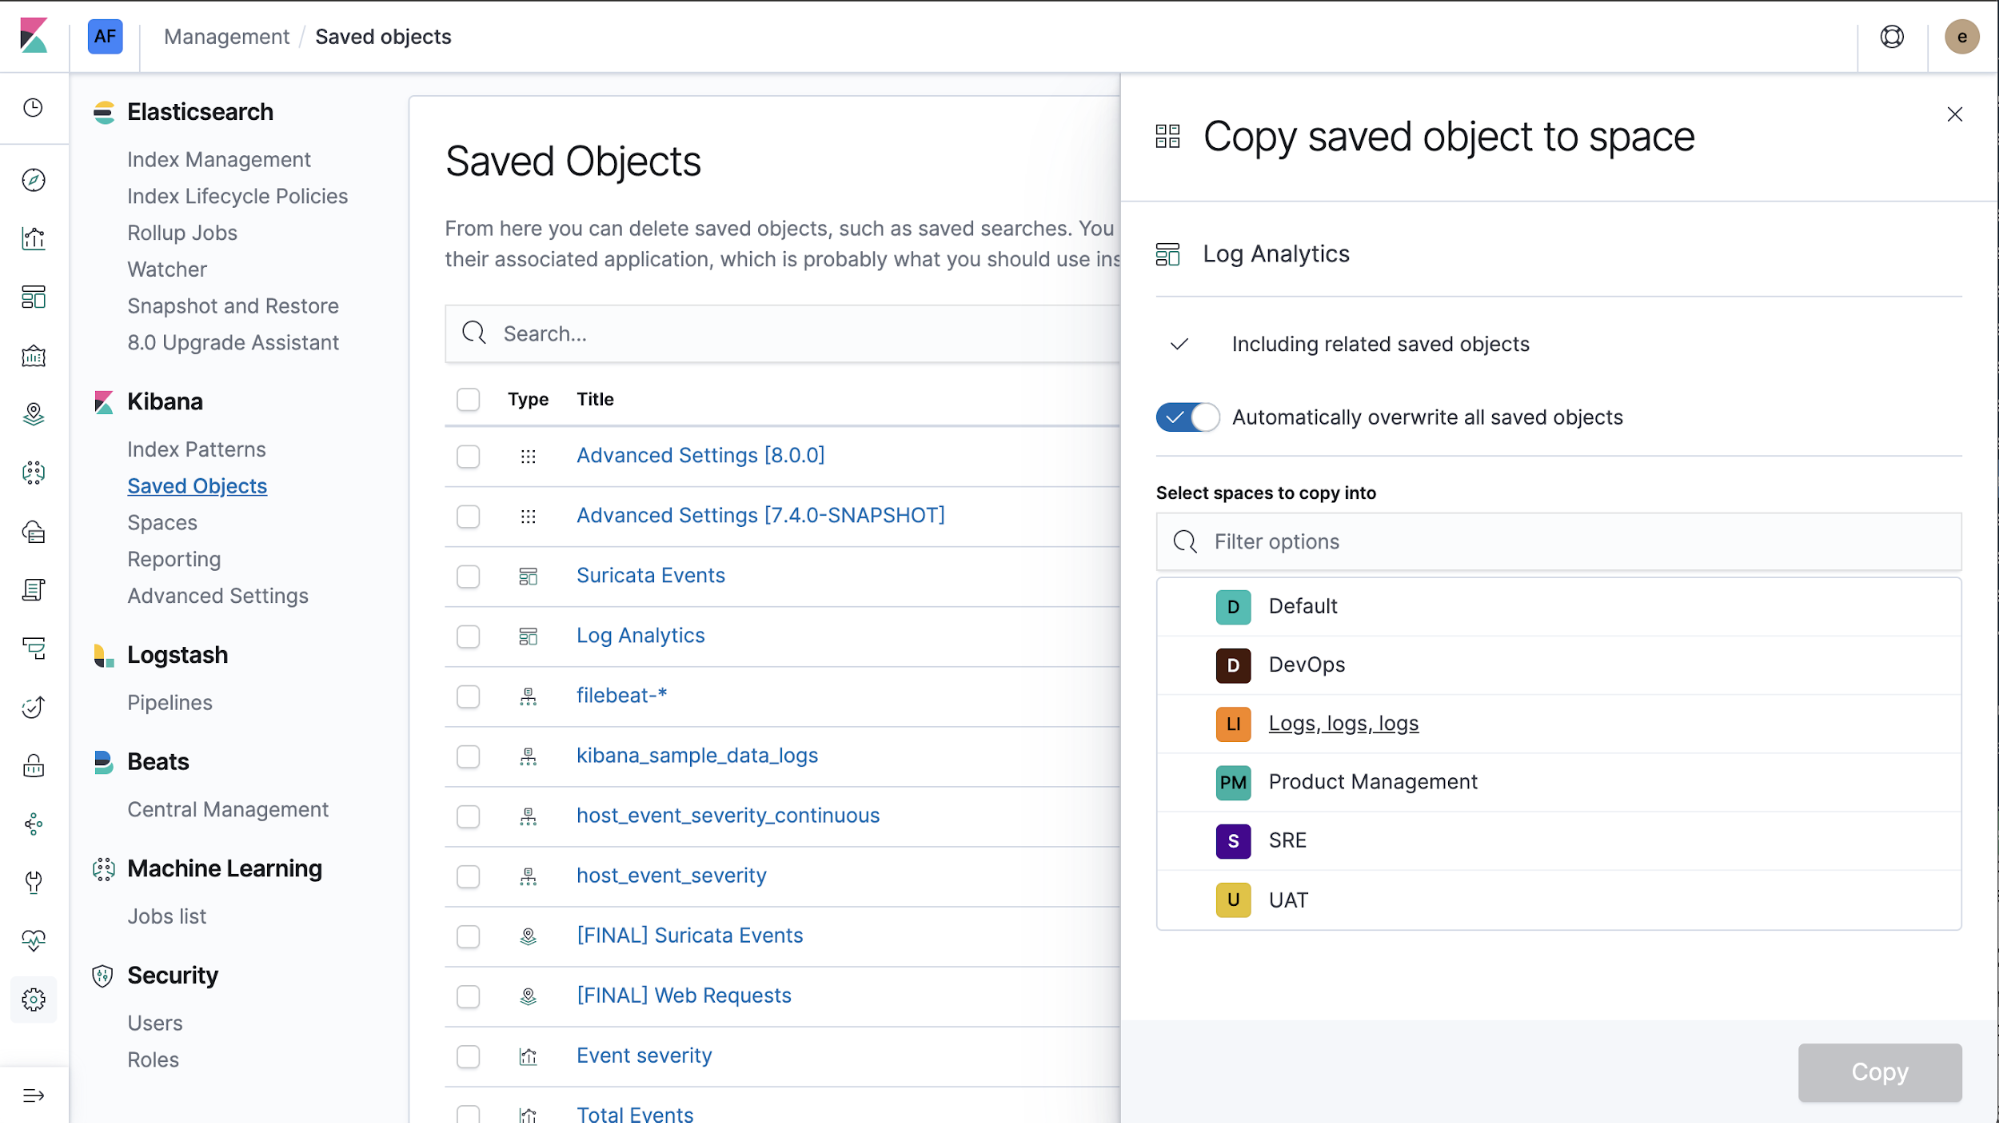
Copy to Space
7.4 makes it significantly easier to share dashboards, visualizations, maps, Canvas workpads, saved searches, and more across Spaces. You can now securely copy saved objects across spaces with the click of a button.
Core features with a big impact
There are some momentous features in core Kibana in 7.4, some of which have been long-standing requests from our community. We are very excited to see these features production ready in our latest release.
Reusable saved queries and filters
Have you ever written a query in Kibana that you’ve wanted to reuse? Do you have a copy-and-paste cheat sheet of queries stored somewhere that you refer to on a regular basis? With saved queries in 7.4, you can now save queries and filters for reuse across Discover, visualizations, and dashboards. This is an exciting new feature that we expect to be heavily used and a central tool of Kibana power users.
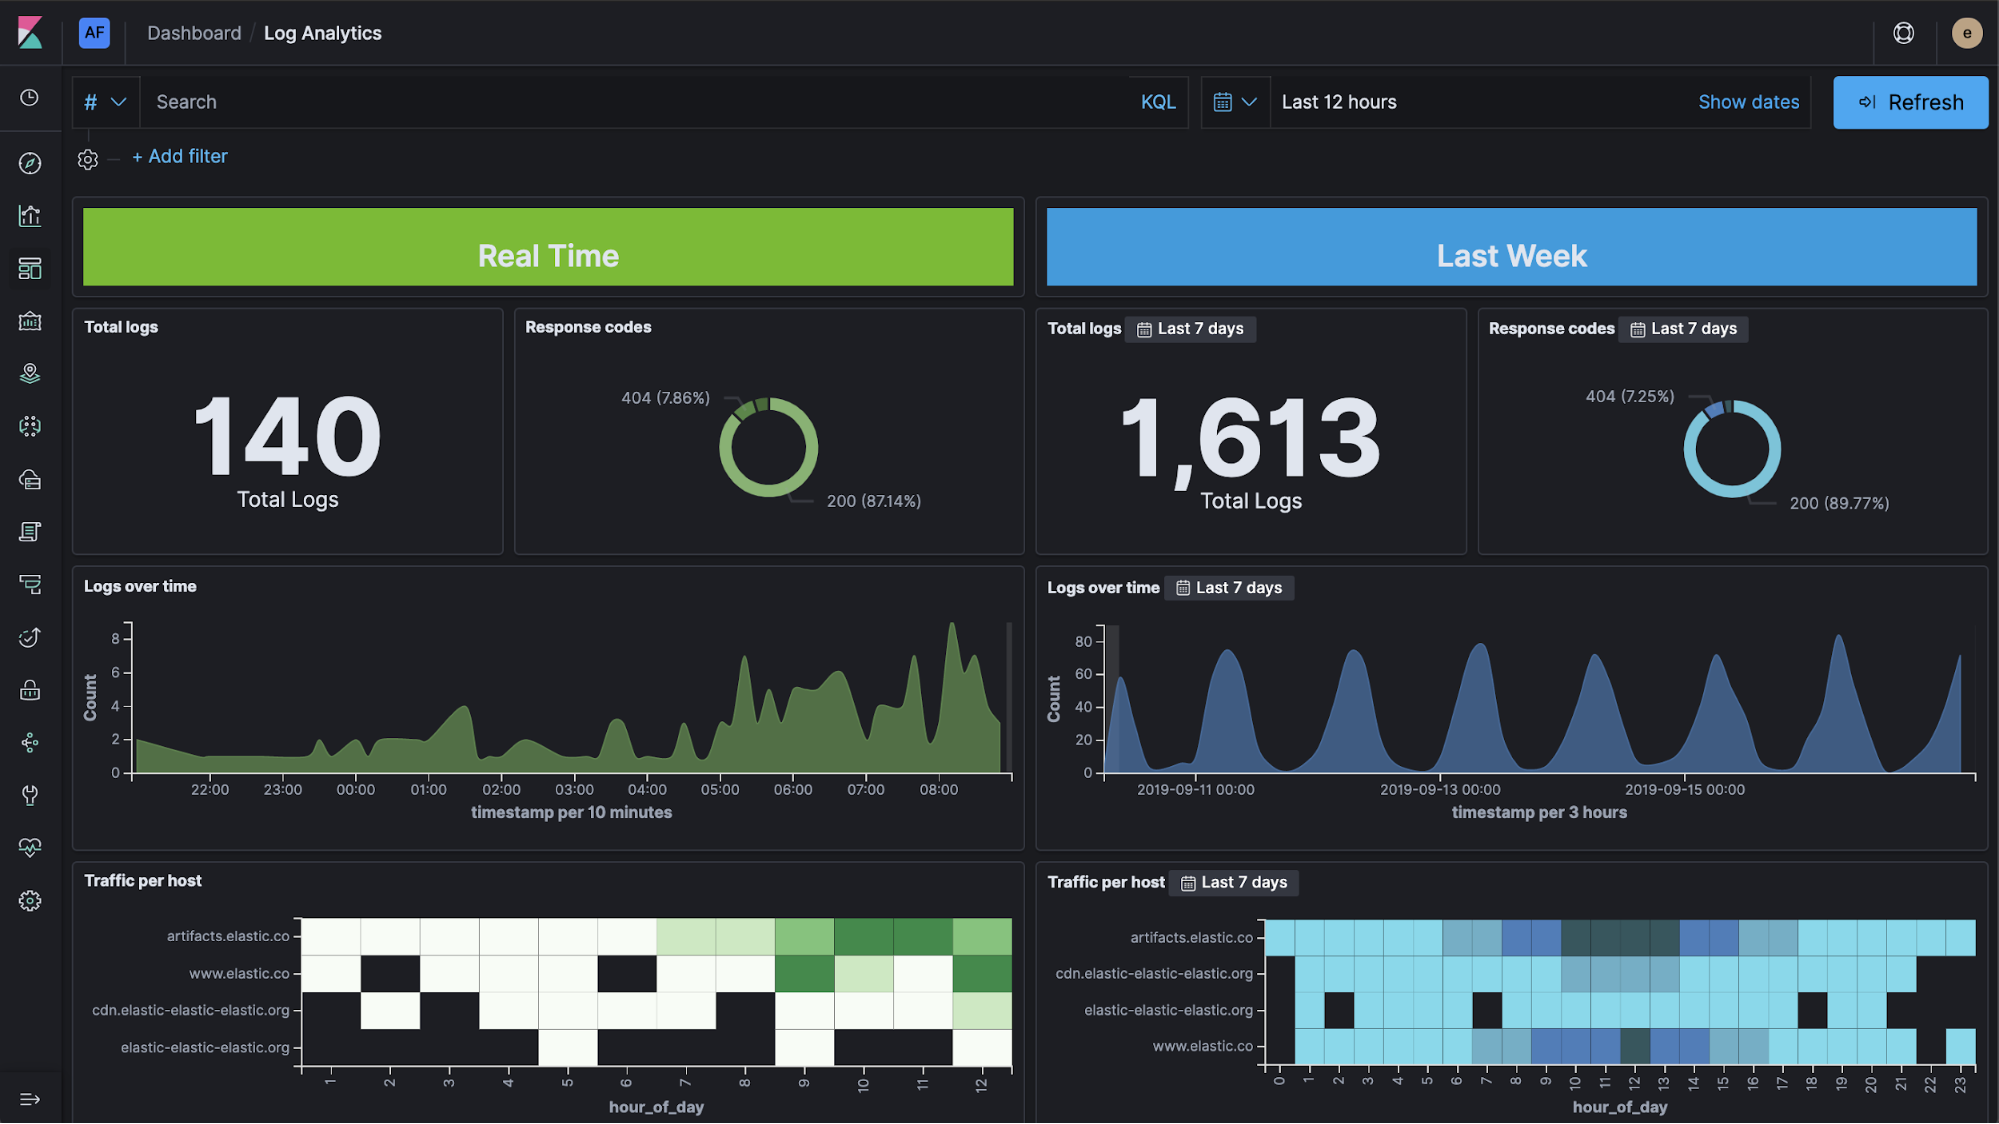
Custom time range for dashboard panels
Dashboards got an impressive upgrade as well. Up to this point, all panels in a dashboard were explicitly controlled by the global time picker. Applying a global time range to all indices in a dashboard makes it easy to interact with your visualizations and understand your data sets. But have you ever wanted to show multiple time ranges in the same dashboard?
The newest configuration option for a dashboard panel allows you to do exactly that. You can add a visualization, saved search, or map to your dashboard, and configure each for a specific time range. All while preserving the functionality that the global time picker provides for the panels that are not restricted to a specific time range.
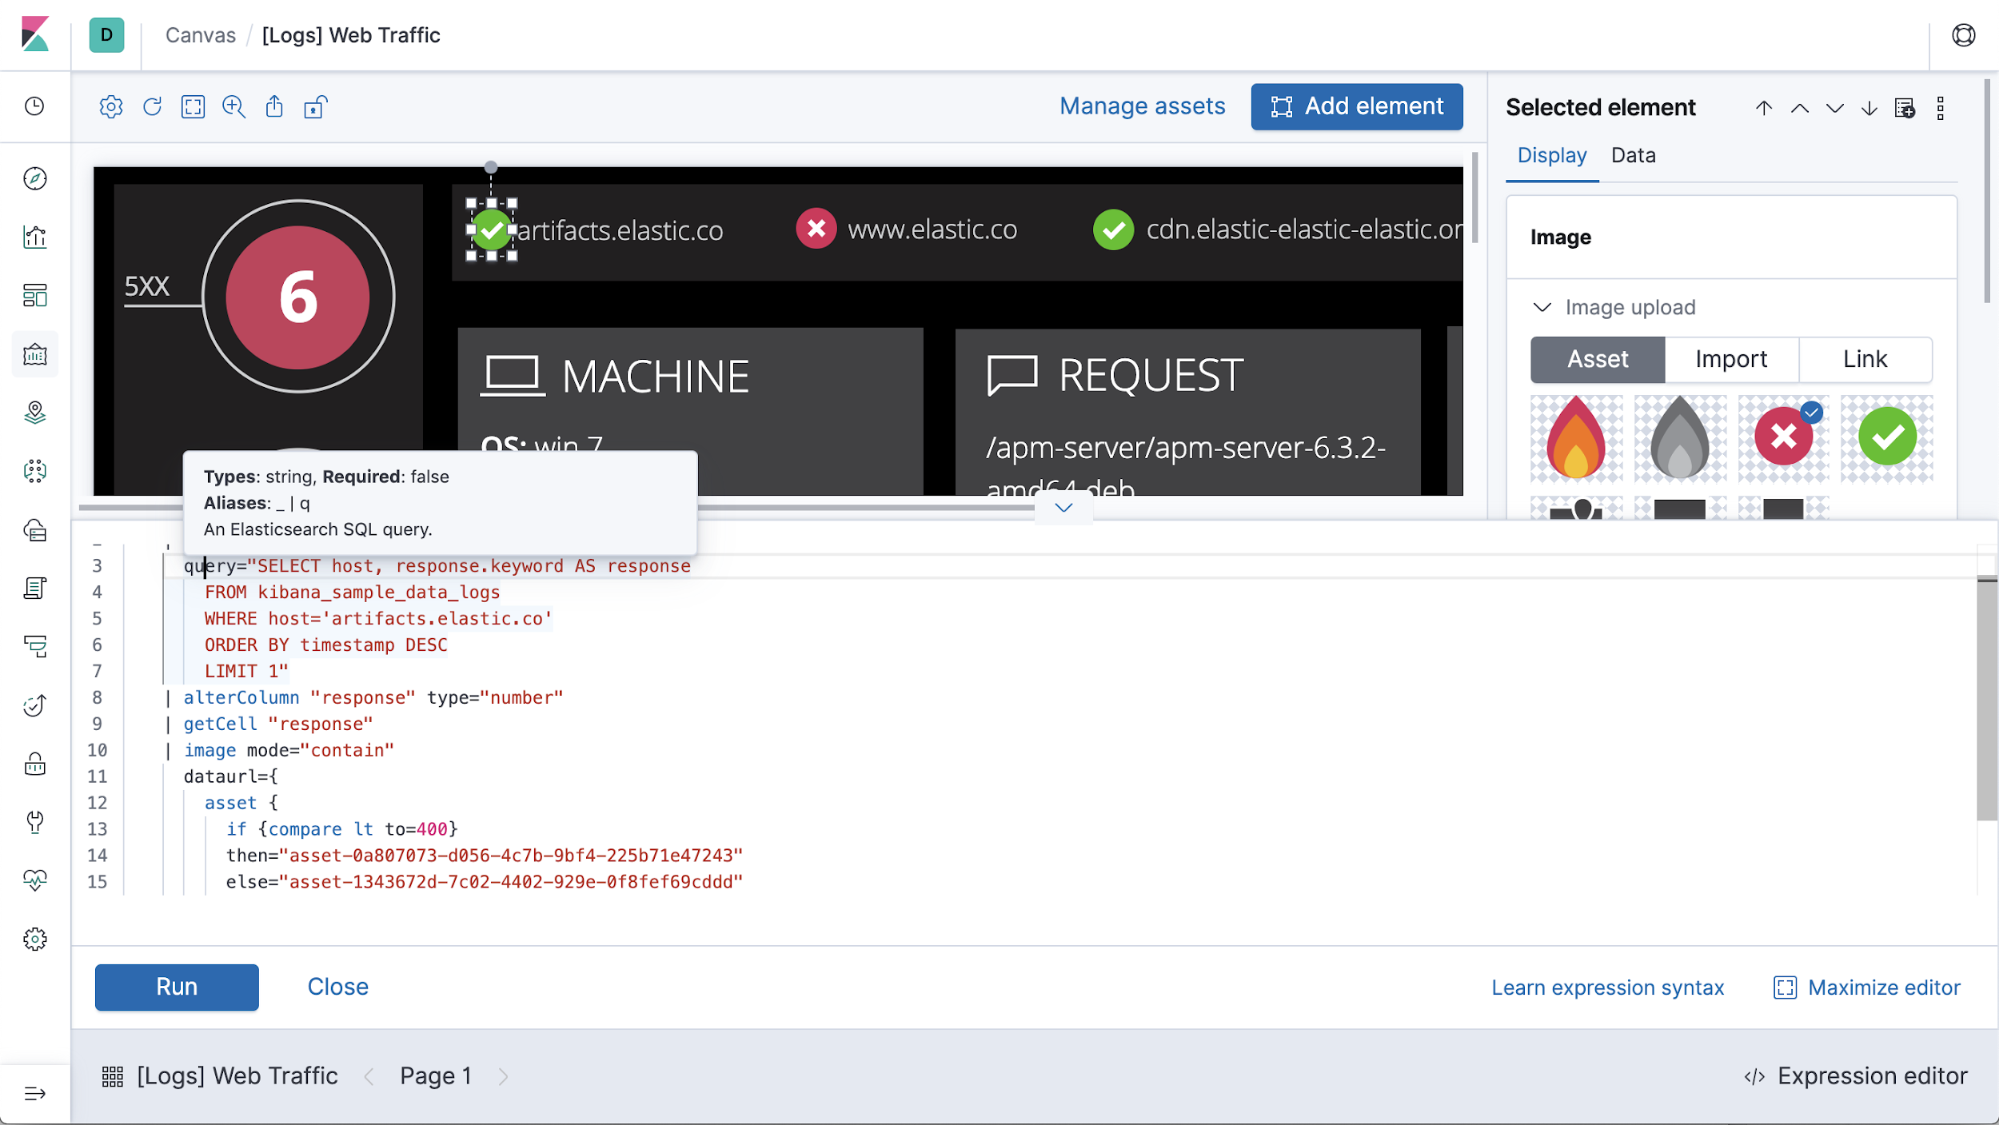
Complex expressions in Canvas just got easier
Canvas has a number of enhancements in this release. For those who are now experts in the expression language that powers Canvas elements, we added a Monaco editor and support for full screen mode. Gone are the days of writing your expressions in a separate code editor and copy and pasting them into Kibana.
Cluster management and administration
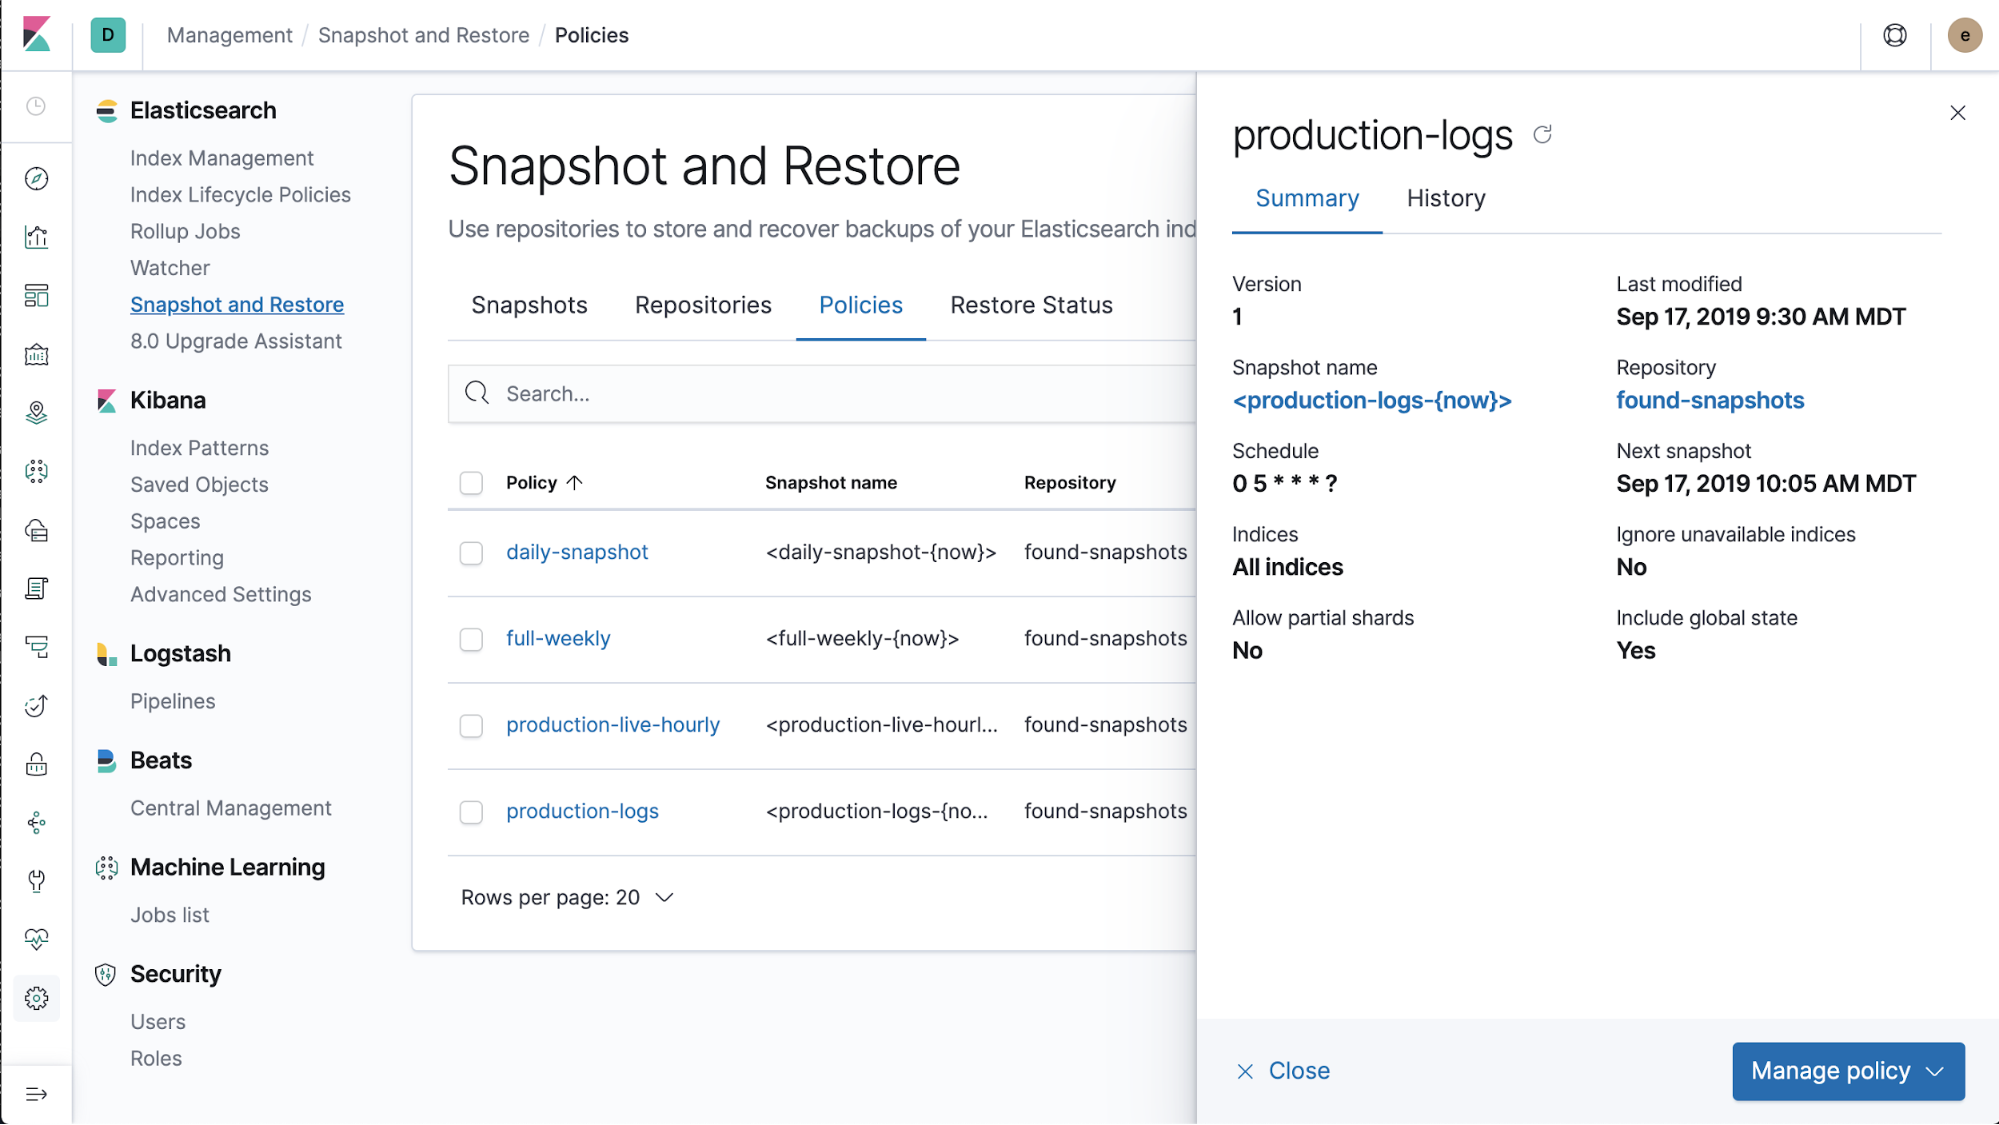
Improved backup and restore with snapshot lifecycle management policies
Building off the snapshot and restore capabilities introduced to Kibana in 7.2, Kibana has a new tab in the snapshot and restore UI for the newly introduced snapshot lifecycle management policies in Elasticsearch. The new policies tab in the management UI provides a detailed view into your snapshot status, quick insight into the history of snapshots taken with the defined policies, and a wizard that takes you through creating a new policy.
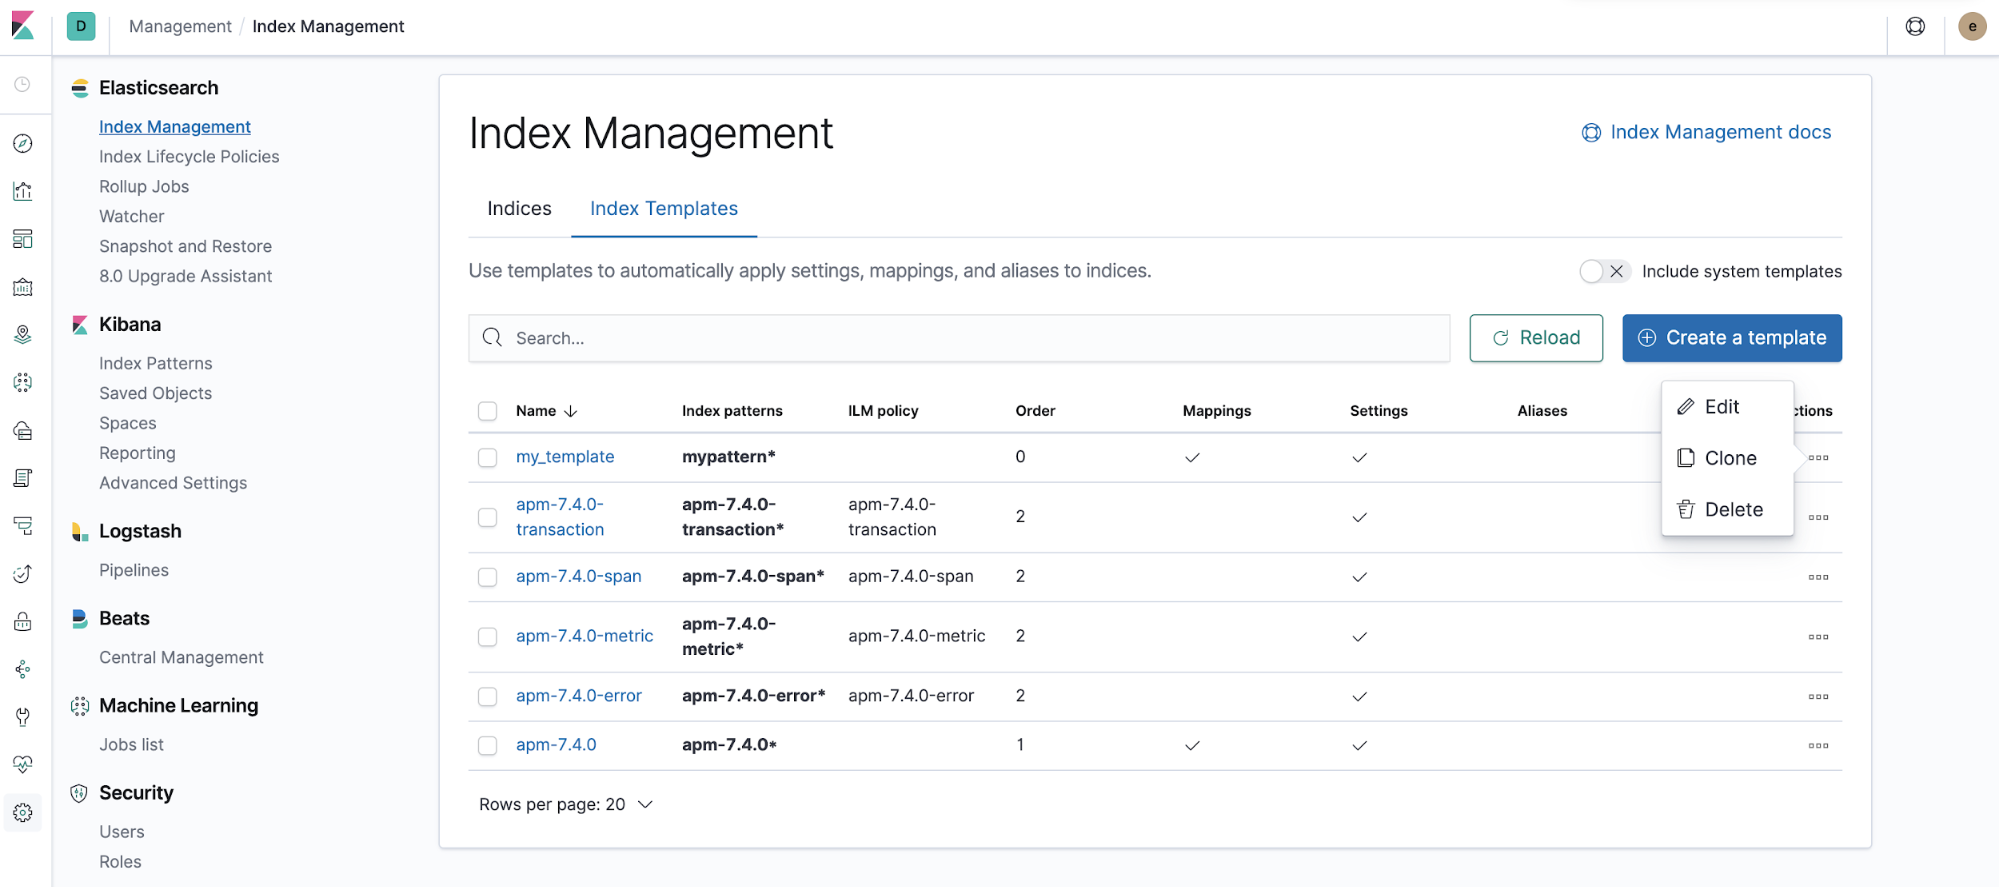
Manage index templates from Kibana
The index management view in Kibana continues to evolve with the latest iteration providing cluster administrators the ability to manage their index templates directly in this UI. The index template creation wizard will walk you through the steps of creating an index template, and (optionally) defining index settings, mappings, and aliases for your indices.
That’s just the tip of the iceberg! Be sure to check out the full release highlights in the Elasticsearch 7.4 blog post.
Detect outliers in transforms & optimized job configuration
Outlier detection on transforms (experimental)
In 7.3, we added an API that provided outlier detection analysis. Building off this, we now have a new view in Machine Learning wherein you can create, manage, and view your outlier detection jobs and their results. Because the results are just another index, you can create some great visualizations and maps based on the outliers found in your entity-centric data.
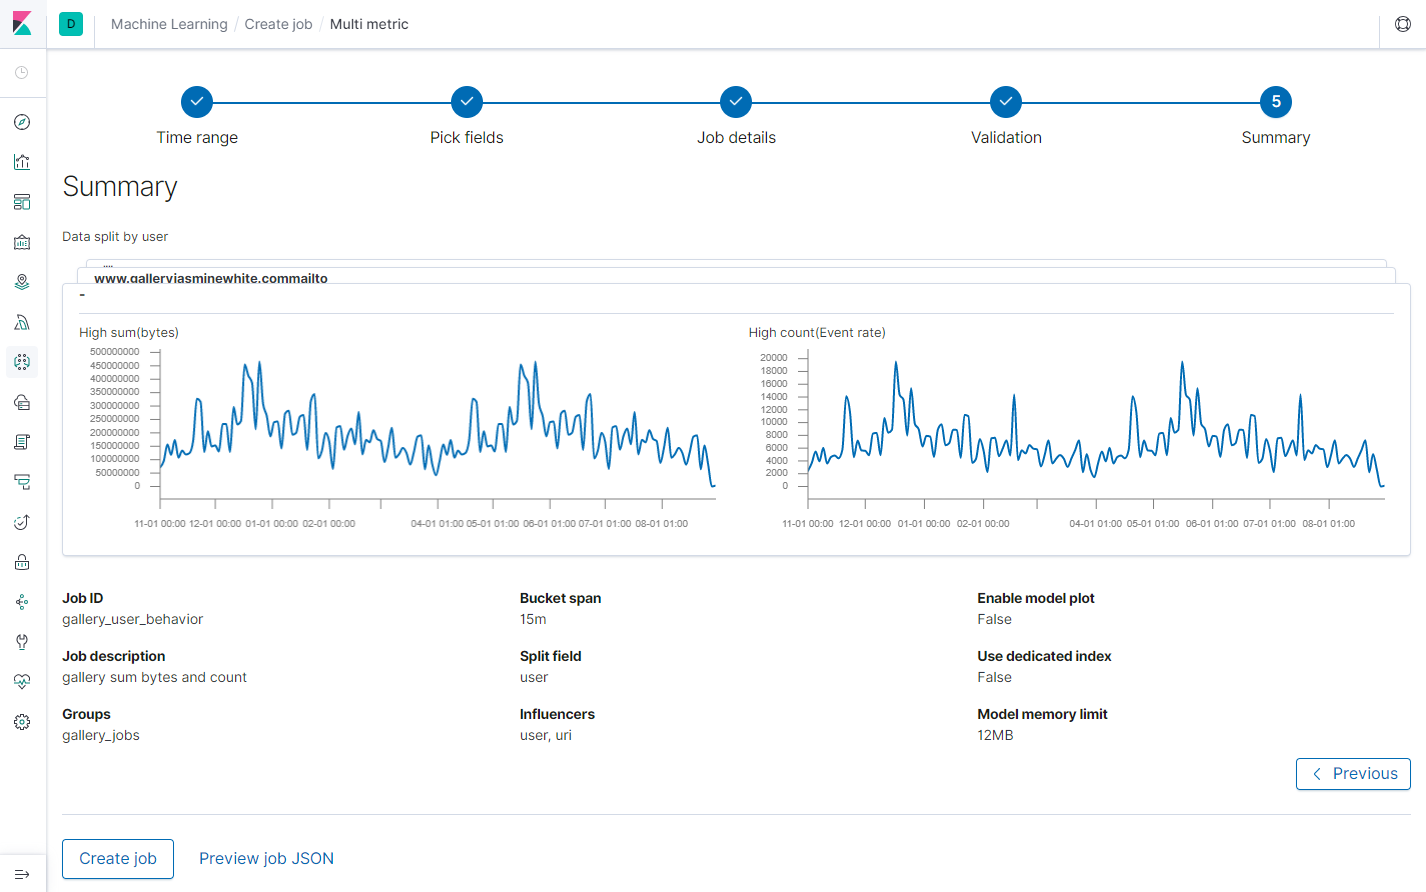
Simplified machine learning job configuration
The machine learning job creation wizard just got a face lift! Single metric, multi metric, and population jobs now have a much more streamlined, step-by-step approach to creating the machine learning job that makes the most sense for your data.
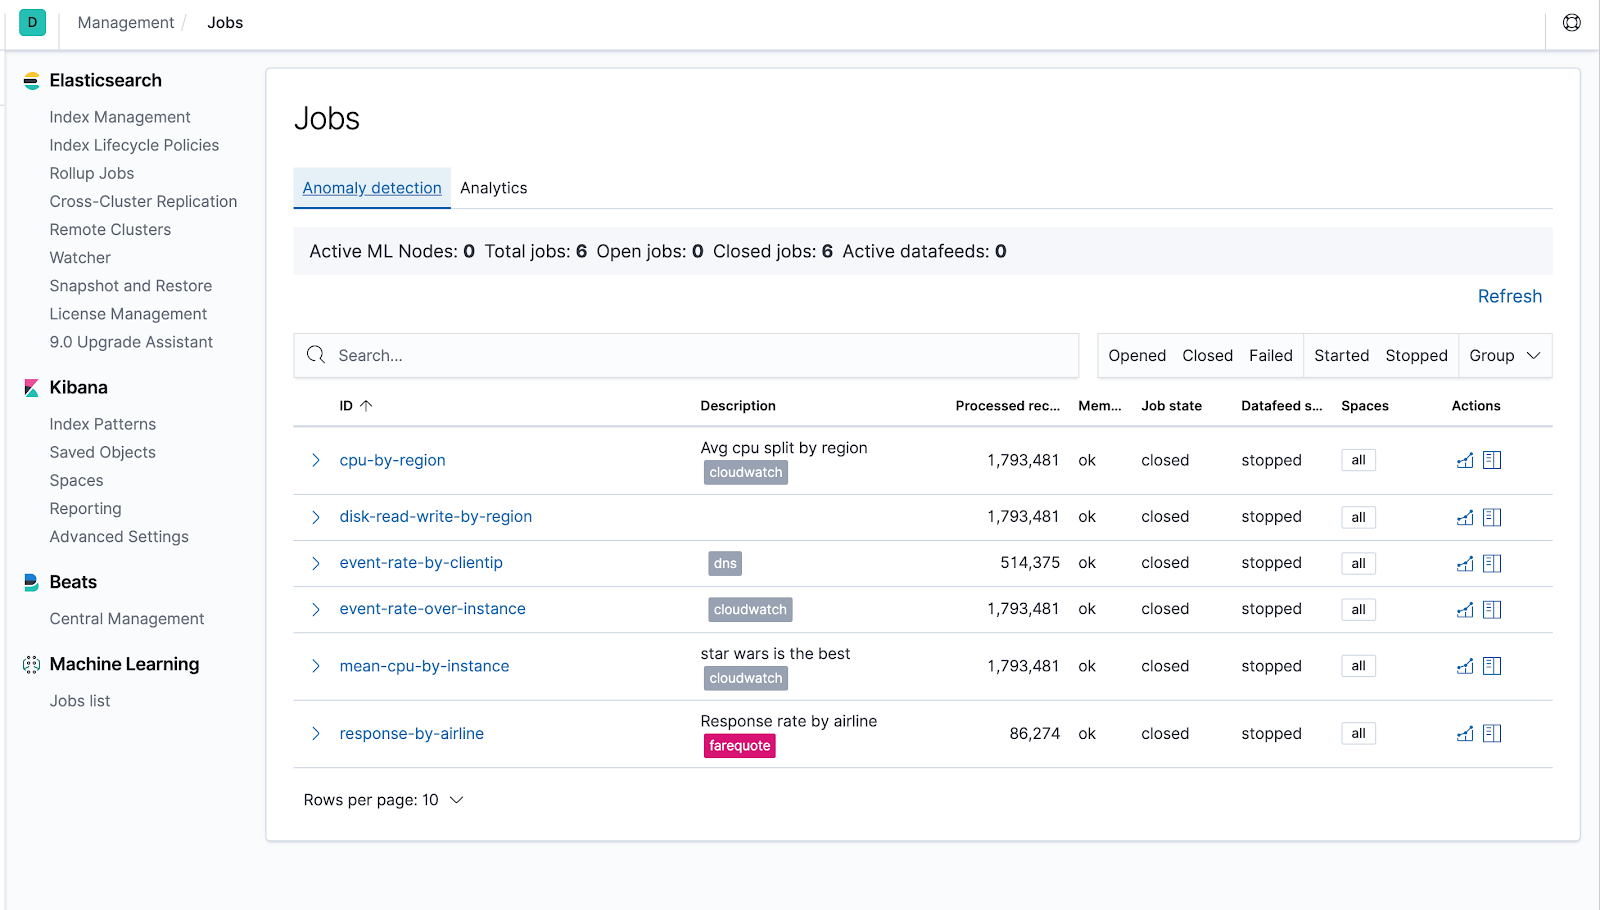
A new machine learning jobs list section has been added to the Management application. Administrators will be able to view job configurations and statistics across all spaces.
SIEM, Maps, Observability, and more!
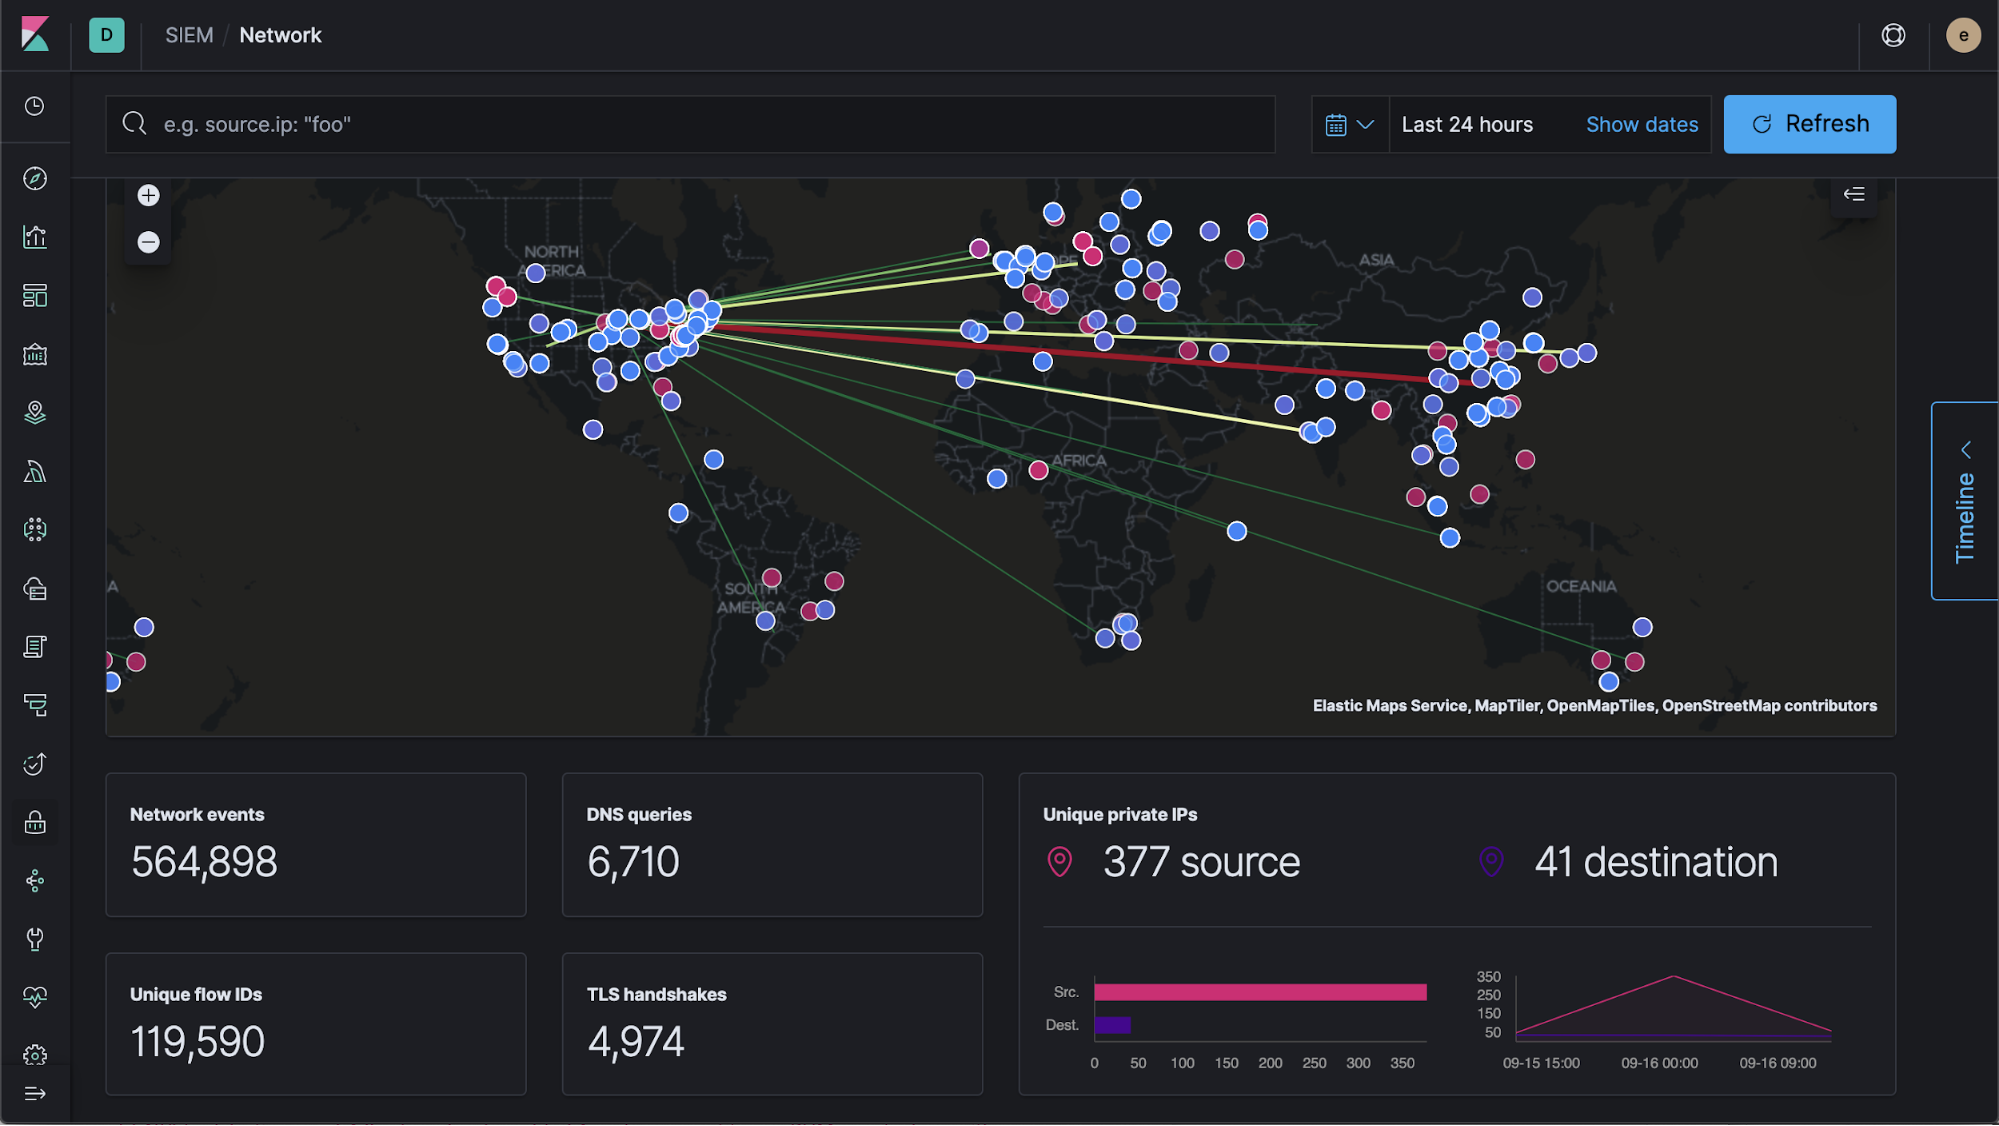
A geospatial view for network connections
A geospatial perspective is useful for many data sets, and security events are one of those data sets. In 7.4, SIEM now embeds maps directly in the network interface to show common request paths between origin and destination sources. This is just one of the many awesome features in SIEM in this release — be sure to read up on all the new functionality in our 7.4 SIEM blog post.
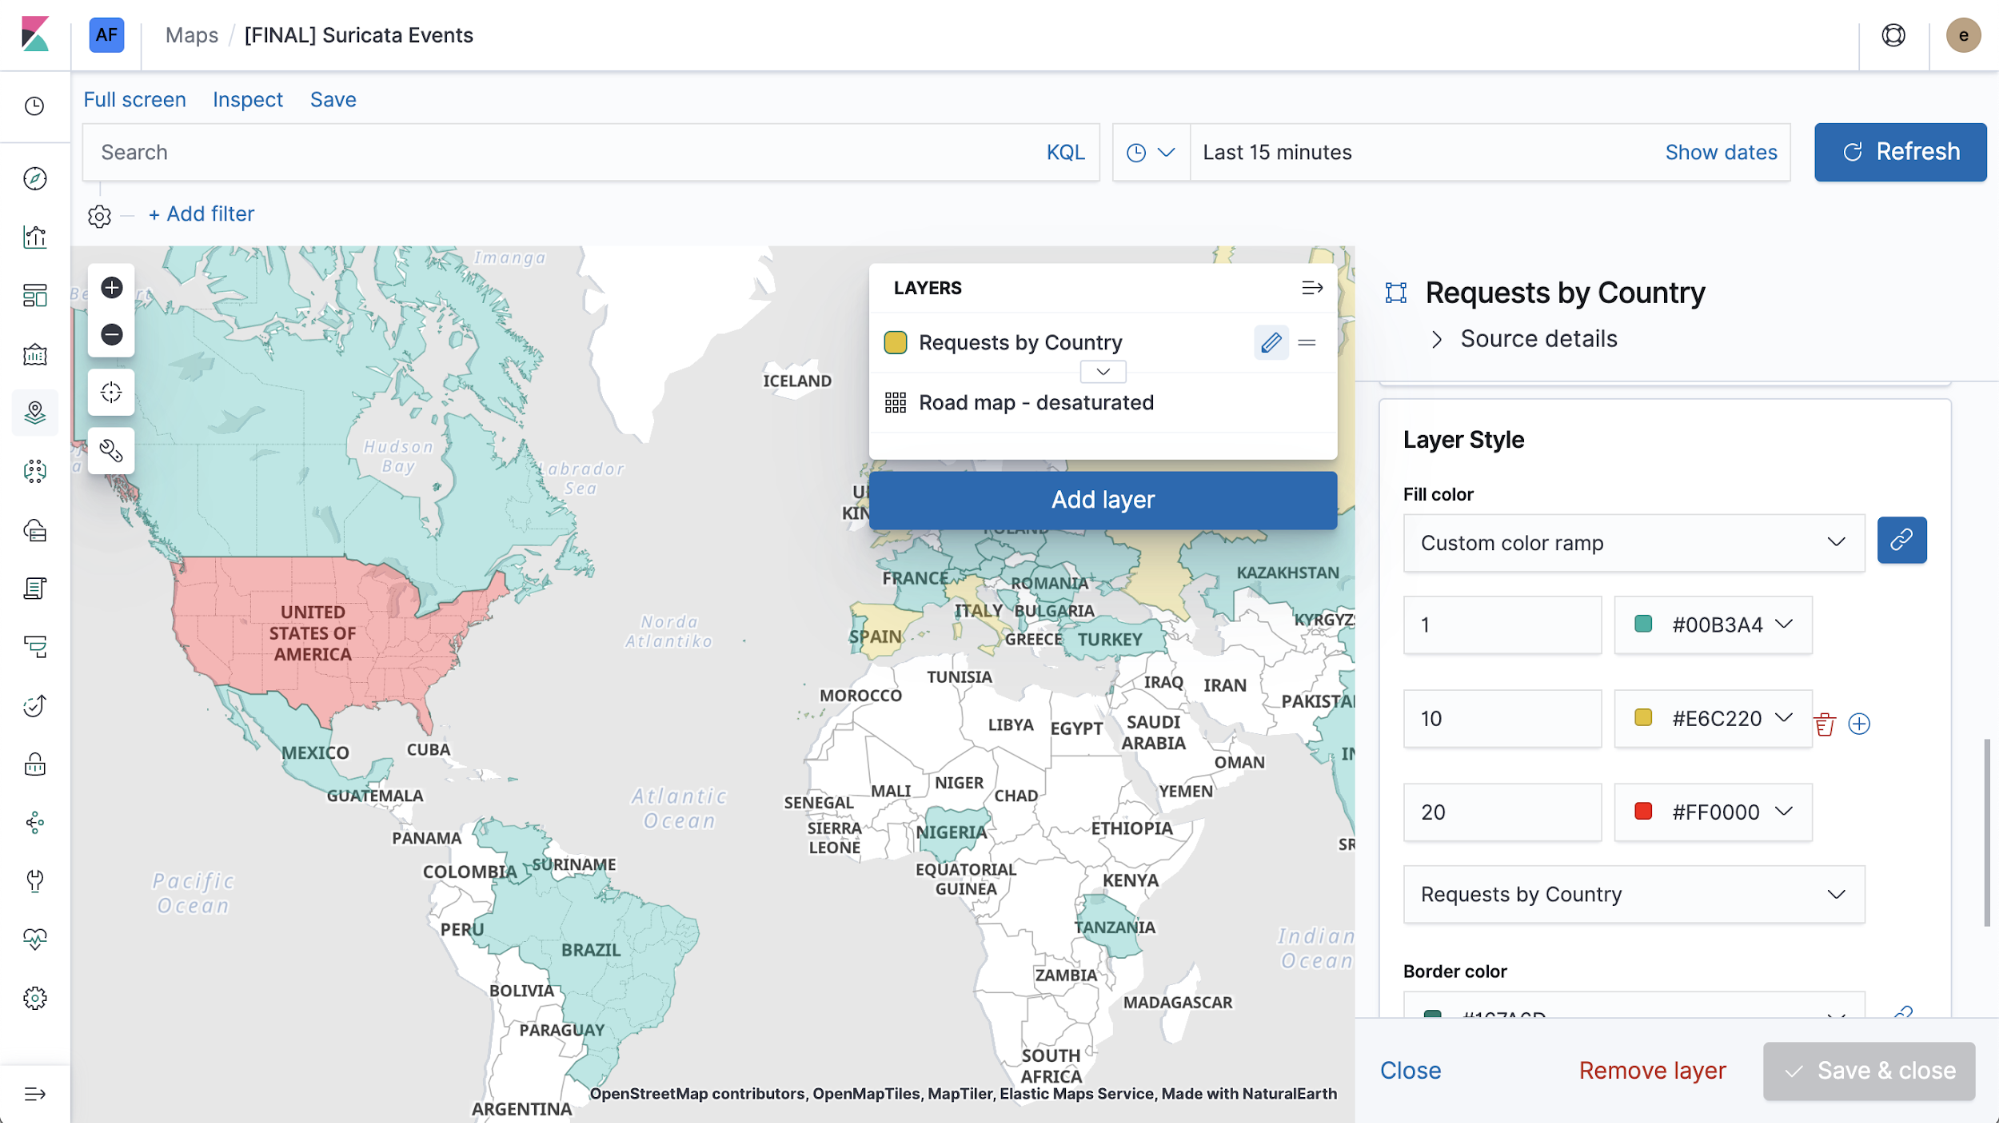
Customize your color ramps in Elastic Maps
Speaking of geo, Elastic Maps has a number of impressive features in 7.4. A long-standing community request is the ability to customize color ramps for aggregations, points, and shapes on a map. 7.4 introduces this functionality, the ability to filter on a predefined shape values, vector tile base layer maps, and a brand new data source. To learn more, check out the Maps blog post for 7.4.
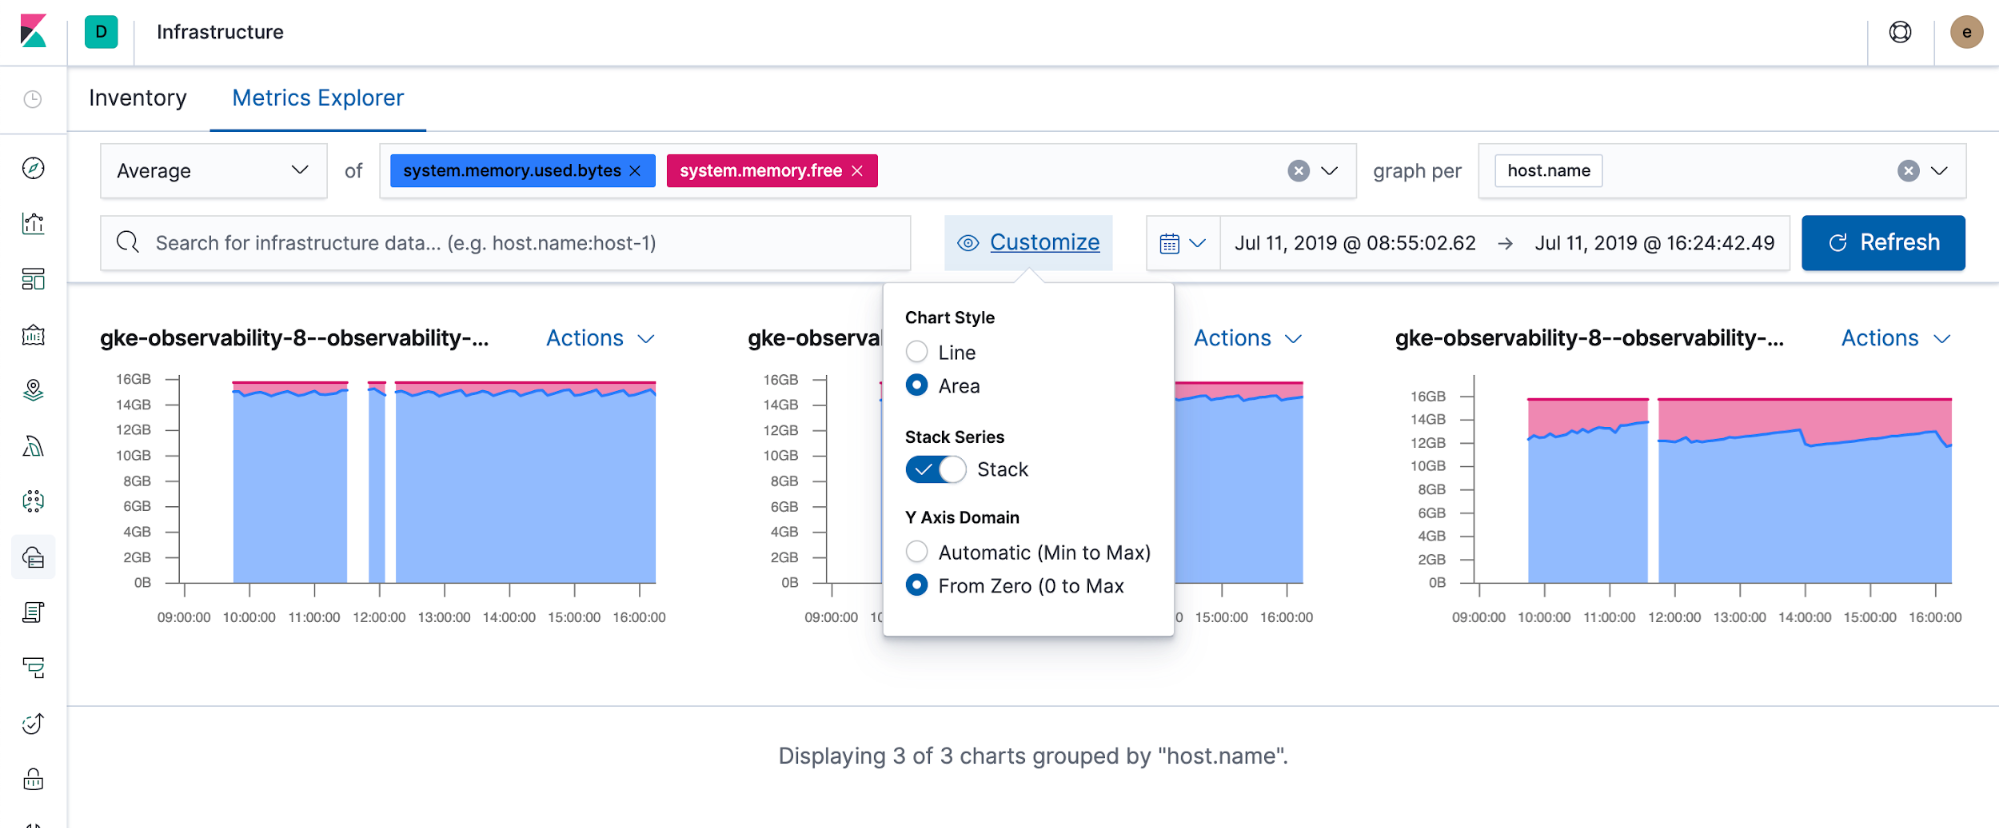
Slice and dice your infrastructure data, your way
The Metrics Explorer for infrastructure monitoring just got a couple of new configuration options. Tweak exactly how you’d like the charts to be shown, whether it’s the series stacking, chart type, or the X-axis defaults. Learn about this feature and many more in the Observability blog post for 7.4!
7.4 is jam-packed with new features and functionality outside of what you read in this blog post. Be sure to read the 7.4 release highlights for the Elastic Stack to get up to speed on all the ways we’re pushing the stack forward. Or better yet, give it a try on Elastic Cloud with a free 14 day trial. Let us know what you think on Twitter (@elastic) or in our discuss forums!