webLyzard's Visual Exploration of Sustainability Communication with Elasticsearch
On behalf of the United Nations Environment Programme (UNEP), webLyzard technology has developed a cross-lingual semantic search platform powered by Elasticsearch that tracks global communication flows to reveal social perceptions of environmental issues and visualize the public debate about UN's Sustainable Development Goals (SDGs).
The project targets sustainability stakeholders whose decision making is influenced by such communication flows, including policy makers, corporations and non-government organizations (NGOs). By automatically extracting knowledge from a range of online sources such as news, social media and the stakeholders’ own websites, it helps users to better understand the dynamics of contested issues, track the evolution of a debate over time, and identify key indicators that are shaping public opinion.
Architecture of the Visual Analytics Dashboard
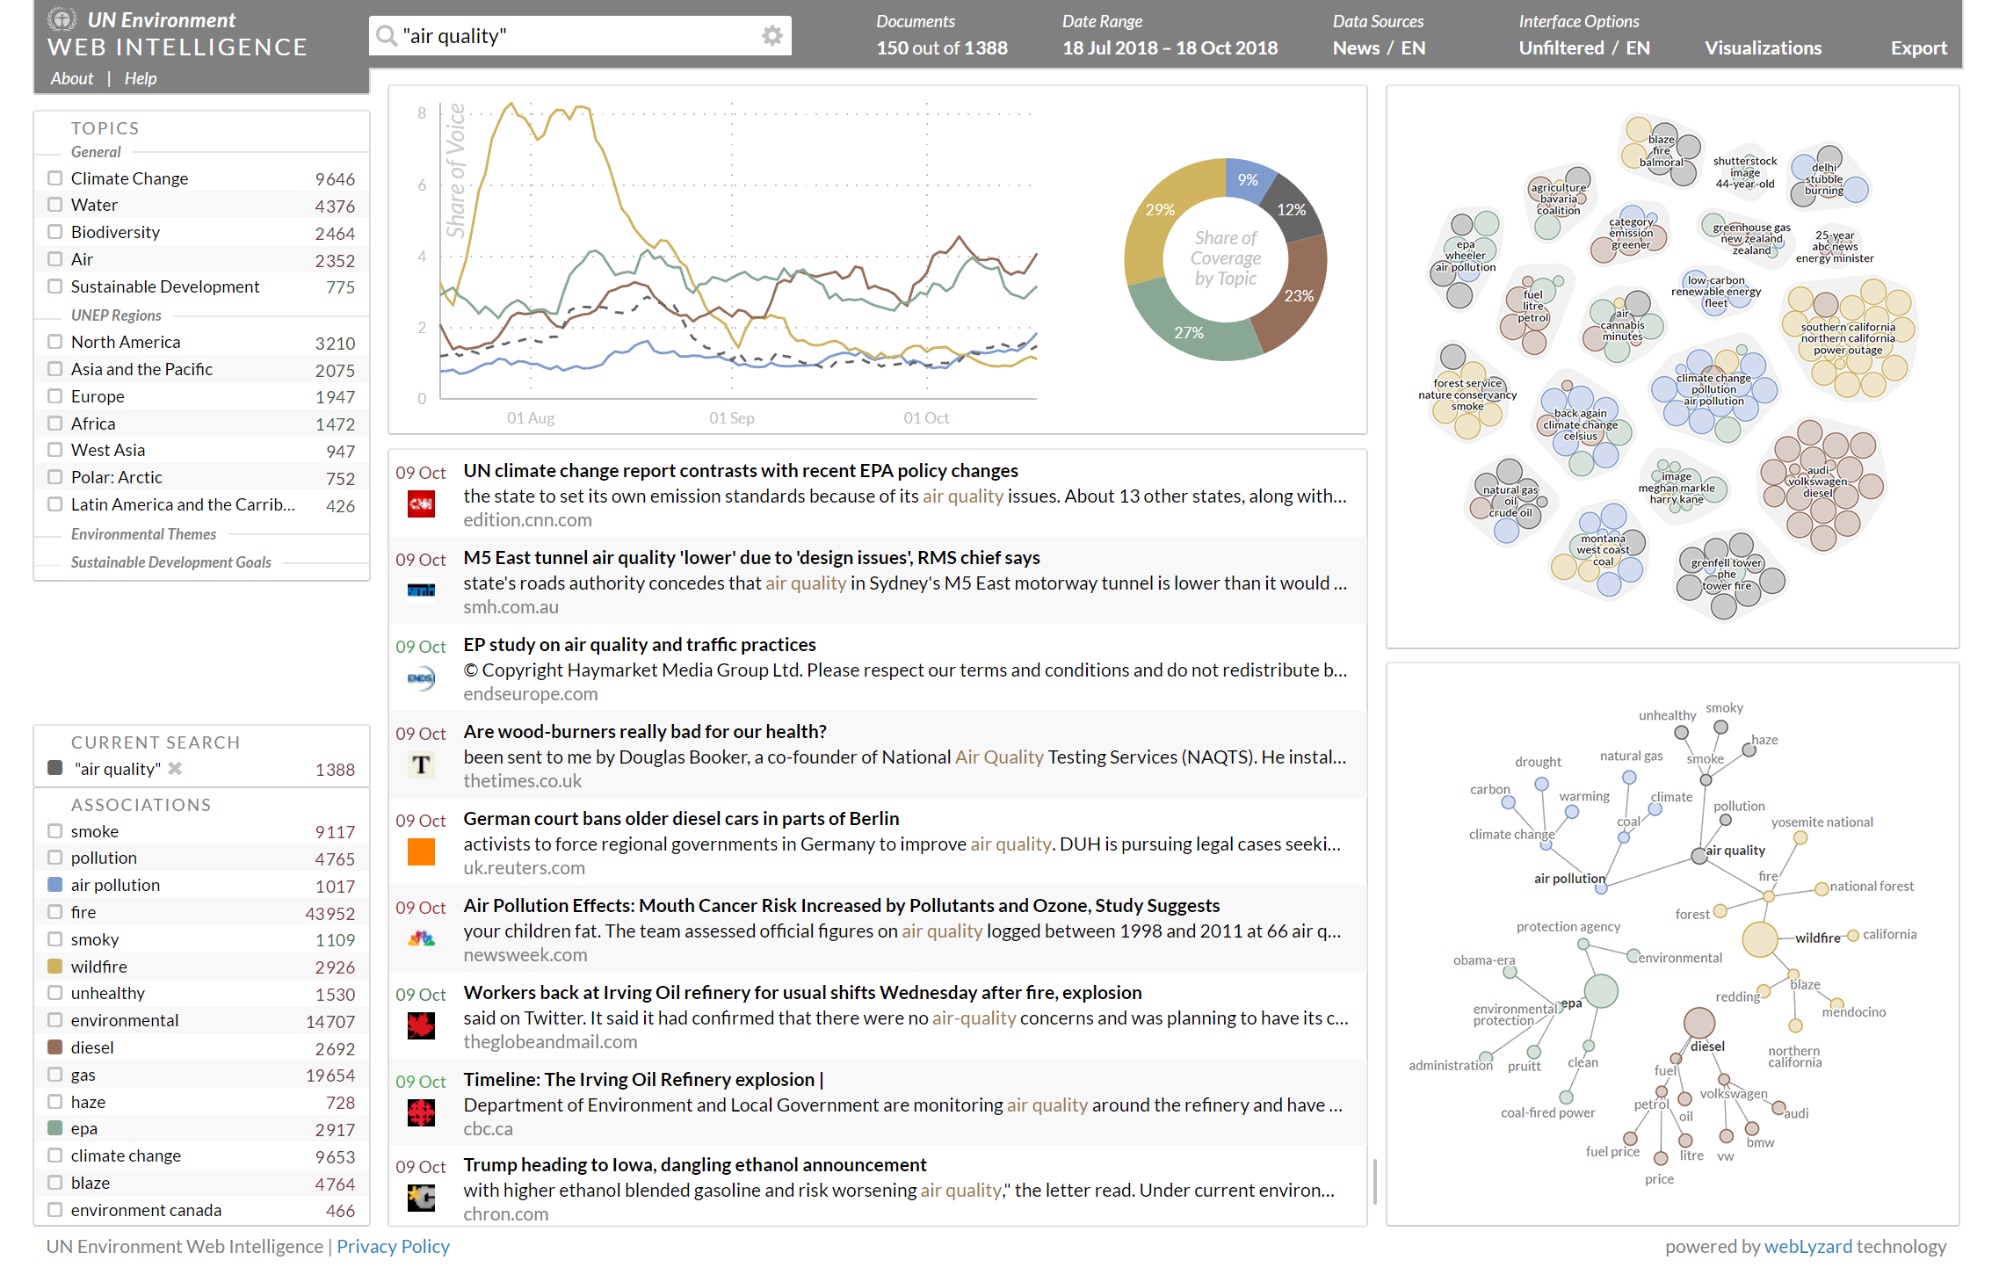
The Elasticsearch-powered visual analytics dashboard is a semantic search and visual content exploration system used to identify opinion leaders and analyze the public debate by topic and geographic location. The custom-built dashboard synchronizes multiple views in real time and uses aggregations to convey context information through a portfolio of visual tools (a recent IEEE Systems article provides additional information on the underlying knowledge extraction and visualization methods).
The visual tools outlined in the following paragraphs were developed based on the D3.js library. They offer various interactive features including floating menus and adaptive tooltips for metadata previews and on-the-fly query refinements.
The Trend Chart, available for multiple time series including Share of Voice, Frequency, Sentiment and Disagreement, uses Date Histogram Aggregations and nested aggregations to retrieve the data points’ top keywords.
For the Keyword Graph, Relation Tracker, Tag Cloud and Cluster Map, associated keywords for a given search query are calculated using Terms Aggregation. Initially, the system returns the top keywords, pre-annotated and indexed as nested documents to the actual content item, and then aggregates full-text counts and average sentiment for each keyword.
The Word Tree shows the lexical context in which terms such as "air quality" or "climate change" are being discussed around the world, while the Relation Tracker reveals associations between those terms and extracted named entities. To selectively retrieve sentences for lexical displays such as the Word Tree, the default query is extended by an inner hits clause, filtering the returned sentences to only those matching the query while maintaining document-level relevance sorting.
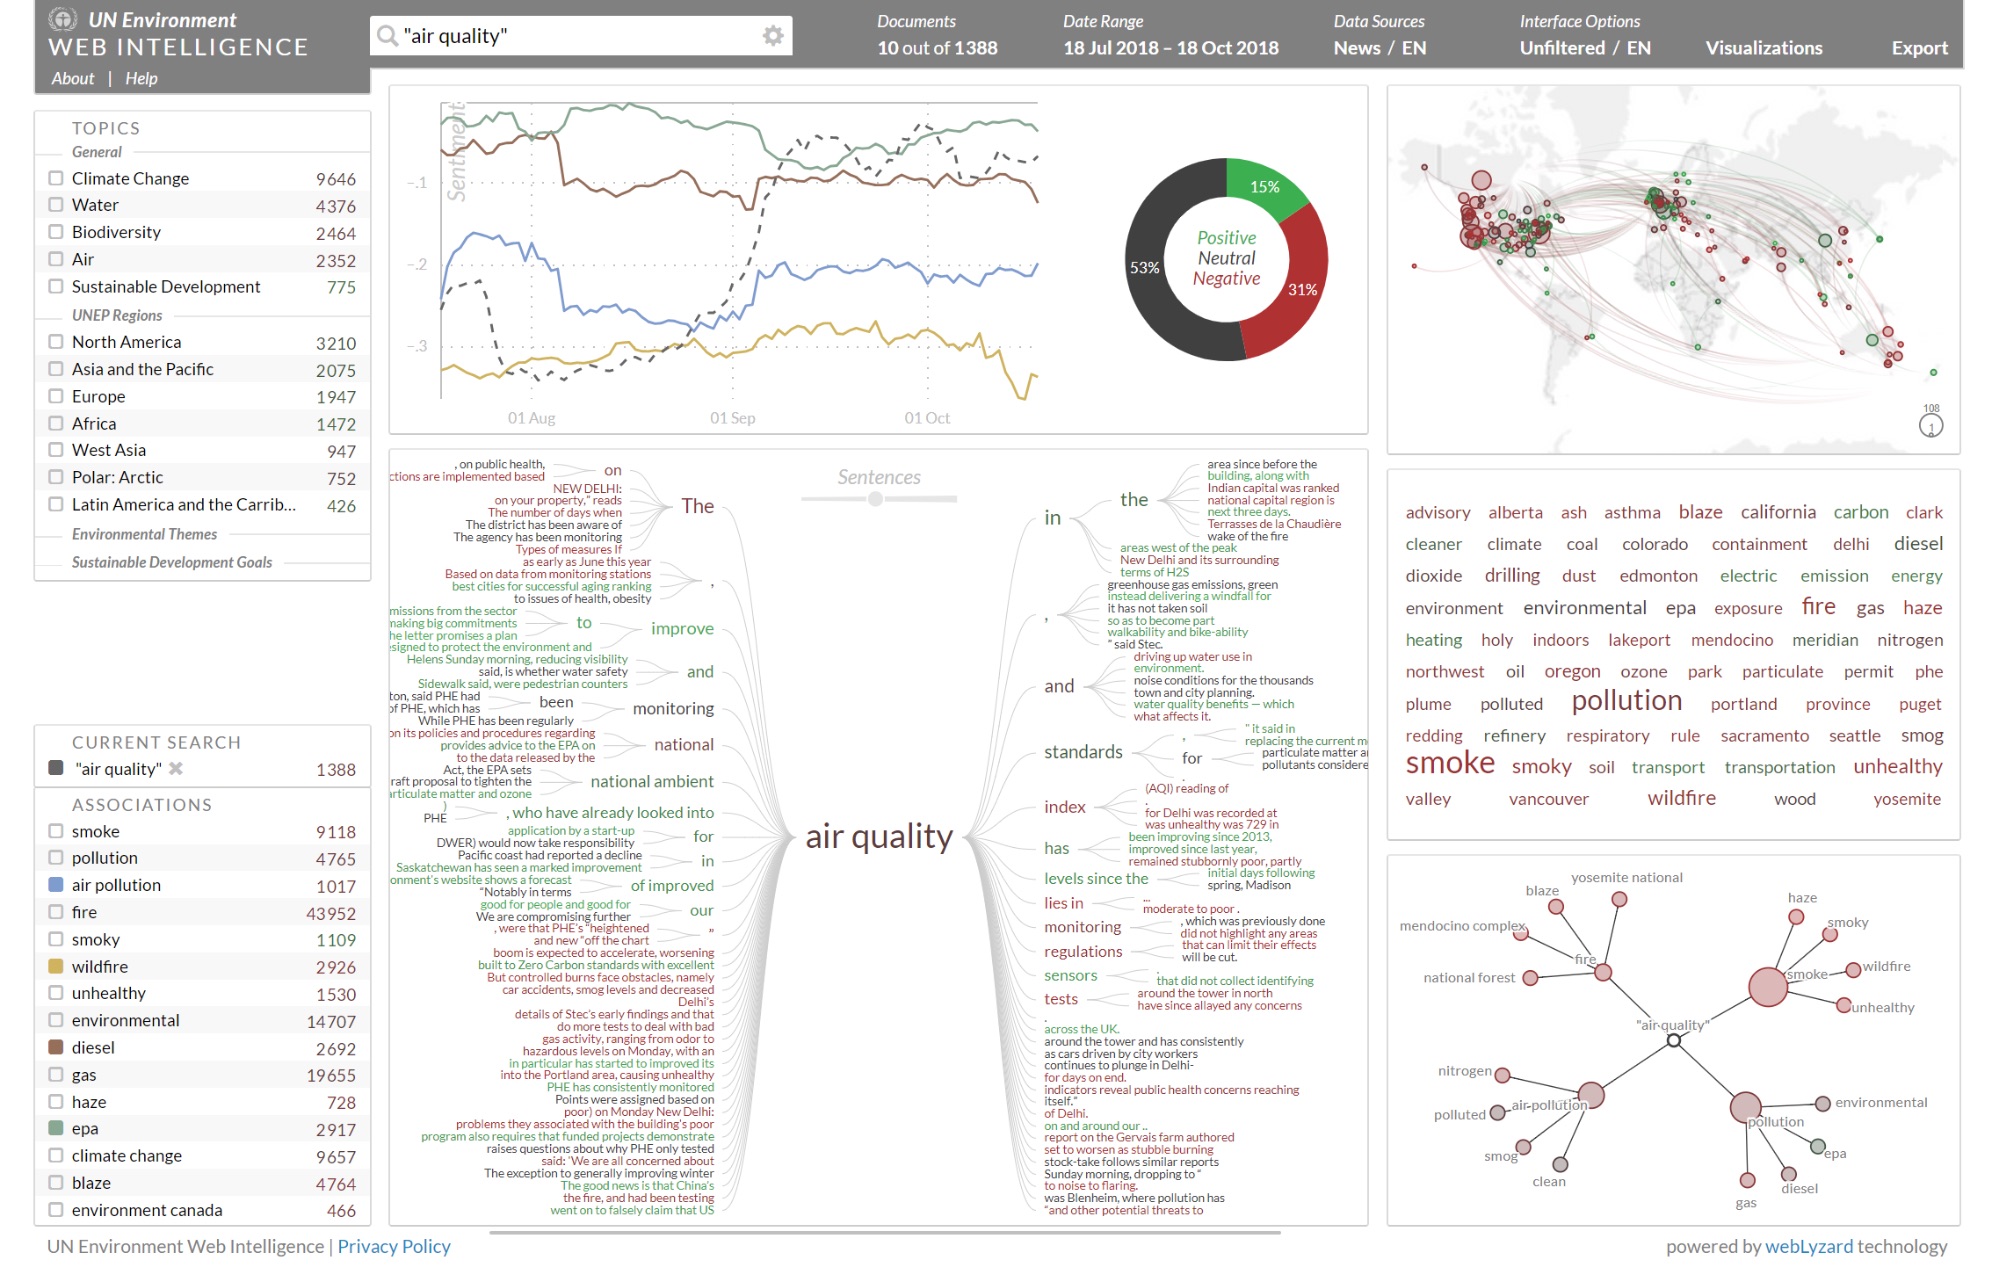
The Geographic Map uses GeoHash Grid Aggregations to connect the source and target locations of search results via arcs, with drill-down functions based on geo distance sorting. They display origin and location targets of a communication, highlighting emerging stories and environmental trends.
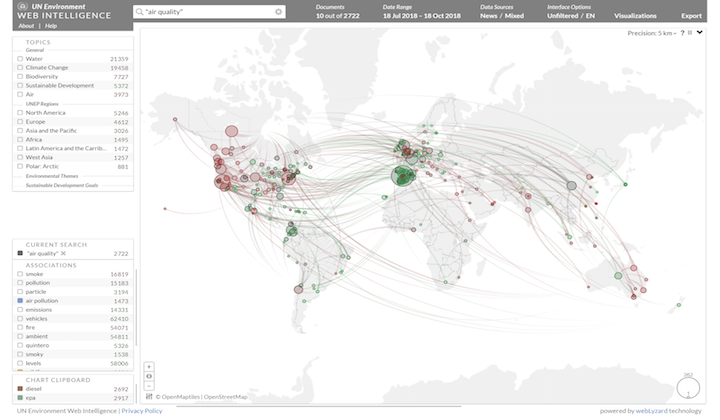
The cross-lingual nature of the platform allows policy makers a consistent macro-level view of SDGs across regions, while NGOs and citizens can track unfolding public debates in other countries that are relevant to their cause. Translated terms stored in Elasticsearch enable cross-lingual queries and the provision of analytic results in all official UN languages. Elasticsearch aggregations yield additional information for user queries or API calls: (i) the highest ranked search results based on simple or advanced queries, (ii) data slices across time, geographic location or other dimensions - e.g., indicators most relevant for a particular city, and (iii) provisioning of on-the-fly data views for the various visualizations.
Data Ingestion and Aggregation
With the availability of Elasticsearch 1.0 in early 2014, we migrated from a single Lucene index to an Elasticsearch cluster to keep up with our rapidly growing dataset, make use of advanced aggregation features, and facilitate ongoing maintenance.
Data is fed into the Elasticsearch cluster via a custom-developed Vert.x-based indexer component, which adapts the size of the time slices depending on dynamic source characteristics. Separate Elasticsearch indices are created based on publication date and source - for example, splitting English, Spanish, French and German content into different indices. The indexing component supports the creation of arbitrary time slice sizes, so that fast-growing indices from popular social media platforms such as Twitter can be split into smaller parts (e.g., weekly), whereas slower-growing indices for traditional news media outlets can be split into larger monthly slices.
Elasticsearch powers both the visual analytics dashboard and the underlying REST APIs, paying special attention to individual nodes’ memory footprint and the computational load of resource-heavy aggregations. We use the Elastic Stack not only to manage the resulting repository of environmental knowledge and optimize our processing workflows, but also to capture and query related resources such as time series data and a comprehensive knowledge graph that is used for lexical processing and the disambiguation of named entities (people, organizations, events and locations).
Migration to Elasticsearch 6.x
Over the years, Elasticsearch (ES) has been a key enabling technology to drive the evolution of the webLyzard platform and applications such as UN Environment Web Intelligence.
The continuously growing size of our ES 1.7 index caused heavy heap usage and long garbage collection pauses. We therefore decided to improve index mapping and migrate to Elasticsearch 6. While our previous ES 1.7 cluster comprised just two physical machines, each with multiple nodes to maximise heap usage and use compressed object pointers, the new ES 6.4.2 cluster is split into five physical machines. Each of them runs one dedicated master node, one coordinating node to allow load-balancing and failover from clients, and four data-only nodes.
To quantify the achieved performance gains, a frequent aggregation query of the UN Environment dashboard was run using JMeter on both clusters. Based on the default date range of two months, we (i) filter documents matching a given search query, dynamically built from a list of top 1,000 terms in the document set, (ii) aggregate the top 50 keyword annotations, and (iii) use reverse nested aggregations to calculate average document sentiment.
Single request performance of this rather complex query improved by almost 50% - from a median response time of 455 ms (90% of requests below 1,058 ms) to 234 ms (90% of requests below 363 ms). For 100 concurrent users, the improvement turned out to be even more significant. Median response time improved by 85% - from 13,000 ms (90% of requests below 39 seconds) to 2,000 ms (90% of requests below 16 seconds).
Outlook
The successful migration and remarkable performance of the new ES 6.4.2 cluster will serve as a key enabler for our current and future research projects. We will extend the platform in close collaboration with sustainability stakeholders and the partner organizations of large-scale research projects funded by the European Union’s Horizon 2020 Program, the Google News Initiative and the Austrian Research Promotion Agency. The work will combine predictive features based on time series data with events extracted from the public debate. Such prediction algorithms in conjunction with advanced visual methods will help to anticipate mobility bottlenecks and promote sustainable transport options, for example, to support digital newsrooms, and to maximize the impact of published news media content.
For more information, watch the video tutorial of UNEP Live Web Intelligence (introducing the first version of the platform released in May 2016):
Acknowledgement
The Web intelligence platform presented in this article has received funding from the United Nations Environment Programme (UNEP). The authors would like to thank the researchers and software engineers of webLyzard technology, the Department of New Media Technology at MODUL University Vienna and the Swiss Institute for Information Science at HTW Chur for their continued efforts to improve and extend the platform, as well as for their feedback on earlier versions of this article.
Arno Scharl is the Managing Director of webLyzard technology and a Professor of New Media Technology at MODUL University Vienna. Previously, he held positions at the University of Western Australia and the University of California at Berkeley. Arno has authored more than 180 scientific publications and guided the development of the webLyzard platform, which has attracted more than 9.5 Mio EUR in competitive research funding from European, Austrian and Swiss programs. His research focuses on Web intelligence and visual analytics, geospatial Web technology, semantic search, and knowledge extraction from unstructured big data repositories.
Alexander Hubmann-Haidvogel is a Senior Researcher at webLyzard technology and a Lecturer at the Department of New Media Technology of MODUL University Vienna. He is actively involved in several Austrian and European research projects and leads the Web front-end development team responsible for the UN Environment Web Intelligence dashboard and other award-winning Web applications. His research interests include social network analysis, information visualization, and human-computer interaction.
Daniel Fischl is a Researcher at MODUL Technology, the non-profit research organization of MODUL University Vienna. With a background in media informatics and the economic sciences, he is currently in the process of completing a MSc degree in visual computing. His thesis combines advanced temporal controls with graph-based visual tools such as Word Trees and webLyzard’s upcoming Stream Graph representation. His research interests include information visualization, visual analytics, and human-computer interaction.