WARNING: Version 5.1 of the Elastic Stack has passed its EOL date.
This documentation is no longer being maintained and may be removed. If you are running this version, we strongly advise you to upgrade. For the latest information, see the current release documentation.
Setting up a Separate Monitoring Cluster
editSetting up a Separate Monitoring Cluster
editTo store monitoring data in a separate cluster:
-
Set up the Elasticsearch cluster you want to use for monitoring, install X-Pack, and start Elasticsearch. For example, you might set up a two host cluster with the nodes
es-mon-1andes-mon-2.To monitor an Elasticsearch 5.0 cluster, you must run Elasticsearch 5.0 on the monitoring cluster. While installing X-Pack on the monitoring cluster is not absolutely required, it is strongly recommended.
- Install X-Pack on the nodes in your production cluster.
-
If X-Pack security is enabled on the monitoring cluster, create a user on the monitoring cluster that has the
remote_monitoring_agentrole. You can create users from Management / Users in Kibana. The Kibana instance must be connected to the monitoring cluster. You can also create users through theuserAPI. For example, the following request creates aremote_monitoruser that has theremote_monitoring_agentrole:POST /_xpack/security/user/remote_monitor { "password" : "changeme", "roles" : [ "remote_monitoring_agent"], "full_name" : "Internal Agent For Remote Monitoring" } -
Configure the nodes in your production cluster to send metrics to your monitoring cluster by configuring an HTTP exporter in the
xpack.monitoring.exporterssettings inelasticsearch.yml:xpack.monitoring.exporters: id1: type: http host: ["http://es-mon-1:9200", "http://es-mon2:9200"] auth.username: remote_monitor auth.password: changemeIf SSL/TLS is enabled on the monitoring cluster, you must connect through HTTPS and specify the trusted certificates that will be used to verify the identity of the nodes in the monitoring cluster. For more information, see Monitoring and Security.
If X-Pack security is disabled on the monitoring cluster, you can omit
auth.usernameandauth.password. -
Restart Elasticsearch on the nodes in your production cluster
You may want to temporarily disable shard allocation before you restart your nodes to avoid unnecessary shard reallocation during the install process.
- Install X-Pack into Kibana.
-
Configure Kibana to connect to your monitoring cluster by setting the
xpack.monitoring.elasticsearchproperties in thekibana.ymlconfiguration file.-
Set the
urlproperty to point to your monitoring cluster. For example:xpack.monitoring.elasticsearch.url: "http://es-mon-1:9200"
-
Configure credentials for Kibana to use to connect to the monitoring cluster if X-Pack security is enabled on the monitoring cluster. Create a user, for example one named
kibana-monitor, with the roleskibana_userandmonitoring_userin the monitoring cluster.xpack.monitoring.elasticsearch.usernameandxpack.monitoring.elasticsearch.passwordsettings accordingly.xpack.monitoring.elasticsearch.username: "kibana-monitor" xpack.monitoring.elasticsearch.password: "changeme"
-
If SSL is enabled on the monitoring cluster, you must configure the SSL properties. These properties have the same options as Kibana’s primary connection to Elasticsearch. For example:
xpack.monitoring.elasticsearch.ssl.ca: "/path/to/ca/file"
For more information, see the
elasticsearch.sslproperties in Setting Kibana Server Properties.
-
-
Start Kibana by running
bin/kibana. -
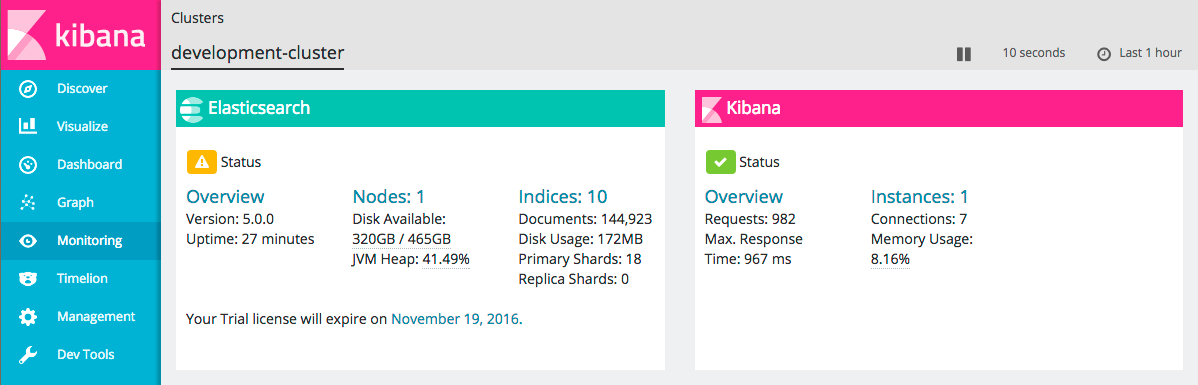
To verify your X-Pack monitoring installation, point your web browser at your Kibana host, and select Monitoring from the side navigation.

HTTP Exporter
editX-Pack monitoring agents default to indexing data into the cluster where
they’re running. In production, you should use an http exporter to send data
to a separate monitoring cluster. When you configure
an exporter in elasticsearch.yml, the default local exporter is disabled.
The http exporter uses the low-level Elasticsearch REST Client. This allows
the http exporter to send its data to any Elasticsearch cluster it can access
through the network.
The http exporter supports a number of settings that control how it
communicates over HTTP to remote clusters. In most cases, it is not
necessary to explicitly configure these settings. For detailed
descriptions, see Monitoring Settings.
xpack.monitoring.exporters:
  my_local:
    type: local
  my_remote:
    type: http
    host: [ "10.1.2.3", ... ]
    auth:
      username: my_username
      password: changeme
    connection:
      timeout: 6s
      read_timeout: 60s
    ssl: ...
    proxy:
      base_path: /some/base/path
    headers:
      My-Proxy-Header: abc123
      My-Other-Thing: [ def456, ... ]
    index.name.time_format: YYYY-MM
|
A |
|
|
An |
|
|
|
|
|
User authentication for those using X-Pack Security or some other form of user authentication protecting the cluster. |
|
|
See X-Pack monitoring TLS/SSL Settings for all TLS / SSL settings. If not supplied, the default node-level TLS / SSL settings will be used. |
|
|
Optional base path to prefix any outgoing request with in order to work with proxies. |
|
|
Arbitrary key/value pairs to define as headers to send with every request. The array-based key/value format sends one header per value. |
|
|
A mechanism for changing the date suffix used by default. |