Monitor
editMonitor
editThe Monitor page helps you gain insights into the performance
of a specific network endpoint. A detailed visualization of
the monitor’s request duration over time, as well as the up/down
status over time, is displayed. By configuring Machine Learning jobs
on this page, you can also also detect anomalies in response time data.
Status panel
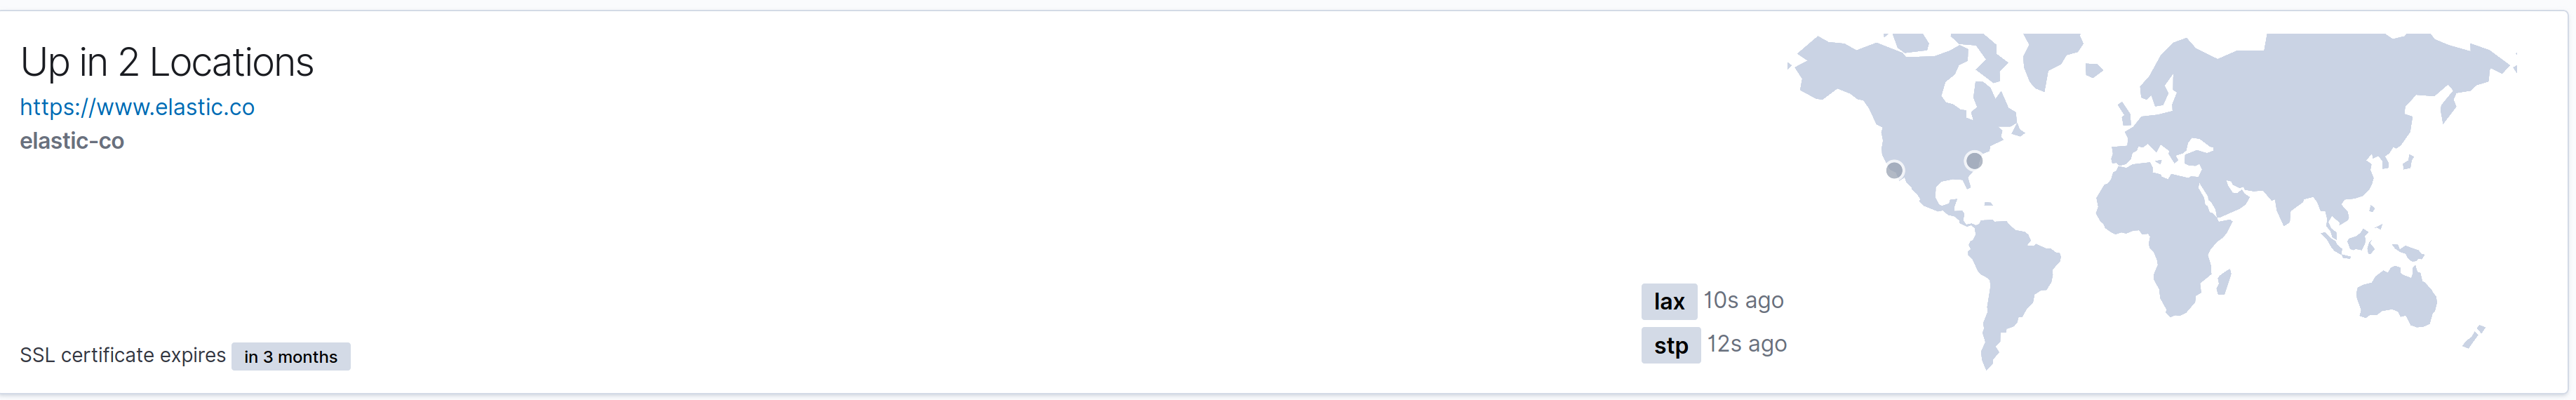
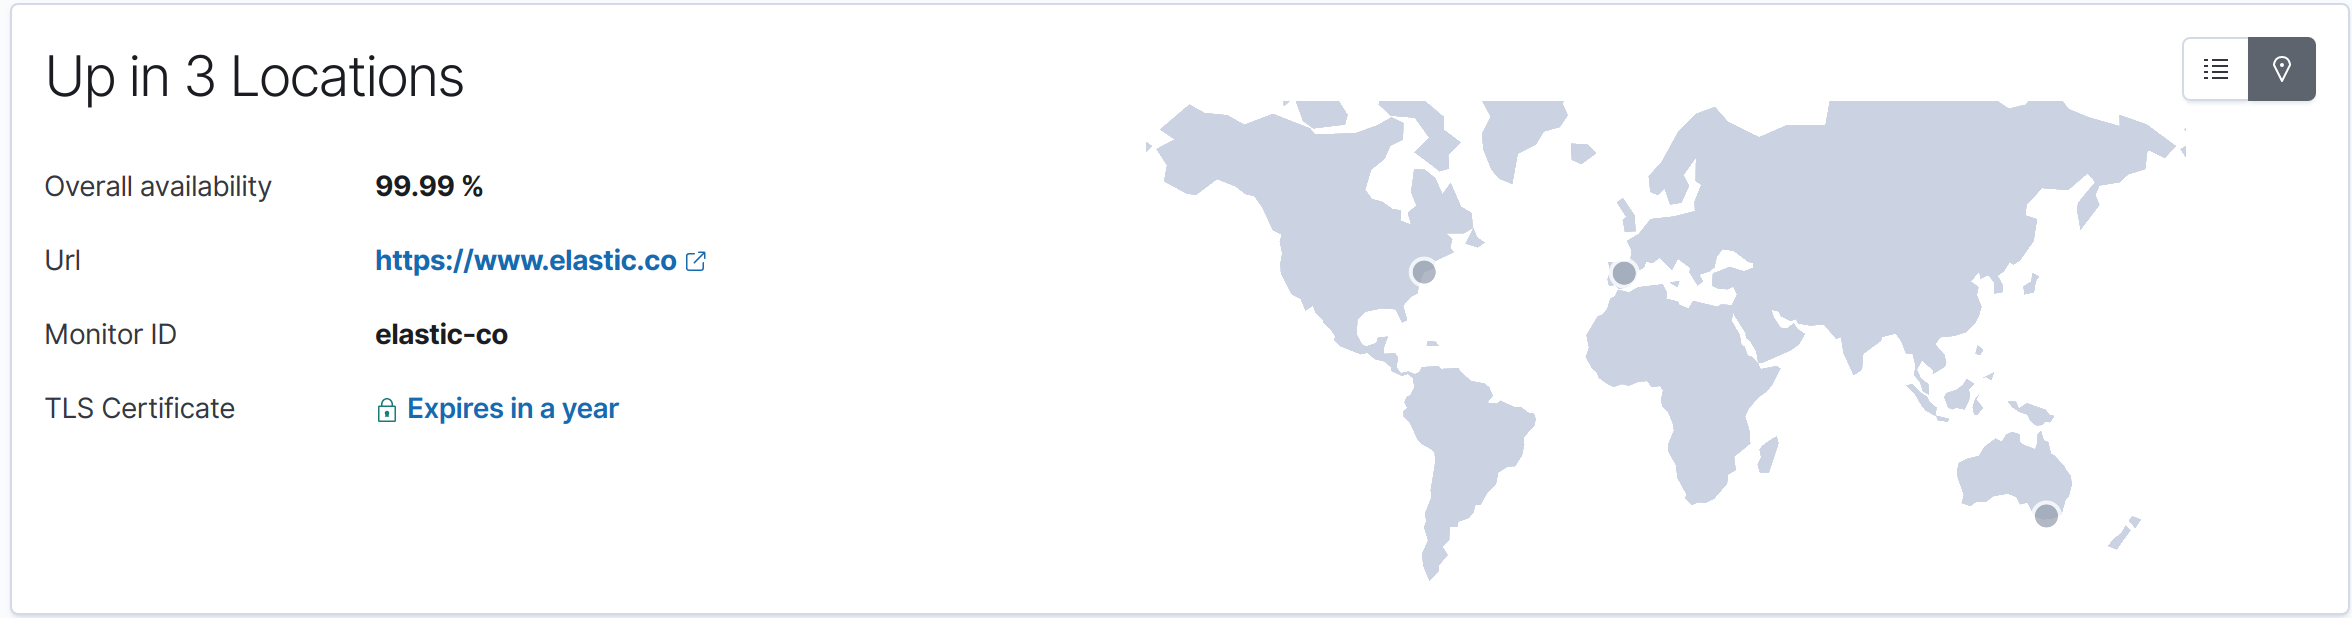
editThe Status panel displays a quick summary of the latest information regarding your monitor. You can view its latest status, click a link to visit the targeted URL, see its most recent request duration, and determine the amount of time that has elapsed since the last check.
On the right-hand side, service availability is shown per monitoring location. The availability percentage displayed is the percentage of successful checks made during the time period selected.
You can toggle the availability view to show a geographic map of each location as a pinpoint on the map, along with the amount of time elapsed since data was last received from that location.
Monitor charts
editThe Monitor charts visualize information over the time specified in the date range. These charts help you gain insights into how quickly requests are being resolved by the targeted endpoint, and give you a sense of how frequently a host or endpoint was down in your selected timespan.
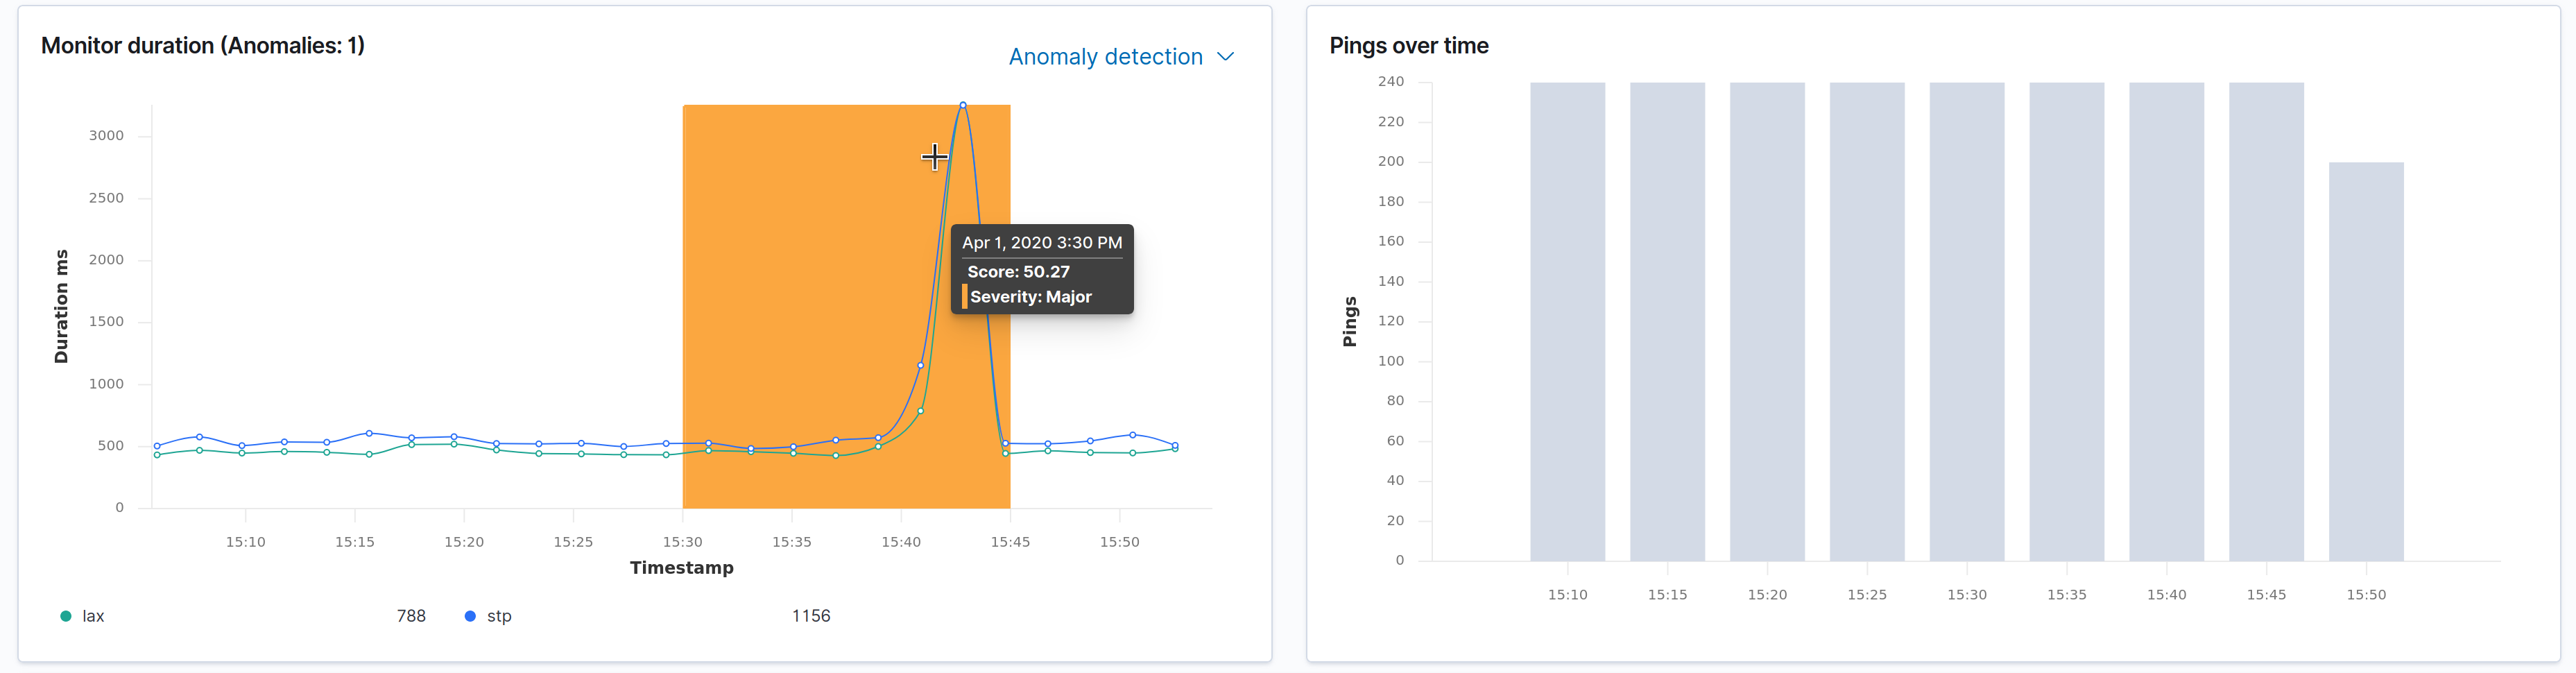
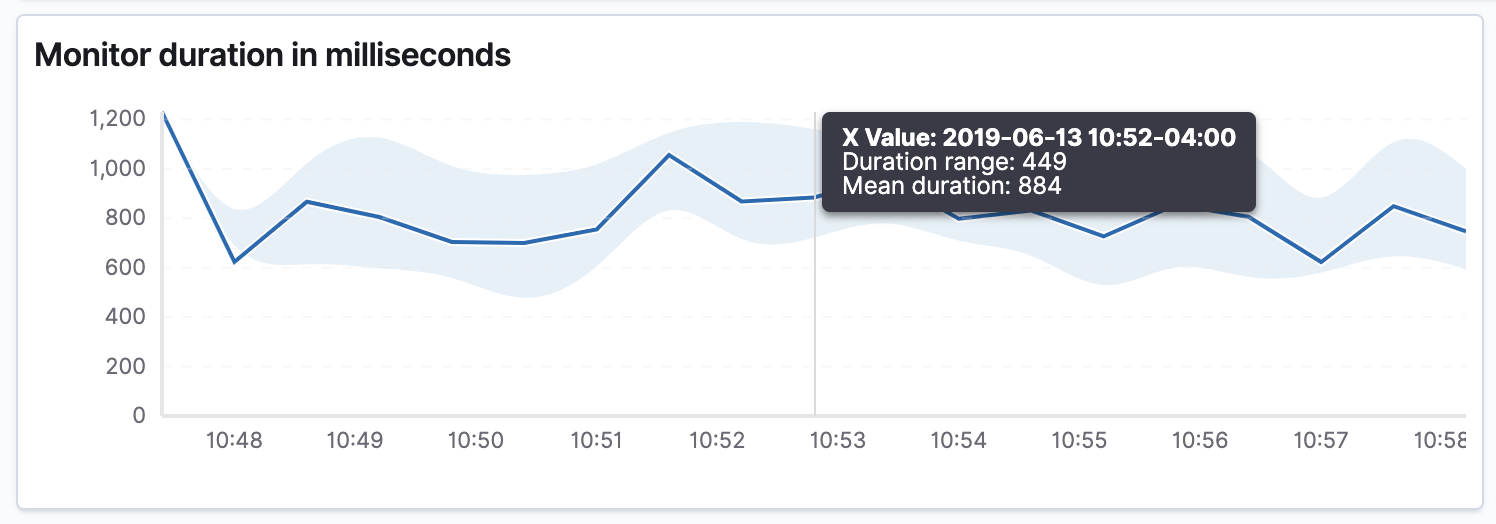
The Monitor duration chart displays request duration information for your monitor. The area surrounding the line is the range of request time for the corresponding bucket. The line is the average time. In the upper right hand of this panel you can enable and disable anomaly detection using Machine Learning. When response times change in an unexpected way the time range in which they occurred are highlighted with a color. After enabling anomaly detection you can use the same menu to enable alerts for anomaly detection.
The pings over time chart is a graphical representation of the check statuses over time. Hover over the charts to display crosshairs with specific numeric data.
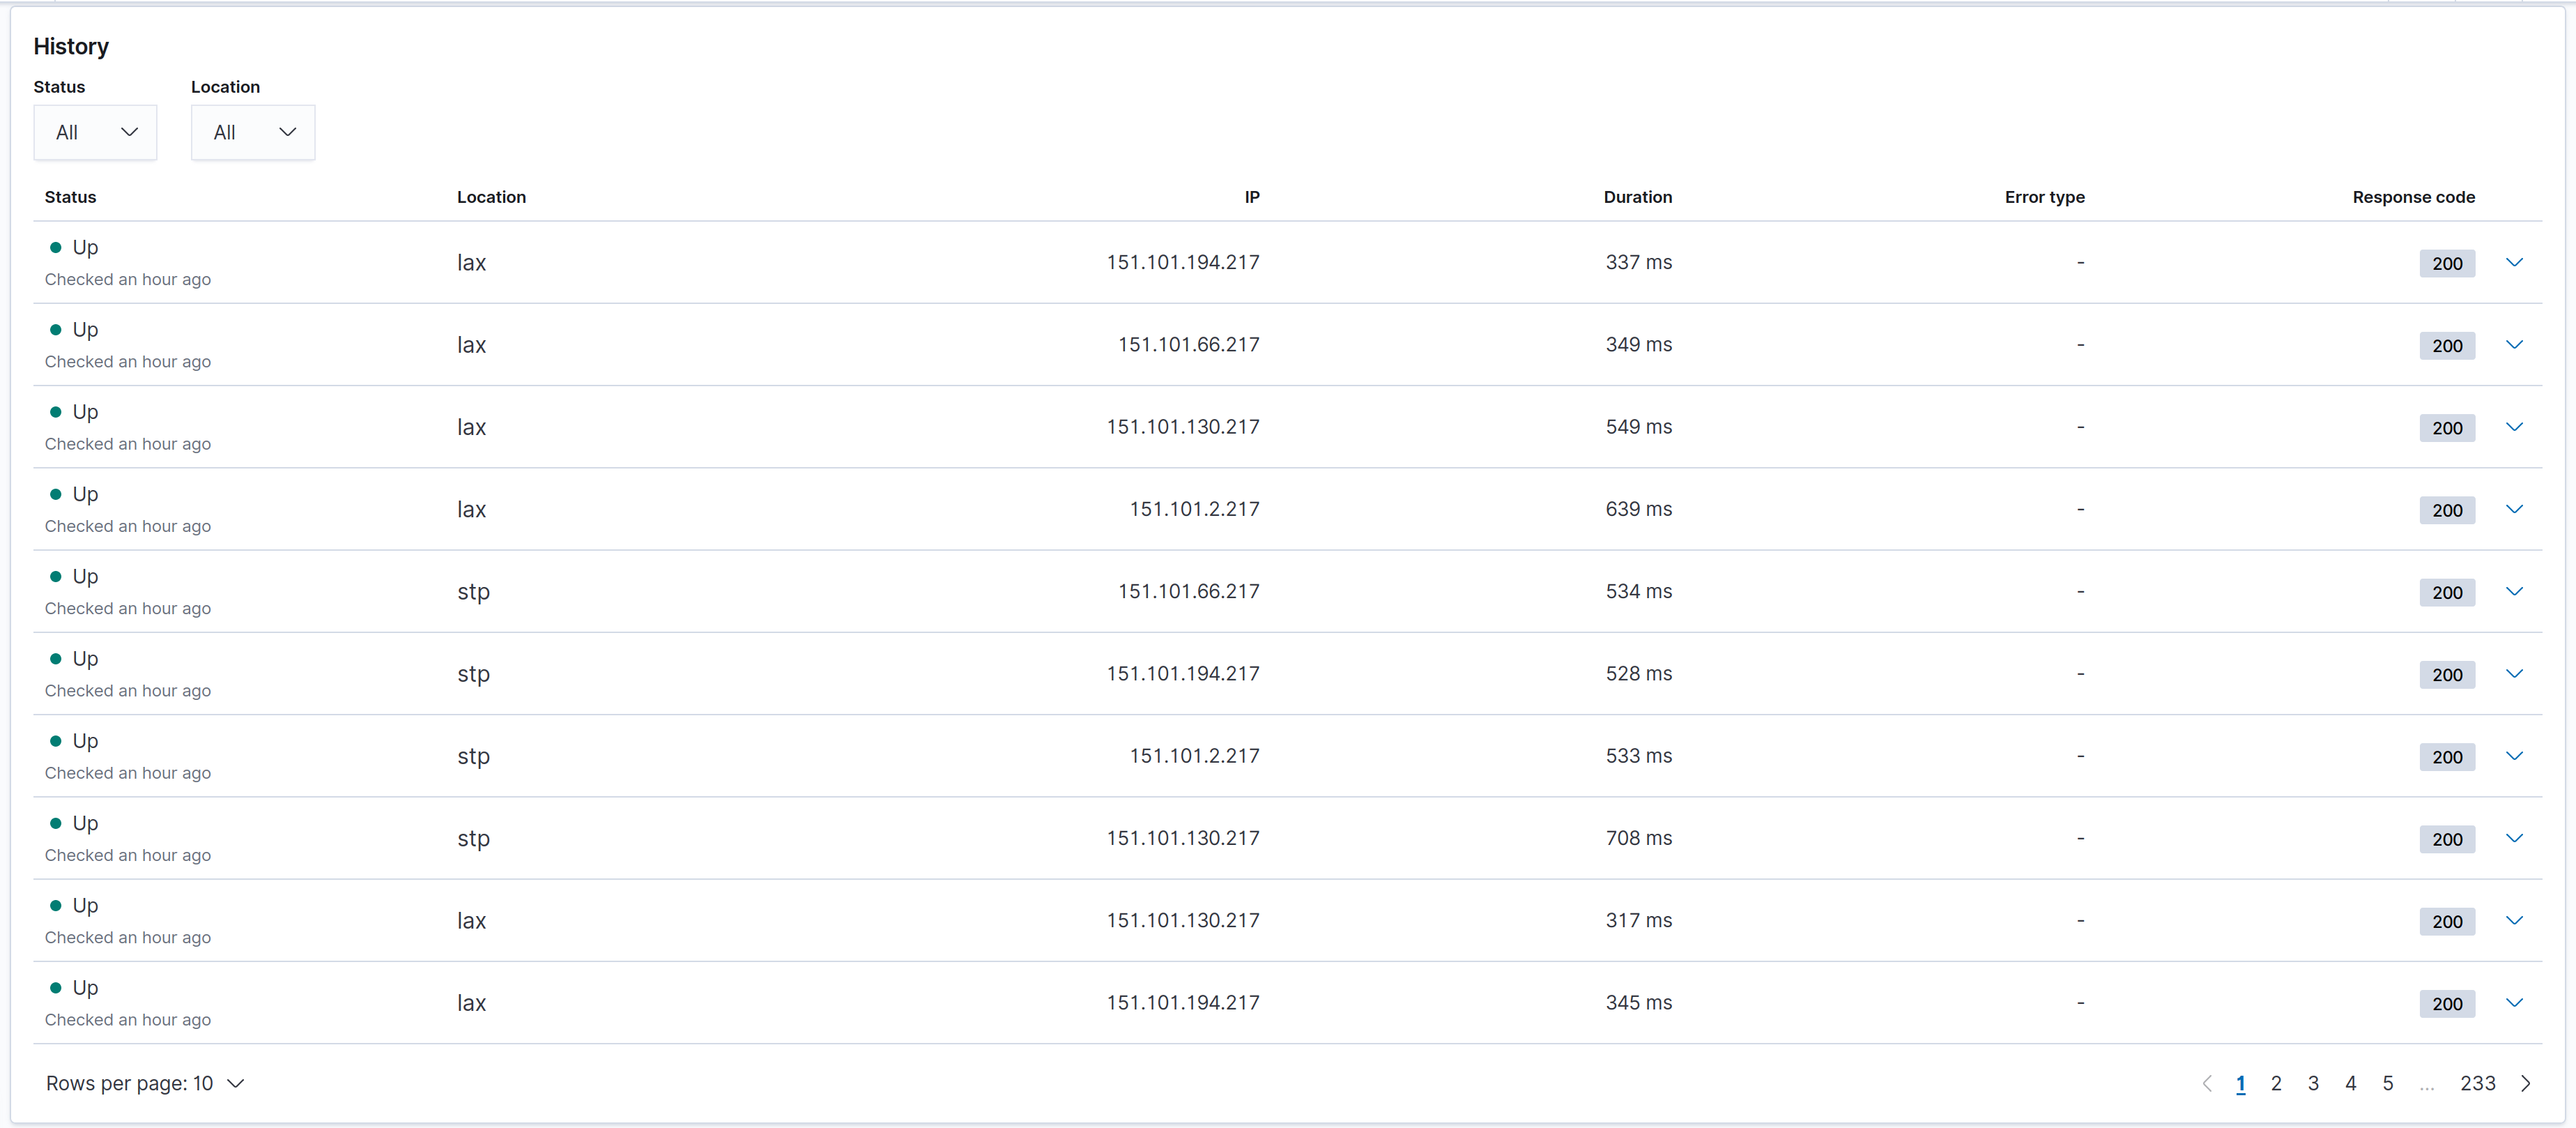
Check history
editThe Check history table lists the total count of this monitor’s checks for the selected date range. To help find recent problems on a per-check basis, you can filter the checks by status and location. This table can help you gain some insight into more granular details about recent individual data points that Heartbeat is logging about your host or endpoint.