Hosts page
editHosts page
editThe Hosts page provides a comprehensive overview of all hosts and host-related security events. Key performance indicator (KPI) charts, data tables, and interactive widgets let you view specific data, drill down for deeper insights, and interact with Timeline for further investigation.
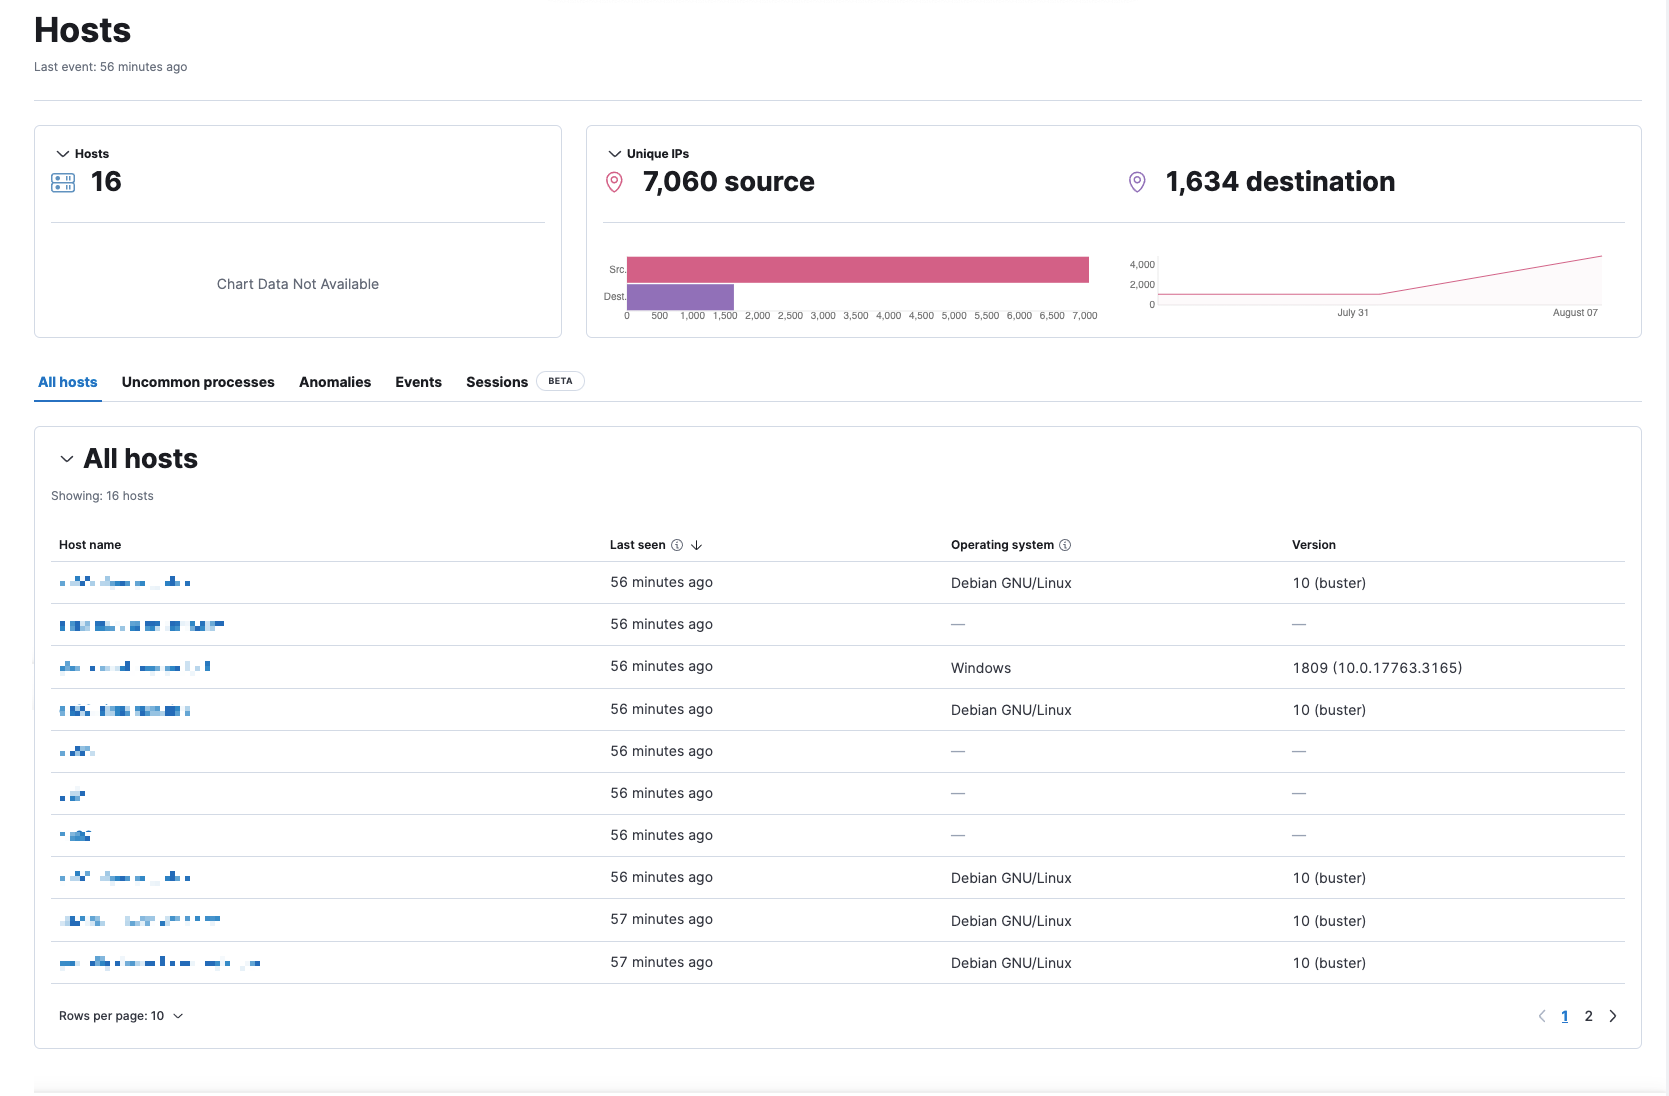
Host KPI charts
KPI charts show metrics for hosts and unique IPs within the time range specified in the date picker. Data in the KPI charts is depicted through linear or bar graphs.
The default time range is within the last 15 minutes.
Data tables
Beneath the KPI charts are data tables, categorized by individual tabs, which are useful for viewing and investigating specific types of data. Select the relevant tab to view the following data:
- All hosts: High-level host details.
- Uncommon processes: Uncommon processes running on hosts.
- Anomalies: Anomalies discovered by machine learning jobs.
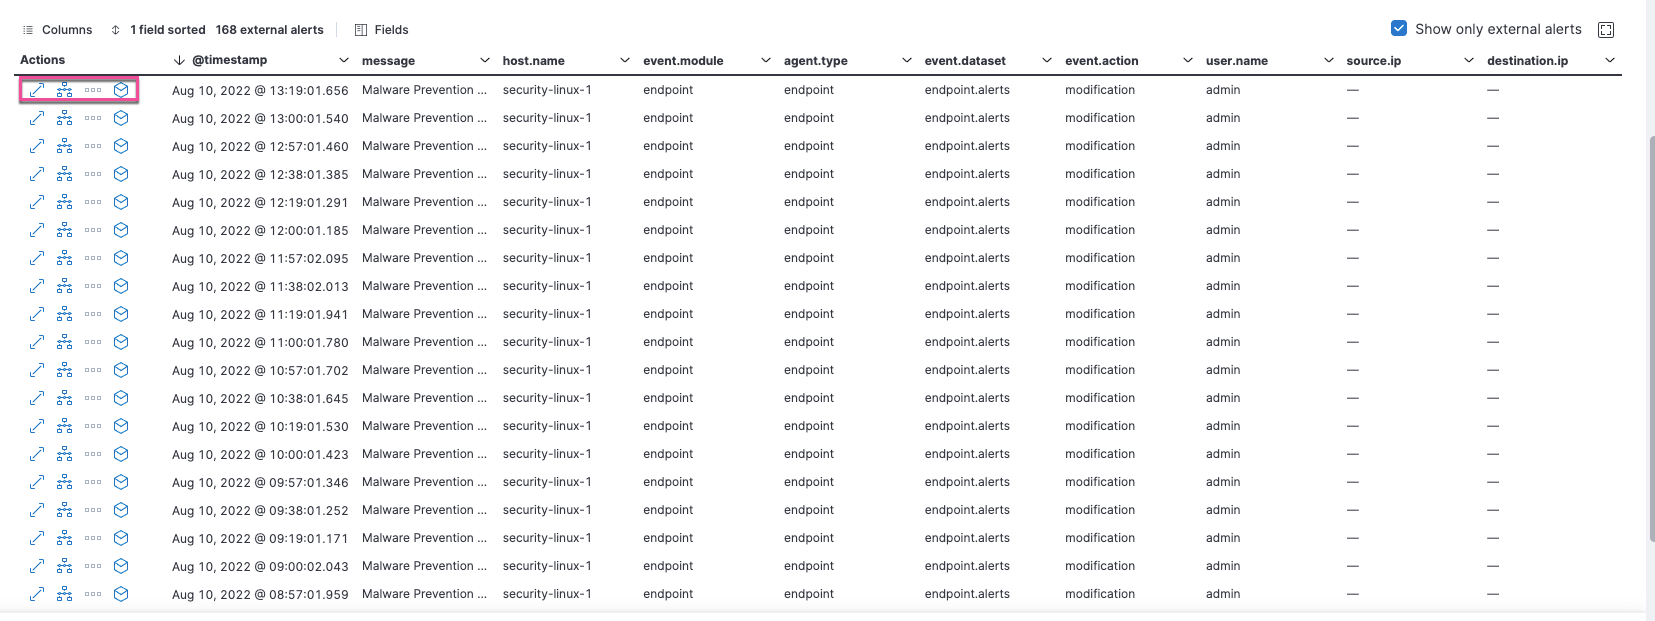
- Events: All host events. To display alerts received from external monitoring tools, scroll down to the Events table and select Show only external alerts on the right.
- Sessions: Linux process events that you can open in Session View, an investigation tool that allows you to examine Linux process data at a hierarchal level.
The tables within the Events and Sessions tabs include inline actions and several customization options. To learn more about what you can do with the data in these tables, refer to Manage detection alerts.
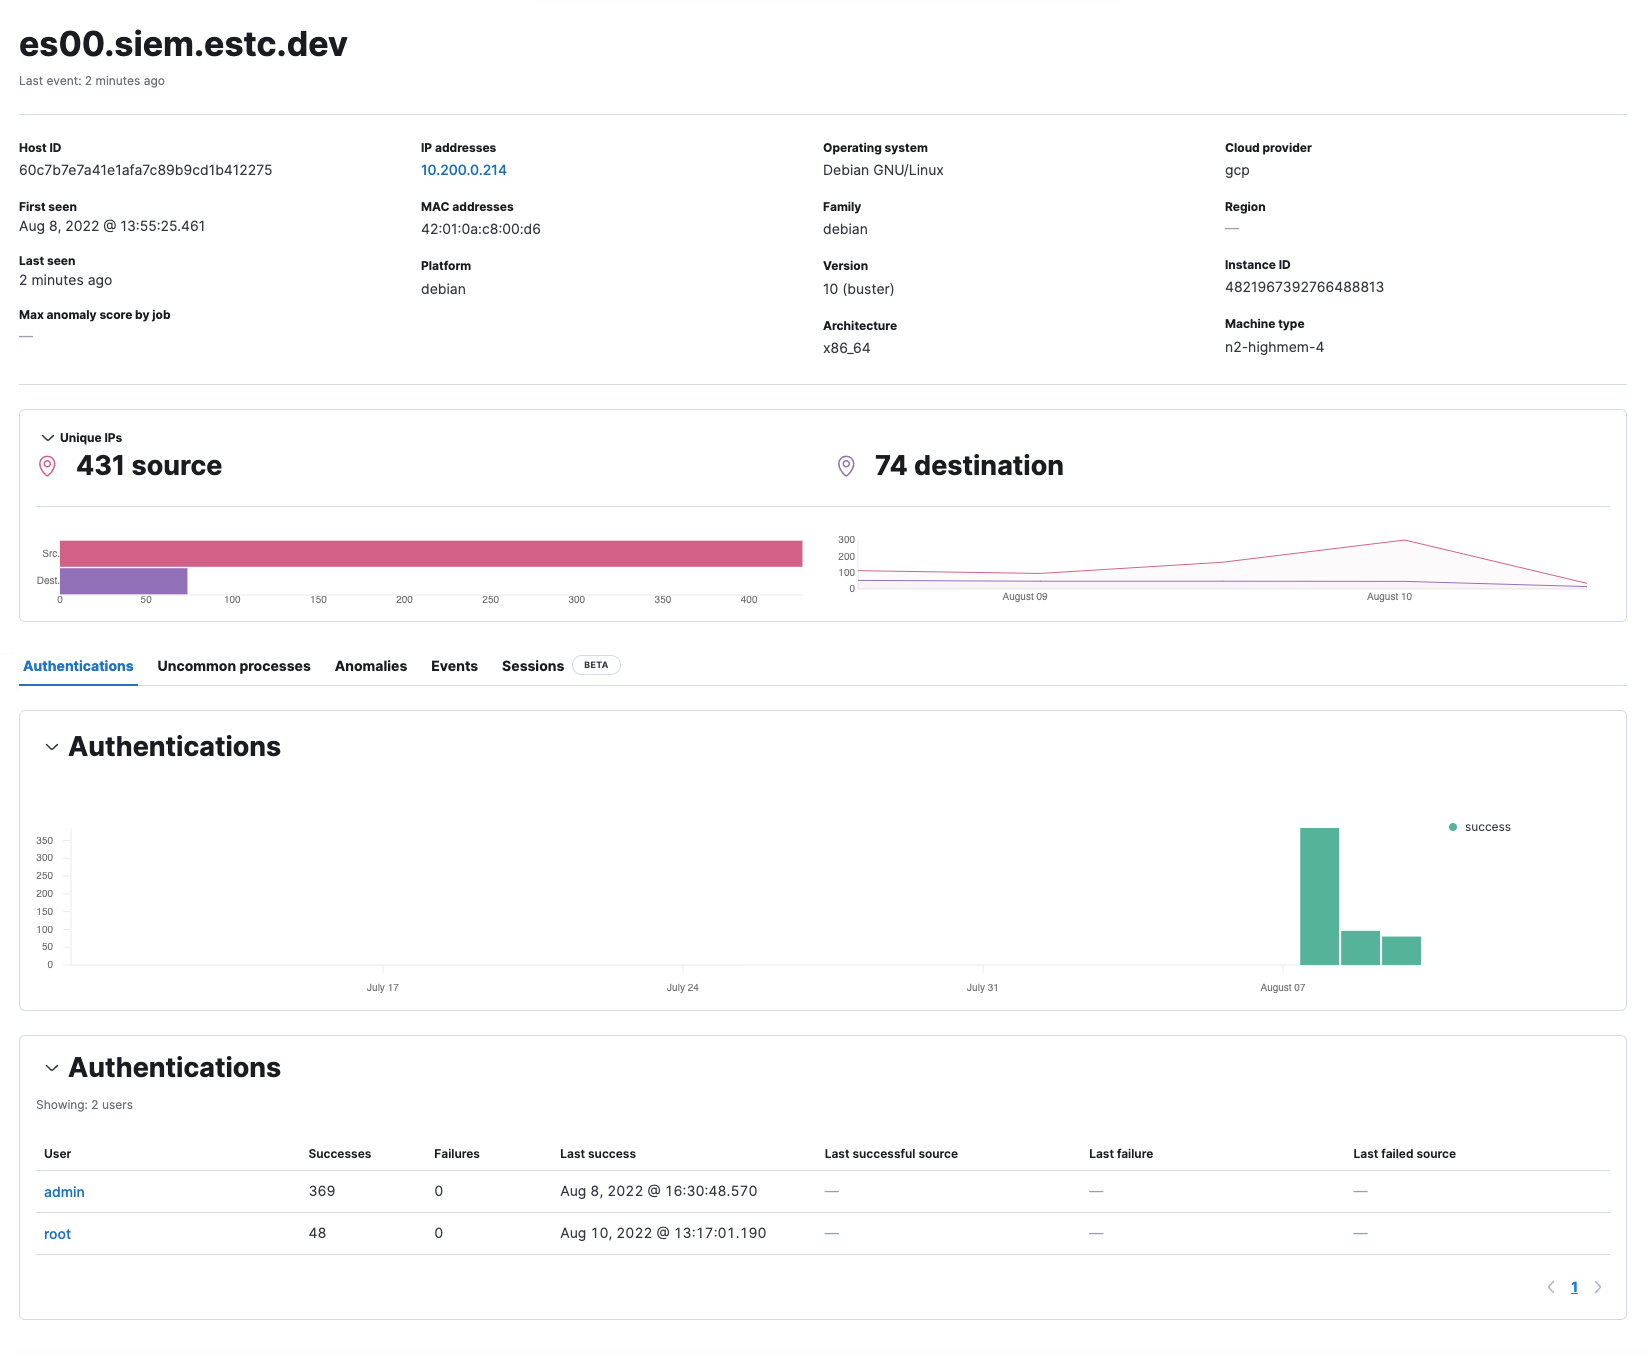
Host detail pages
A host’s detail page displays all relevant information for the selected host, such as when the host was first and last seen, associated IP addresses, and operating system. It also displays graphs for unique IPs, destinations, and user authentications. To view a host’s detail page, click its Host name link from the All hosts list.