Network page
editNetwork page
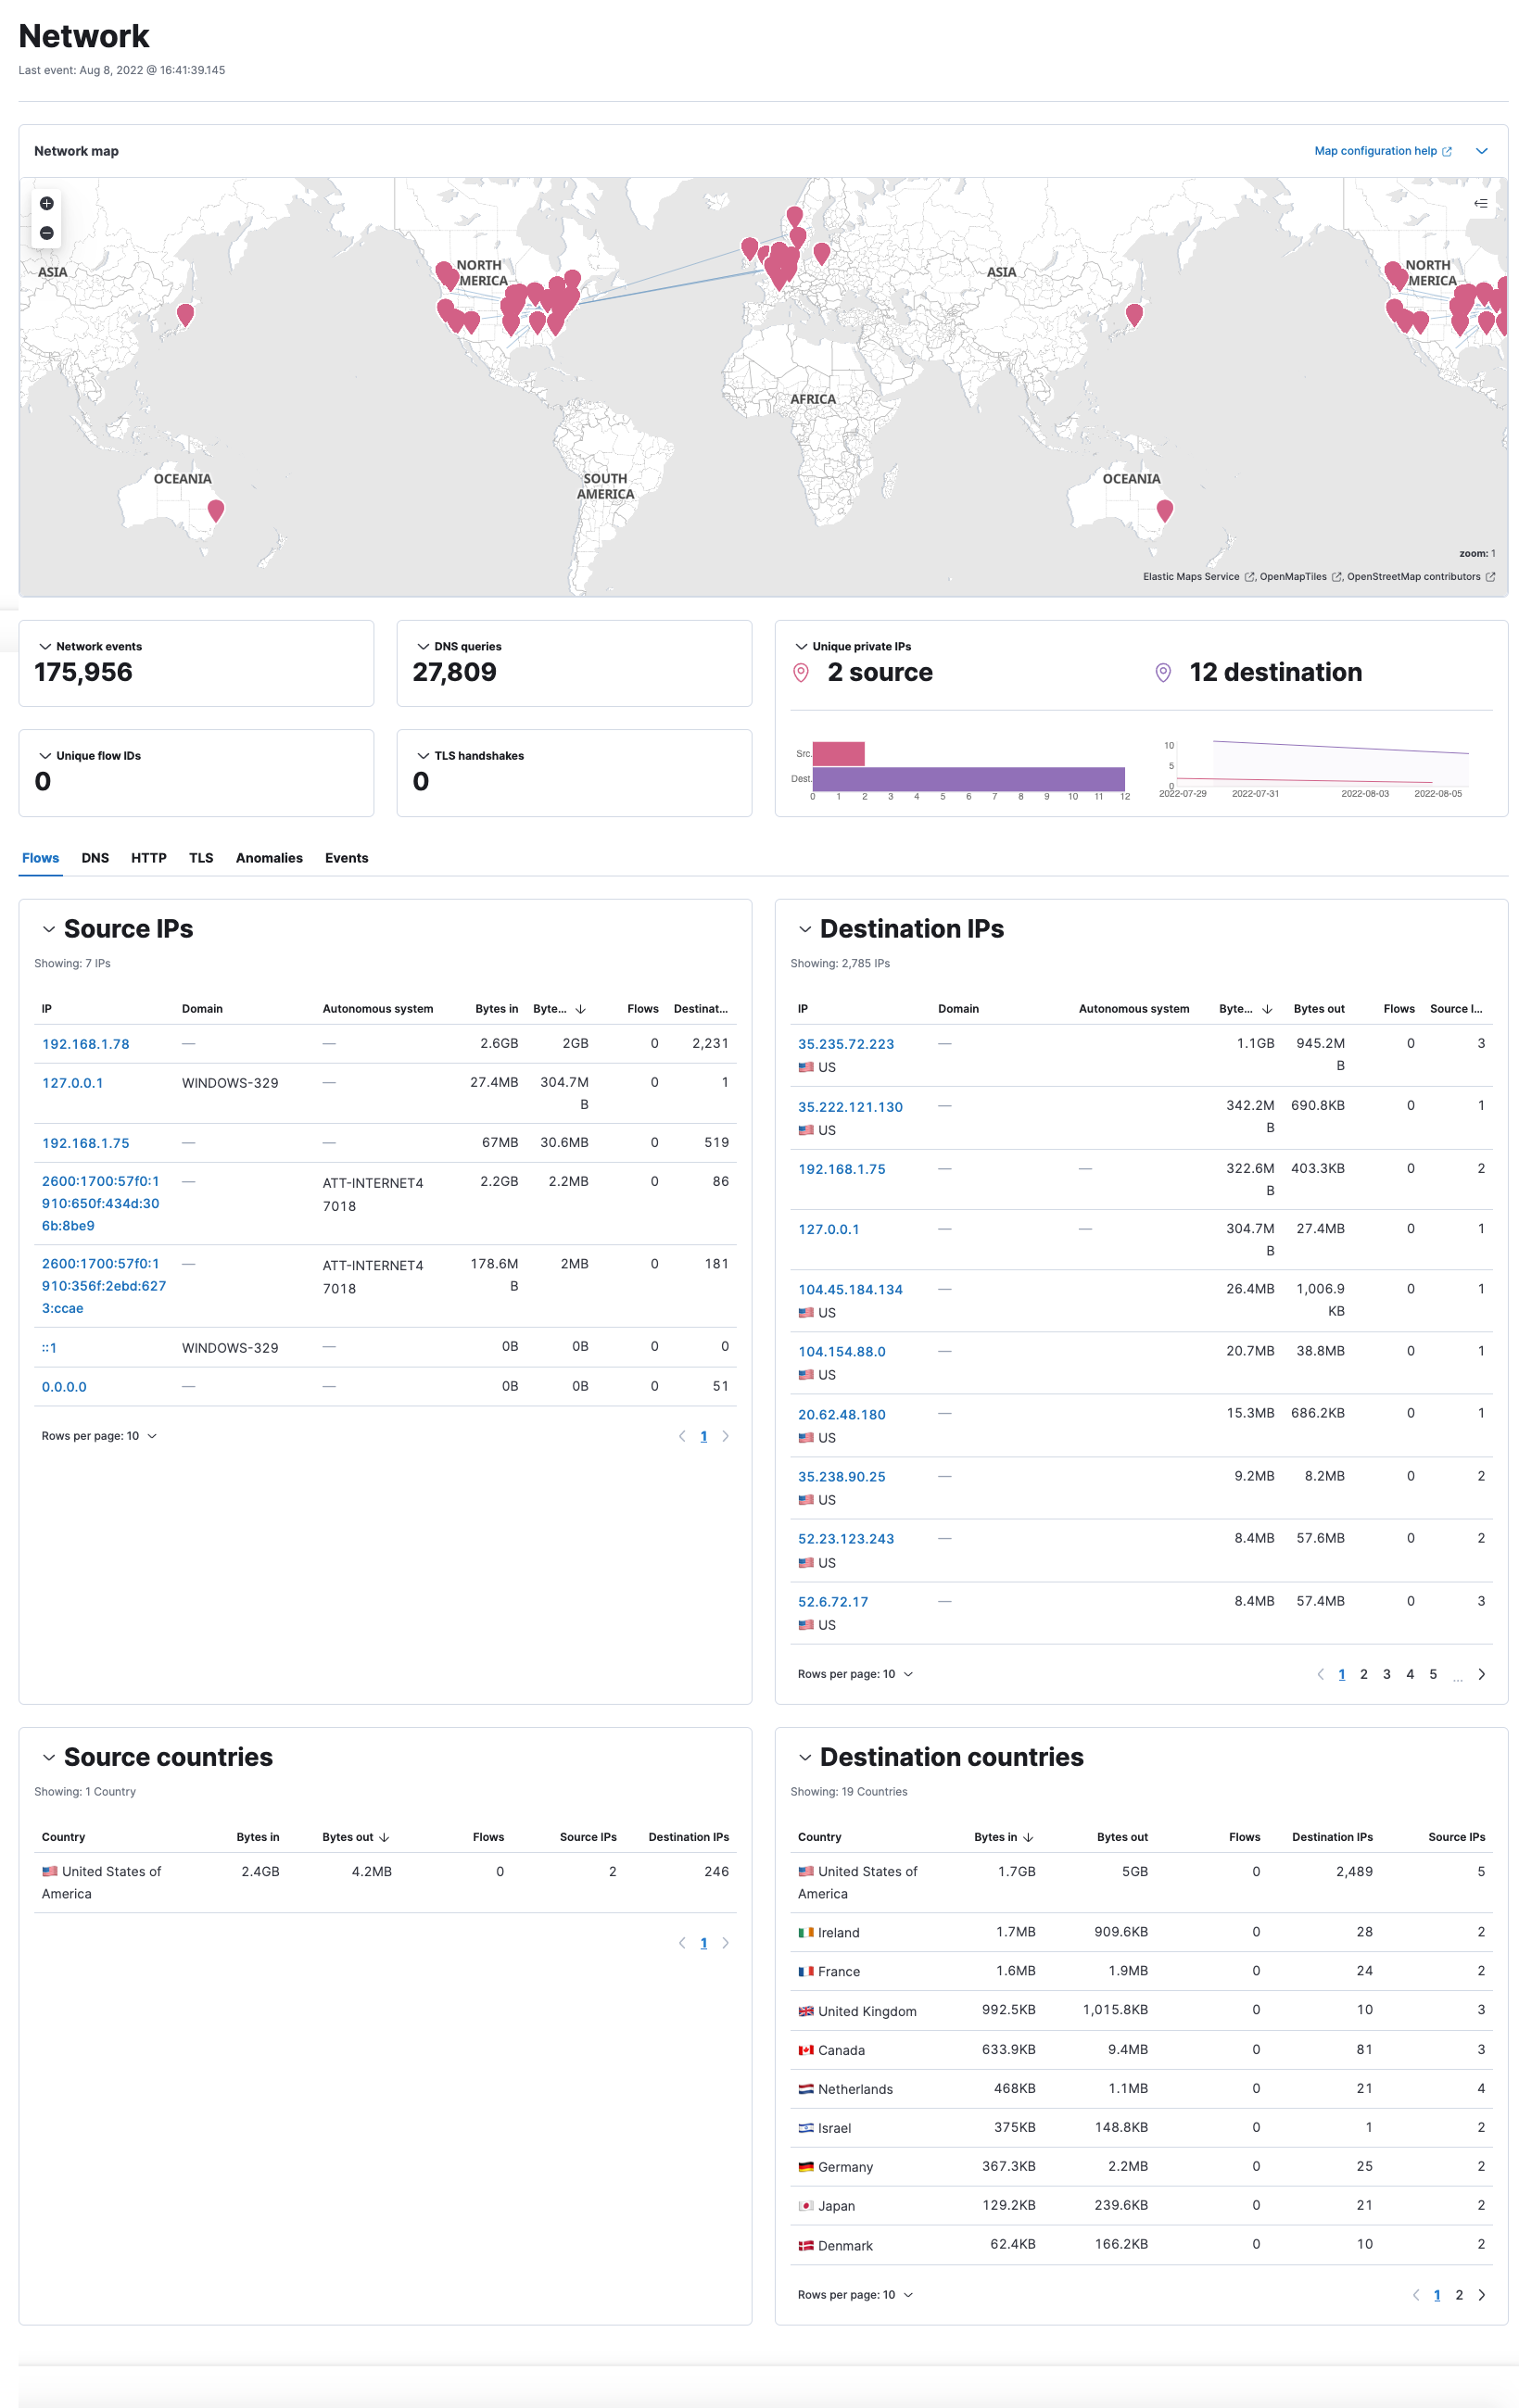
editThe Network view provides key network activity metrics in an interactive map and provides network event tables that enable interaction with the Timeline. You can drag and drop items of interest from the Network view to Timeline for further investigation.
To access the interactive map, you need either Read or All privileges for Maps (Kibana Privileges → Analytics → Maps). To learn more about map setup, refer to Configure network map data.
Interactive widgets let you drill down for deeper insights:
- Network events
- DNS queries
- Unique flow IDs
- TLS handshakes
- Unique private IPs
There are also tabs for viewing and investigating specific types of data:
- Flows: Source and destination IP addresses and countries
- DNS: DNS network queries
- HTTP: Received HTTP requests (HTTP requests for applications using Elastic APM are monitored by default)
- TLS: Handshake details
- Anomalies: Anomalies discovered by machine learning jobs
- Events: All network events. To display alerts received from external monitoring tools, scroll down to the Events table and select Show only external alerts on the right.
The Events table includes inline actions and several customization options. To learn more about what you can do with the data in these tables, refer to Manage detection alerts.
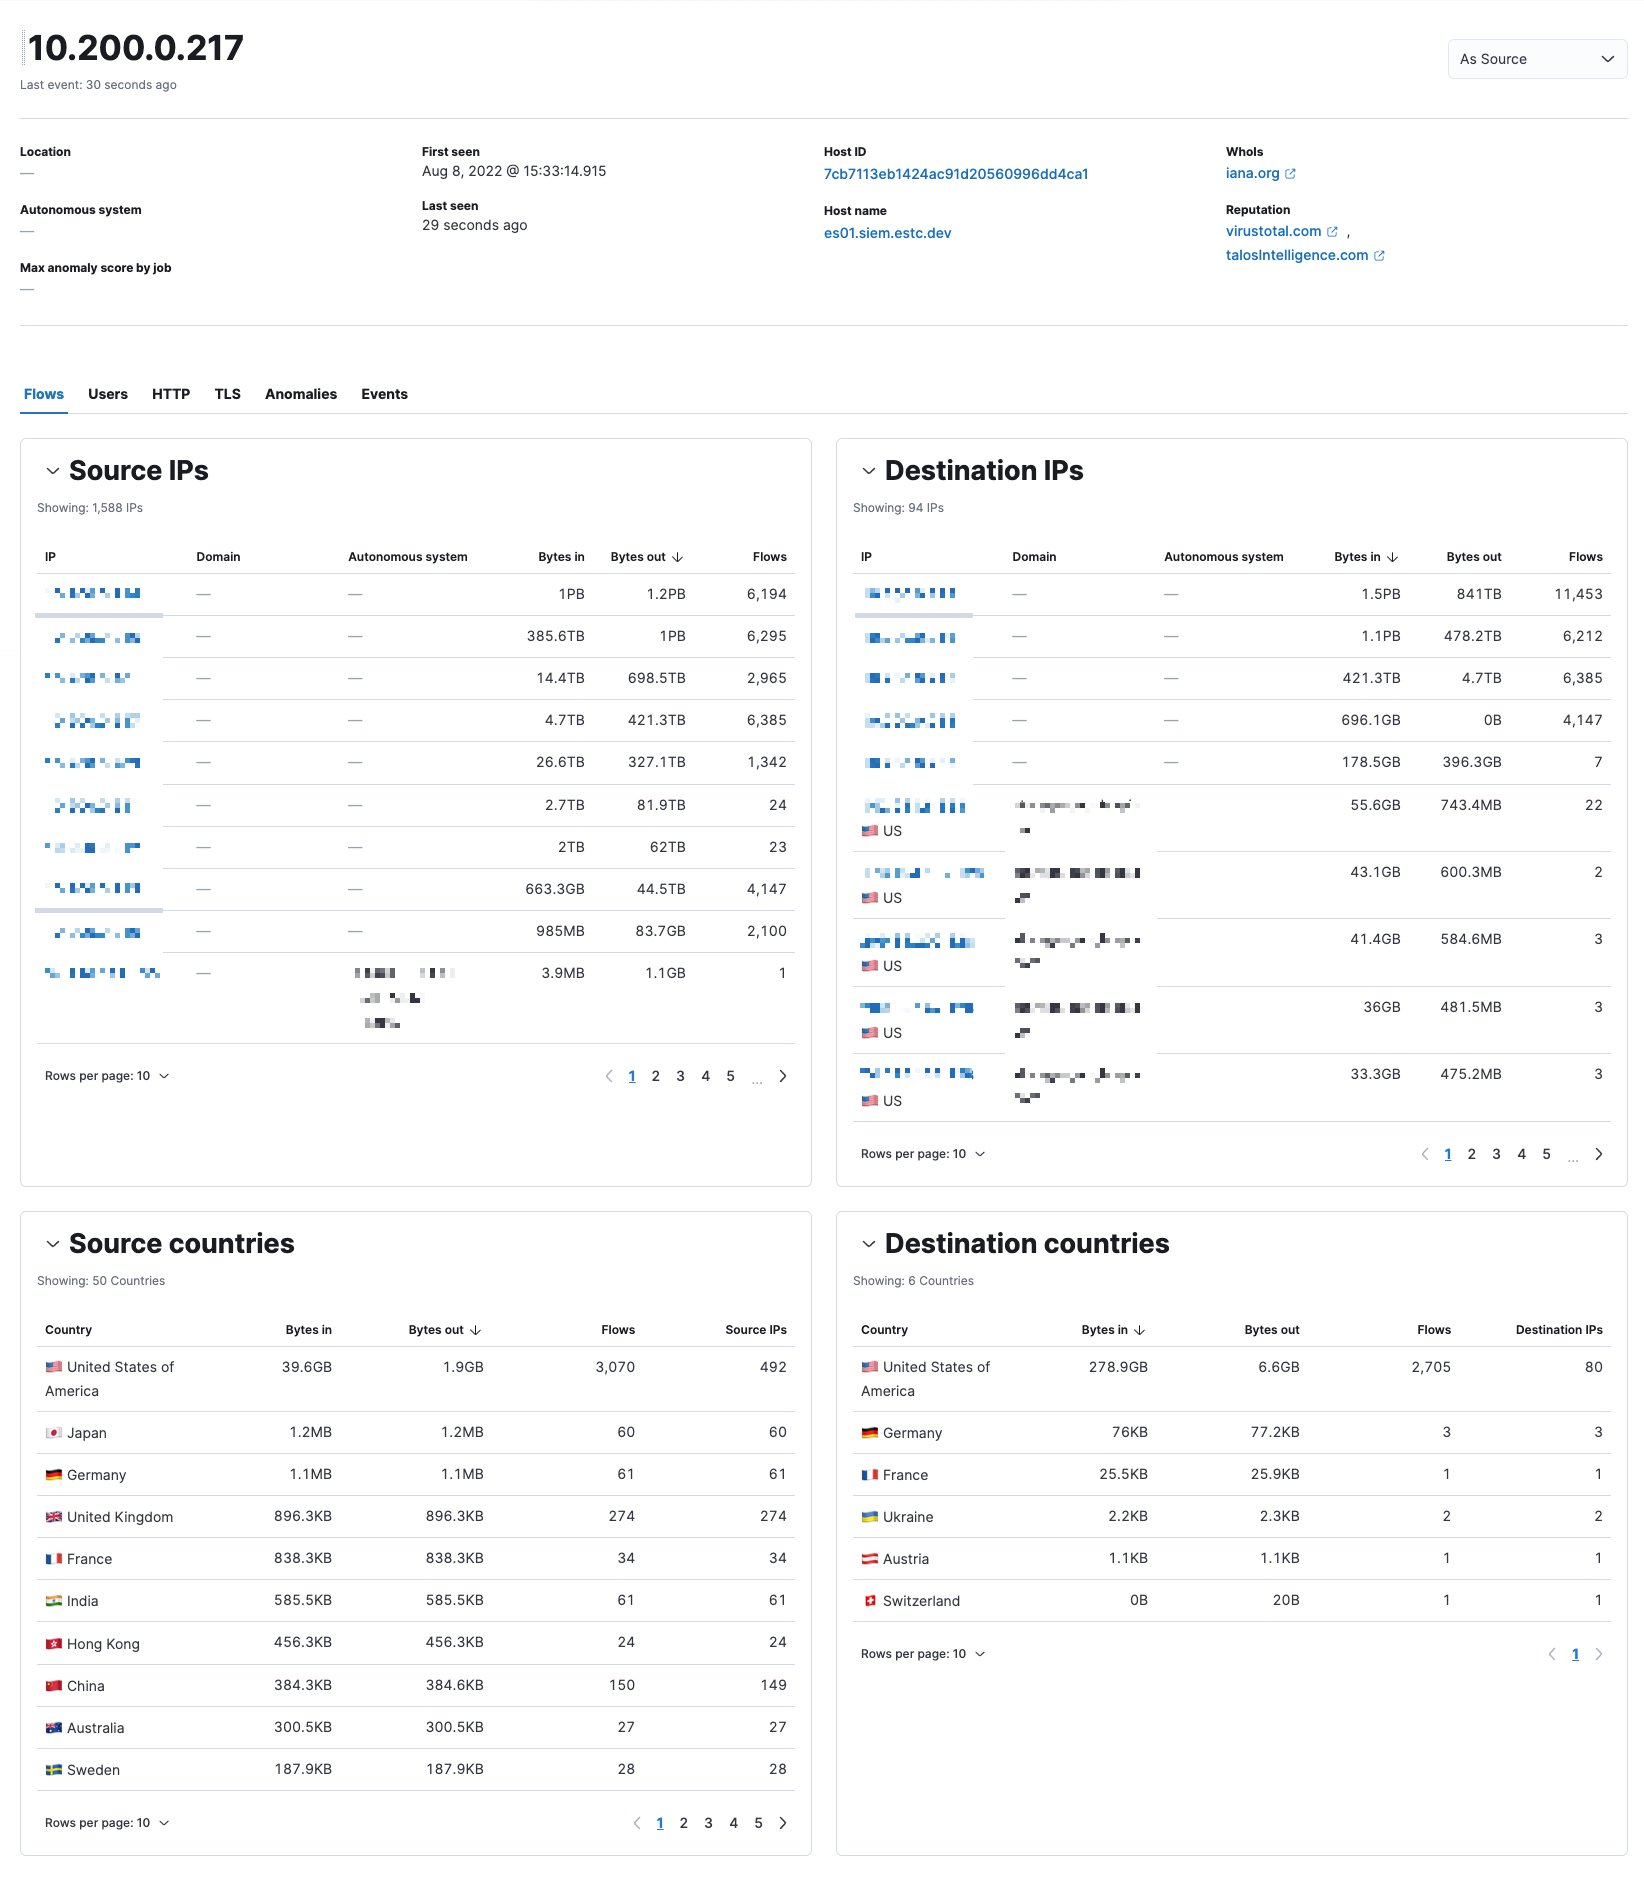
IP detail pages
An IP’s detail page shows information for the selected IP address, including links to external sites for verifying the IP address’s reputation. By default, the external sites are TALOS and VIRUSTOTAL. Display reputation links on IP detail pages describes how to configure IP reputation links.
To view an IP’s detail page, select an IP address from the Source IPs or Destination IPs table.
Map
editThe map provides a visual overview of your network traffic. It is interactive, so you can start exploring data directly from the map. Hover over source and destination points to observe more information, such as hostnames and IP addresses. To drill down, click a point and use the filter icon to add a field to the filter bar or drag a field to Timeline. You can also click a hostname to jump to the Hosts page, or click an IP address to open the relevant network details.
Just as you can start an investigation using the map, the map refreshes to show relevant data when you run a query or update the time frame.
To add and remove layers, click on the Options menu (…) in the top right corner of the map.