Configure advanced settings
editConfigure advanced settings
editThe advanced settings determine:
- Which indices Elastic Security uses to retrieve data
- Whether the news feed is displayed on the Overview page
- The default time interval used to filter Elastic Security pages
- The default Elastic Security pages refresh time
- Machine learning anomaly score display threshold
- Which IP reputation links appear on IP detail pages
- Whether cross-cluster search (CCS) privilege warnings are displayed
You need All privileges for the Advanced Settings feature to change these
settings (refer to Kibana privileges).
Modifying advanced settings can affect Kibana performance and cause problems that are difficult to diagnose. Setting a property value to a blank field reverts to the default behavior, which might not be compatible with other configuration settings. Deleting a custom setting removes it from Kibana permanently.
Access advanced settings
editTo access advanced settings, go to Stack Management → Advanced Settings, then scroll down to Security Solution settings.
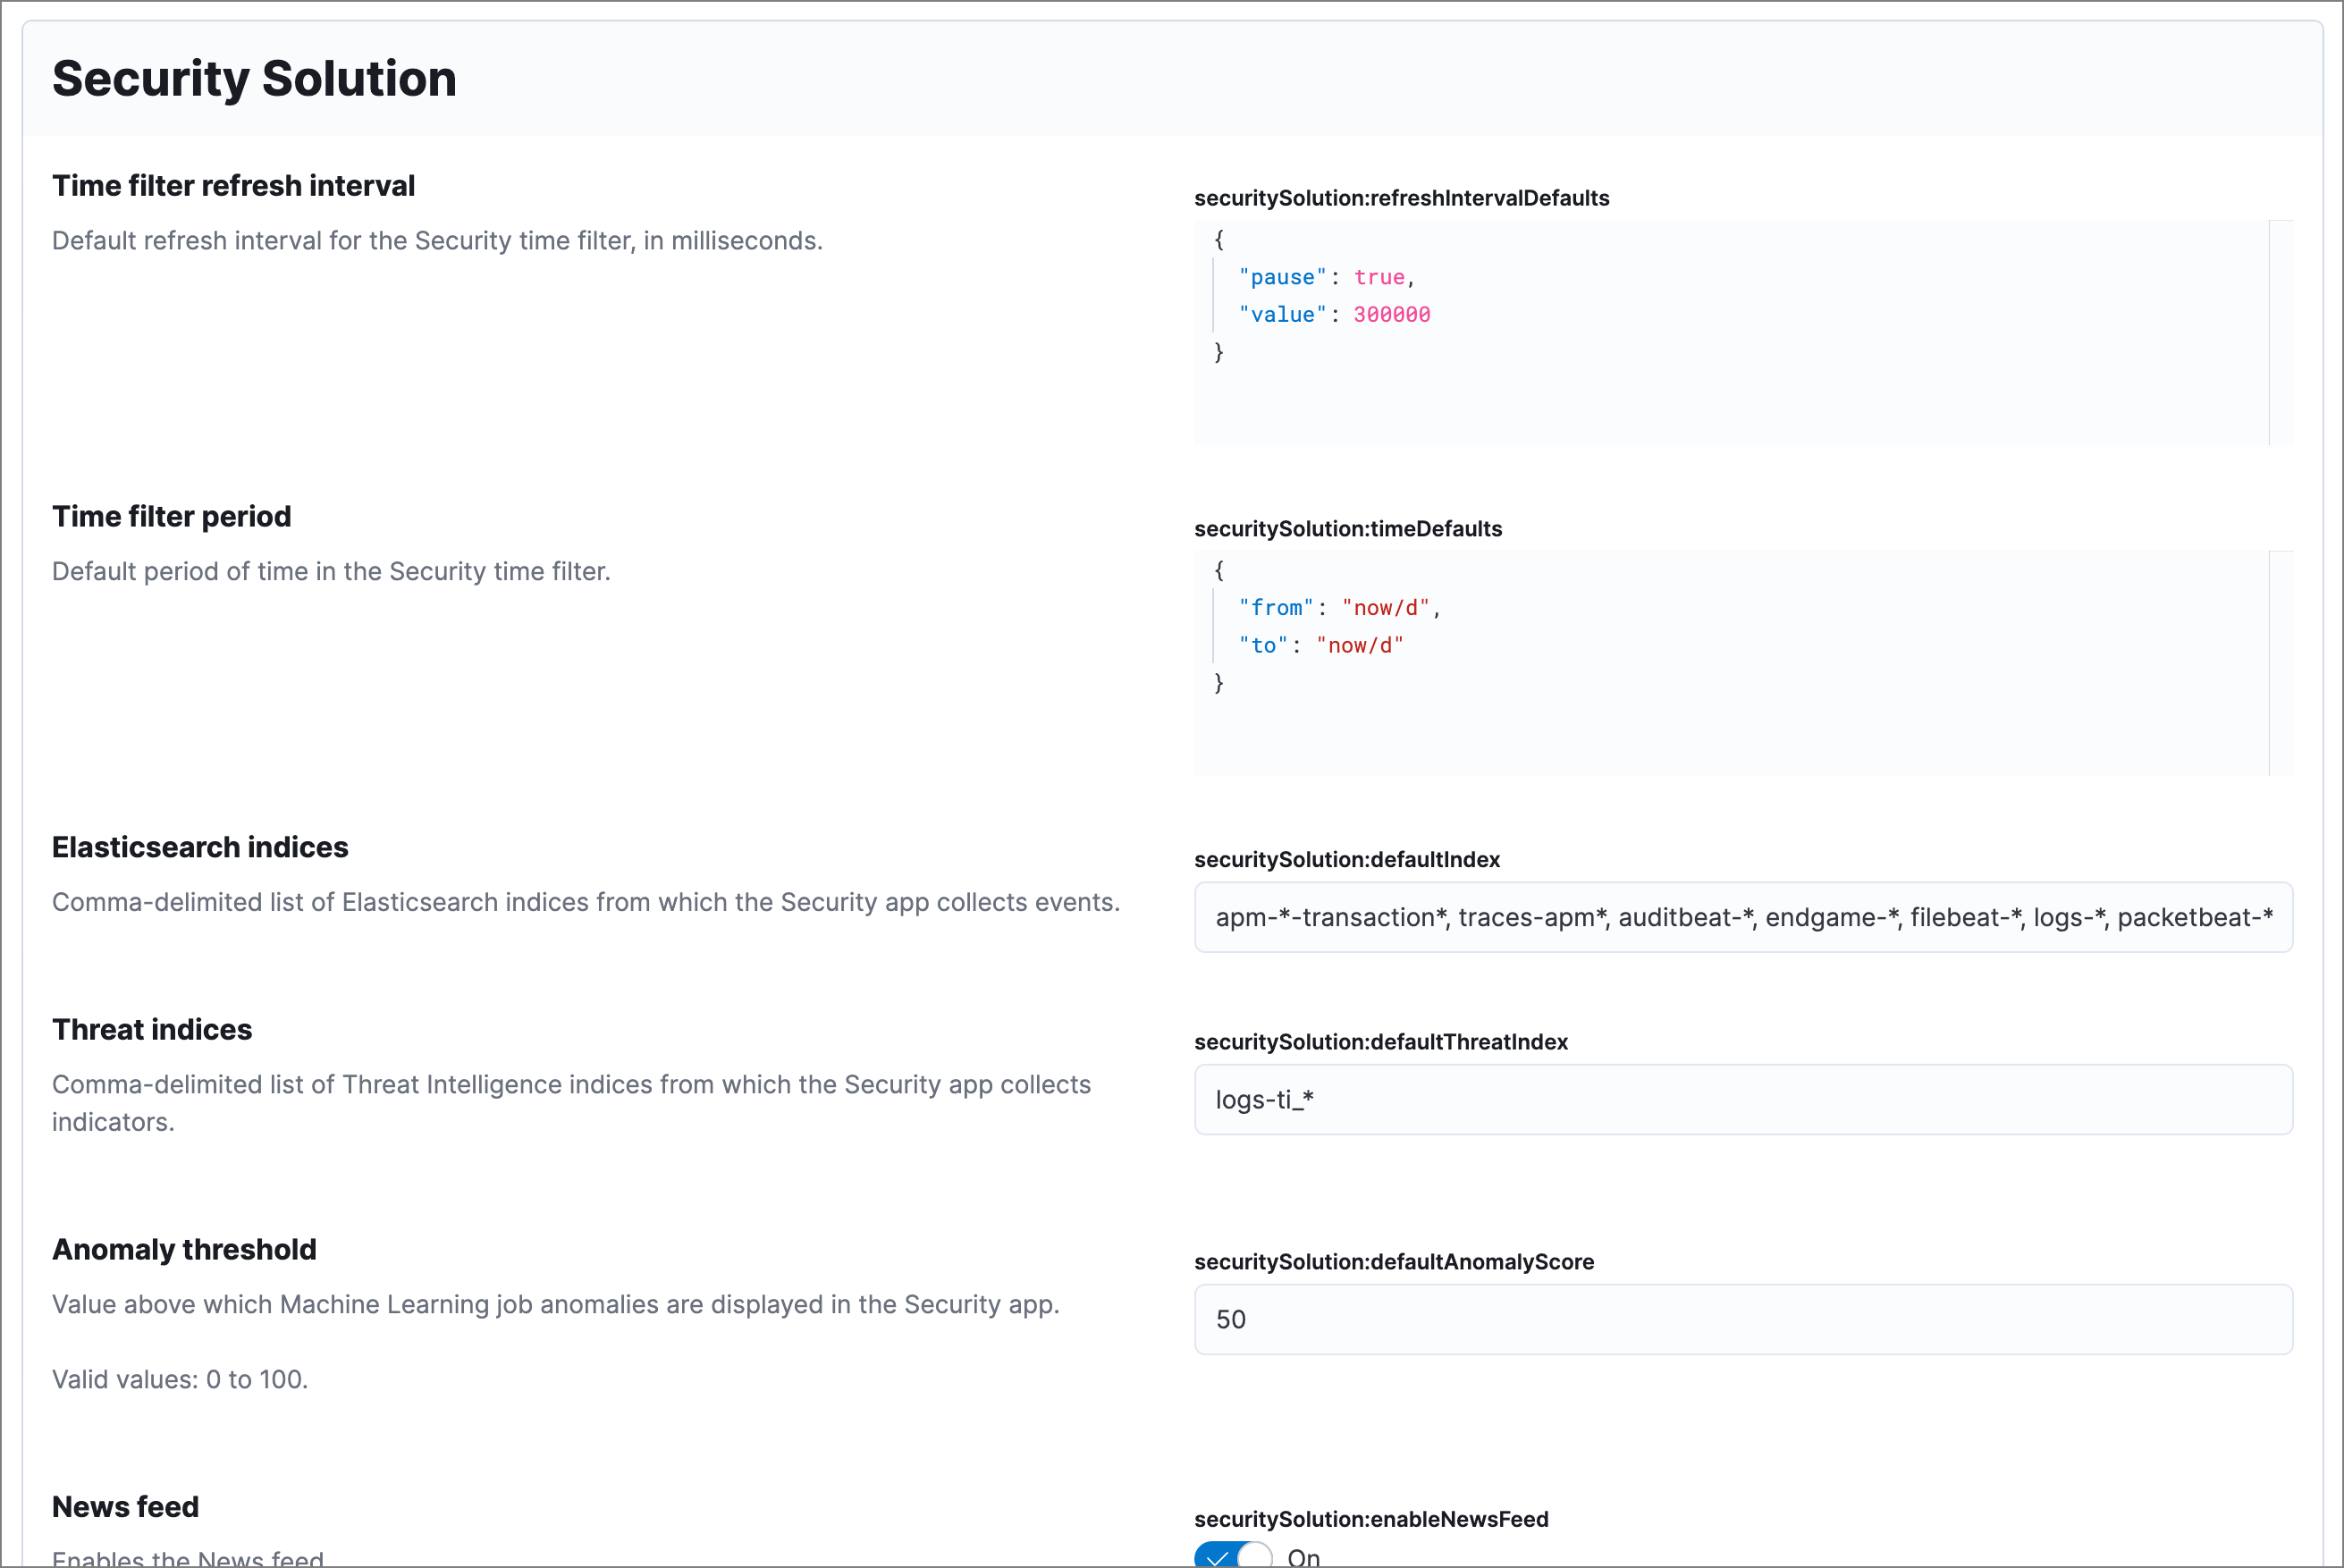
Update default Elastic Security indices
editThe securitySolution:defaultIndex field defines which Elasticsearch indices the
Elastic Security app uses to collect data. By default, these index patterns are used to
match Elasticsearch indices:
-
apm-*-transaction* -
auditbeat-* -
endgame-* -
filebeat-* -
logs-* -
packetbeat-* -
winlogbeat-*
Index patterns use wildcards to specify a set of indices. For example, the
filebeat-* index pattern means all indices starting with filebeat- are
available in the Elastic Security app.
All of the default index patterns match Beats and Elastic Agent indices. This means all data shipped via Beats and the Elastic Agent is automatically added to the Elastic Security app.
You can add or remove any indices and index patterns as required. For background information on Elasticsearch indices, refer to Data in: documents and indices.
If you leave the logs-* index selected, by default, all Elastic cloud logs are excluded from all queries in the Elastic Security app. This is to avoid adding data from cloud monitoring to the app.
Elastic Security requires ECS-compliant data. If you use third-party data collectors to ship data to Elasticsearch, the data must be mapped to ECS. Elastic Security ECS field reference lists ECS fields used in Elastic Security.
Update default Elastic Security threat intelligence indices
editThe securitySolution:defaultThreatIndex advanced setting specifies threat intelligence indices that Elastic Security features query for ingested threat indicators. This setting affects features that query threat intelligence indices, such as the Threat Intelligence view on the Overview page, indicator match rules, and the alert enrichment query. You can specify one or more threat intelligence indices; multiple indices must be separated by commas. By default, only the logs-ti* index pattern is specified. Do not remove or overwrite this index pattern, as it is used by Elastic Agent integrations.
Threat intelligence indices aren’t required to be ECS-compatible for use in indicator match rules. However, we strongly recommend compatibility if you want your alerts to be enriched with relevant threat indicator information. When searching for threat indicator data, indicator match rules use the threat indicator path specified in the Indicator prefix override advanced setting. Visit Configure advanced rule settings for more information.
Telemetry settings
editKibana transmits certain information about Elastic Security when users interact with the Elastic Security app, detailed below. Kibana redacts or obfuscates personal data (IP addresses, host names, usernames, etc.) before transmitting messages to Elastic. Security-specific telemetry events include:
- Elastic Endpoint Security alerts: Information about malicious activity detected using Elastic Endpoint detection engines. Examples of alert data include malicious process names, digital signatures, and file names written by the malicious software. Examples of alert metadata include the time of the alert, the Elastic Endpoint version and related detection engine versions.
- Configuration data for Elastic Endpoint: Information about the configuration of Elastic Endpoint deployments. Examples of configuration data include the Endpoint versions, operating system versions, and performance counters for Endpoint.
- Exception list entries for Elastic rules: Information about exceptions added for Elastic rules. Examples include trusted applications, detection exceptions, and rule exceptions.
- Security alert activity records: Information about actions taken on alerts generated in the Elastic Security app, such as acknowledged or closed.
To learn more, refer to our Privacy Statement.
Modify news feed settings
editYou can change these settings, which affect the news feed displayed on the Elastic Security Overview page:
-
securitySolution:enableNewsFeed: Enables the security news feed on the Security Overview page. -
securitySolution:newsFeedUrl: The URL from which the security news feed content is retrieved.
Change the default search interval and data refresh time
editThese settings determine the default time interval and refresh rate Elastic Security pages use to display data when you open the app:
-
securitySolution:timeDefaults: Default time interval -
securitySolution:refreshIntervalDefaults: Default refresh rate
Refer to Date Math for information about the syntax. The UI time filter overrides the default values.
Set machine learning score threshold
editWhen security machine learning jobs are enabled, this setting determines the threshold above which anomaly scores are displayed in Elastic Security:
-
securitySolution:defaultAnomalyScore
Display reputation links on IP detail pages
editOn IP details pages (Security → Network → IP address), links to external sites for verifying the IP address’s reputation are displayed. By default, links to these sites are listed: TALOS and VIRUSTOTAL.
The securitySolution:ipReputationLinks field determines which IP reputation
sites are listed. To modify the listed sites, edit the field’s JSON array. These
fields must be defined in each array element:
-
name: The link’s UI display name. -
url_template: The link’s URL. It can include{{ip}}, which is placeholder for the IP address you are viewing on the IP detail page.
Example
Adds a link to https://www.dnschecker.org on IP detail pages:
[
  { "name": "virustotal.com", "url_template": "https://www.virustotal.com/gui/search/{{ip}}" },
  { "name": "dnschecker.org", "url_template": "https://www.dnschecker.org/ip-location.php?ip={{ip}}" },
  { "name": "talosIntelligence.com", "url_template": "https://talosintelligence.com/reputation_center/lookup?search={{ip}}" }
]
Configure cross-cluster search privilege warnings
editEach time a detection rule runs using a remote cross-cluster search (CCS) index pattern, it will return a warning saying that the rule may not have the required read privileges to the remote index. Because privileges cannot be checked across remote indices, this warning displays even when the rule actually does have read privileges to the remote index.
If you’ve ensured that your detection rules have the required privileges across your remote indices, you can use the securitySolution:enableCcsWarning setting to disable this warning and reduce noise.