Managing detection alerts
editManaging detection alerts
editThe Detections page displays all detection alerts. From the Alerts table, you can change an alert’s status, and start investigating and analyzing alerts in Timeline.
From Timeline, you can create cases to track issues and share information with colleagues.
To view detection alerts created by a specific rule, you can:
-
Filter for a specific rule in the KQL bar (for example,
signal.rule.name :"SSH (Secure Shell) from the Internet"). - View detection alerts in the Rule details page (click Manage detection rules → rule name in the All rules table).
KQL autocomplete for .siem-signals-* indices is available on the
Detections and Rule details pages, and in Timeline when either All or
Detection alerts is selected.
Use the icons in the upper left corner of the Alerts table to customize displayed columns and row renderers, and view the table in full screen mode.
Change alert statuses
editYou can set an alert’s status to indicate whether it needs to be investigated
(Open), is under active investigation (In progress), or resolved
(Closed). By default, the Alerts table displays open alerts. To view alerts
with other statuses, click In progress or Closed.
To change alert statuses, either:
- In the alert’s row, click the more options icon, and then select the required status (Mark in progress, Close alert, or Open alert).
- In the Alerts table, select all the alerts you want to change, and then select Take action → Close selected, Open selected, or Mark in progress.
Send alerts to Timeline
editTo view an alert in Timeline, click the Investigate in timeline icon.
When you send an alert generated by a threshold rule to Timeline, all matching events are listed in the Timeline, even ones that did not reach the threshold value. For example, if you have an alert generated by a threshold rule that detects 10 failed login attempts, when you send that alert to Timeline all failed login attempts detected by the rule are listed.
If the rule that generated the alert uses a Timeline template, when you investigate the alert in Timeline, the dropzone query values defined in the template are replaced with their corresponding alert values.
Example
This Timeline template uses the host.name: "{host.name}" dropzone filter in
the rule. When alerts generated by the rule are investigated in Timeline, the
{host.name} value is replaced with the alert’s host.name value. If the
alerts’s host.name value is Windows-ArsenalFC, the Timeline dropzone query
is host.name: "Windows-ArsenalFC".
See Investigating events in Timeline for information on creating Timelines and Timeline templates. For information on how to add Timeline templates to rules, see Creating detection rules.
Add rule exceptions
editYou can add exceptions to the rule that generated the alert directly from the Alerts table. Exceptions prevent a rule from generating alerts even when its criteria are met.
To add an exception, click the actions icon (three dots) and then select Add exception.
For information about exceptions and how to use them, see Rule exceptions and value lists.
Visually analyze process relationships
editFor process events received from the Elastic Endpoint agent, you can open a visual mapping of the relationships and hierarchy connecting related processes.
You can only visualize events triggered from hosts configured with the Elastic Endpoint Security Integration.
To visualize process relationships, select the Analyze Event icon next to the event. The Analyze Event view appears.
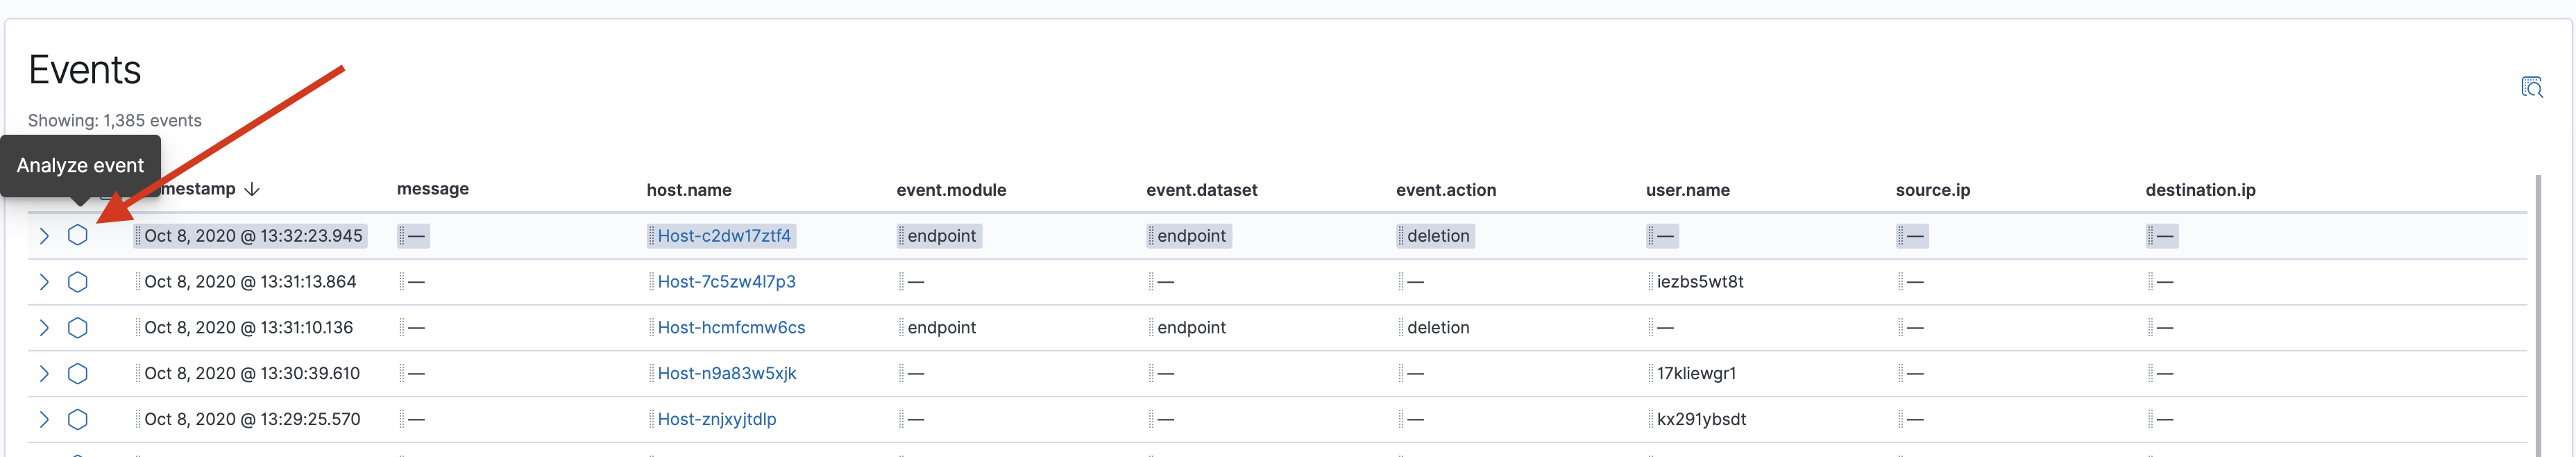
Inside the view, each cube represents either a node, process, or alert. If a process contains events, you can select any event associated with the process based on the event type.
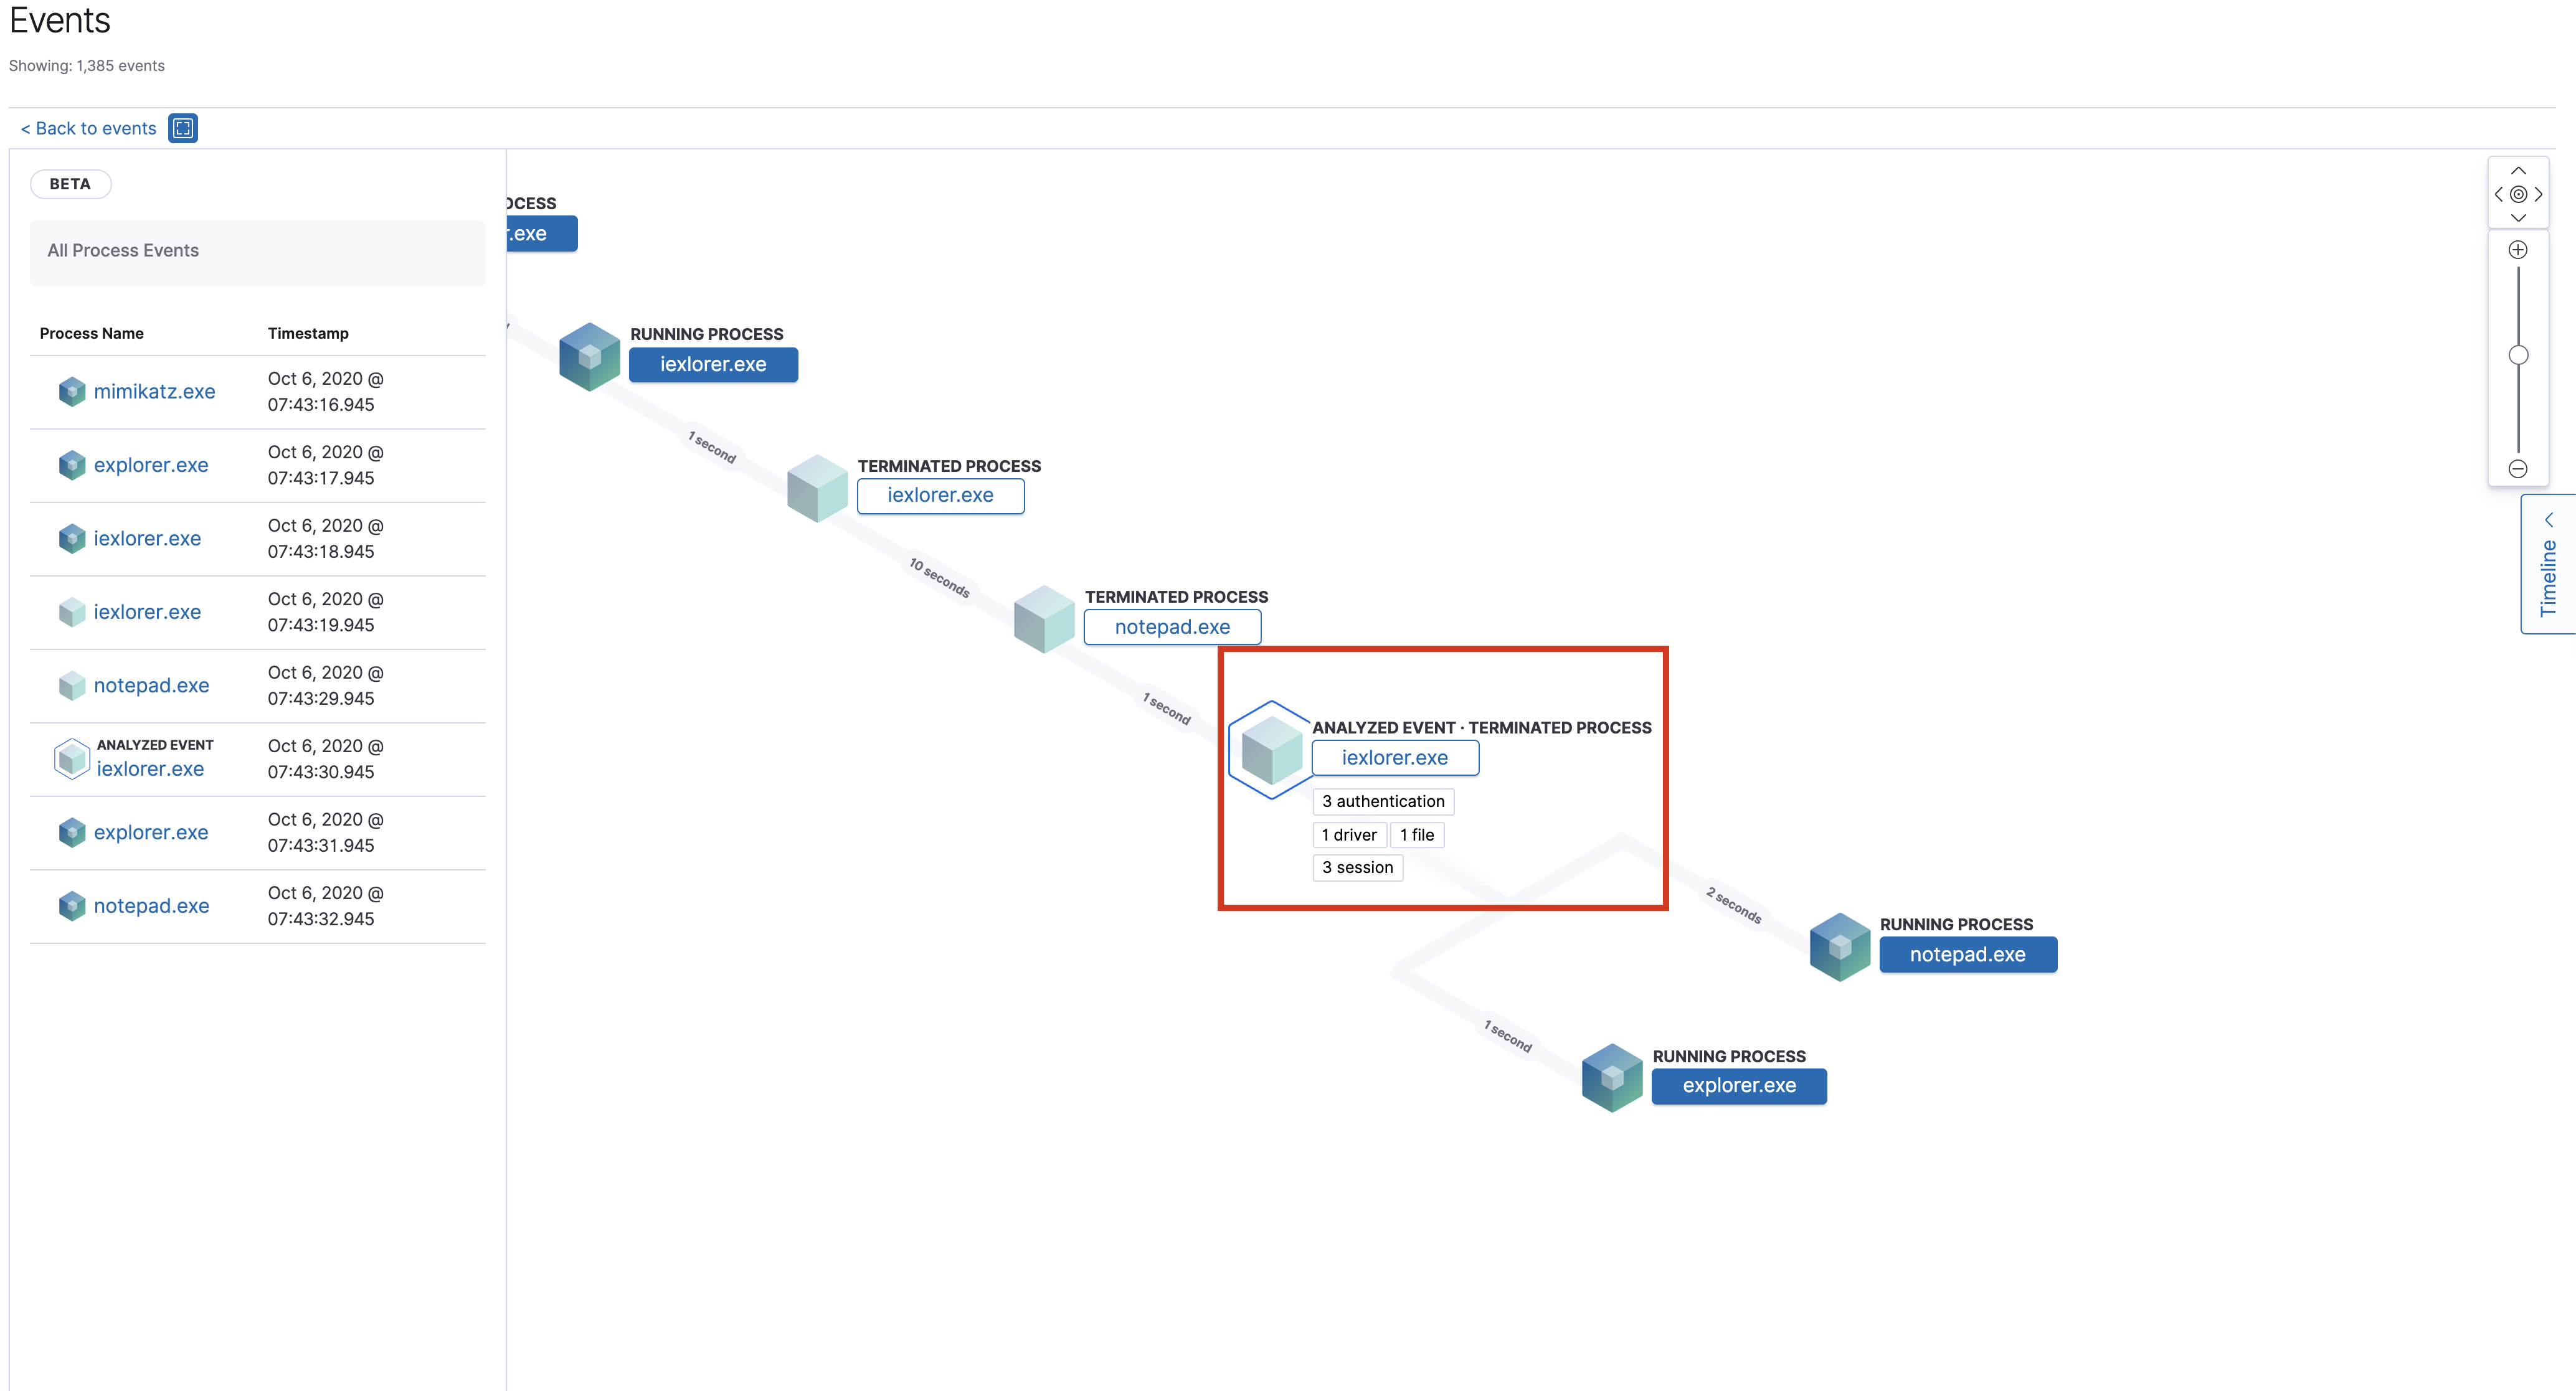
Once selected, the left-panel gives details about the event and associated processes.
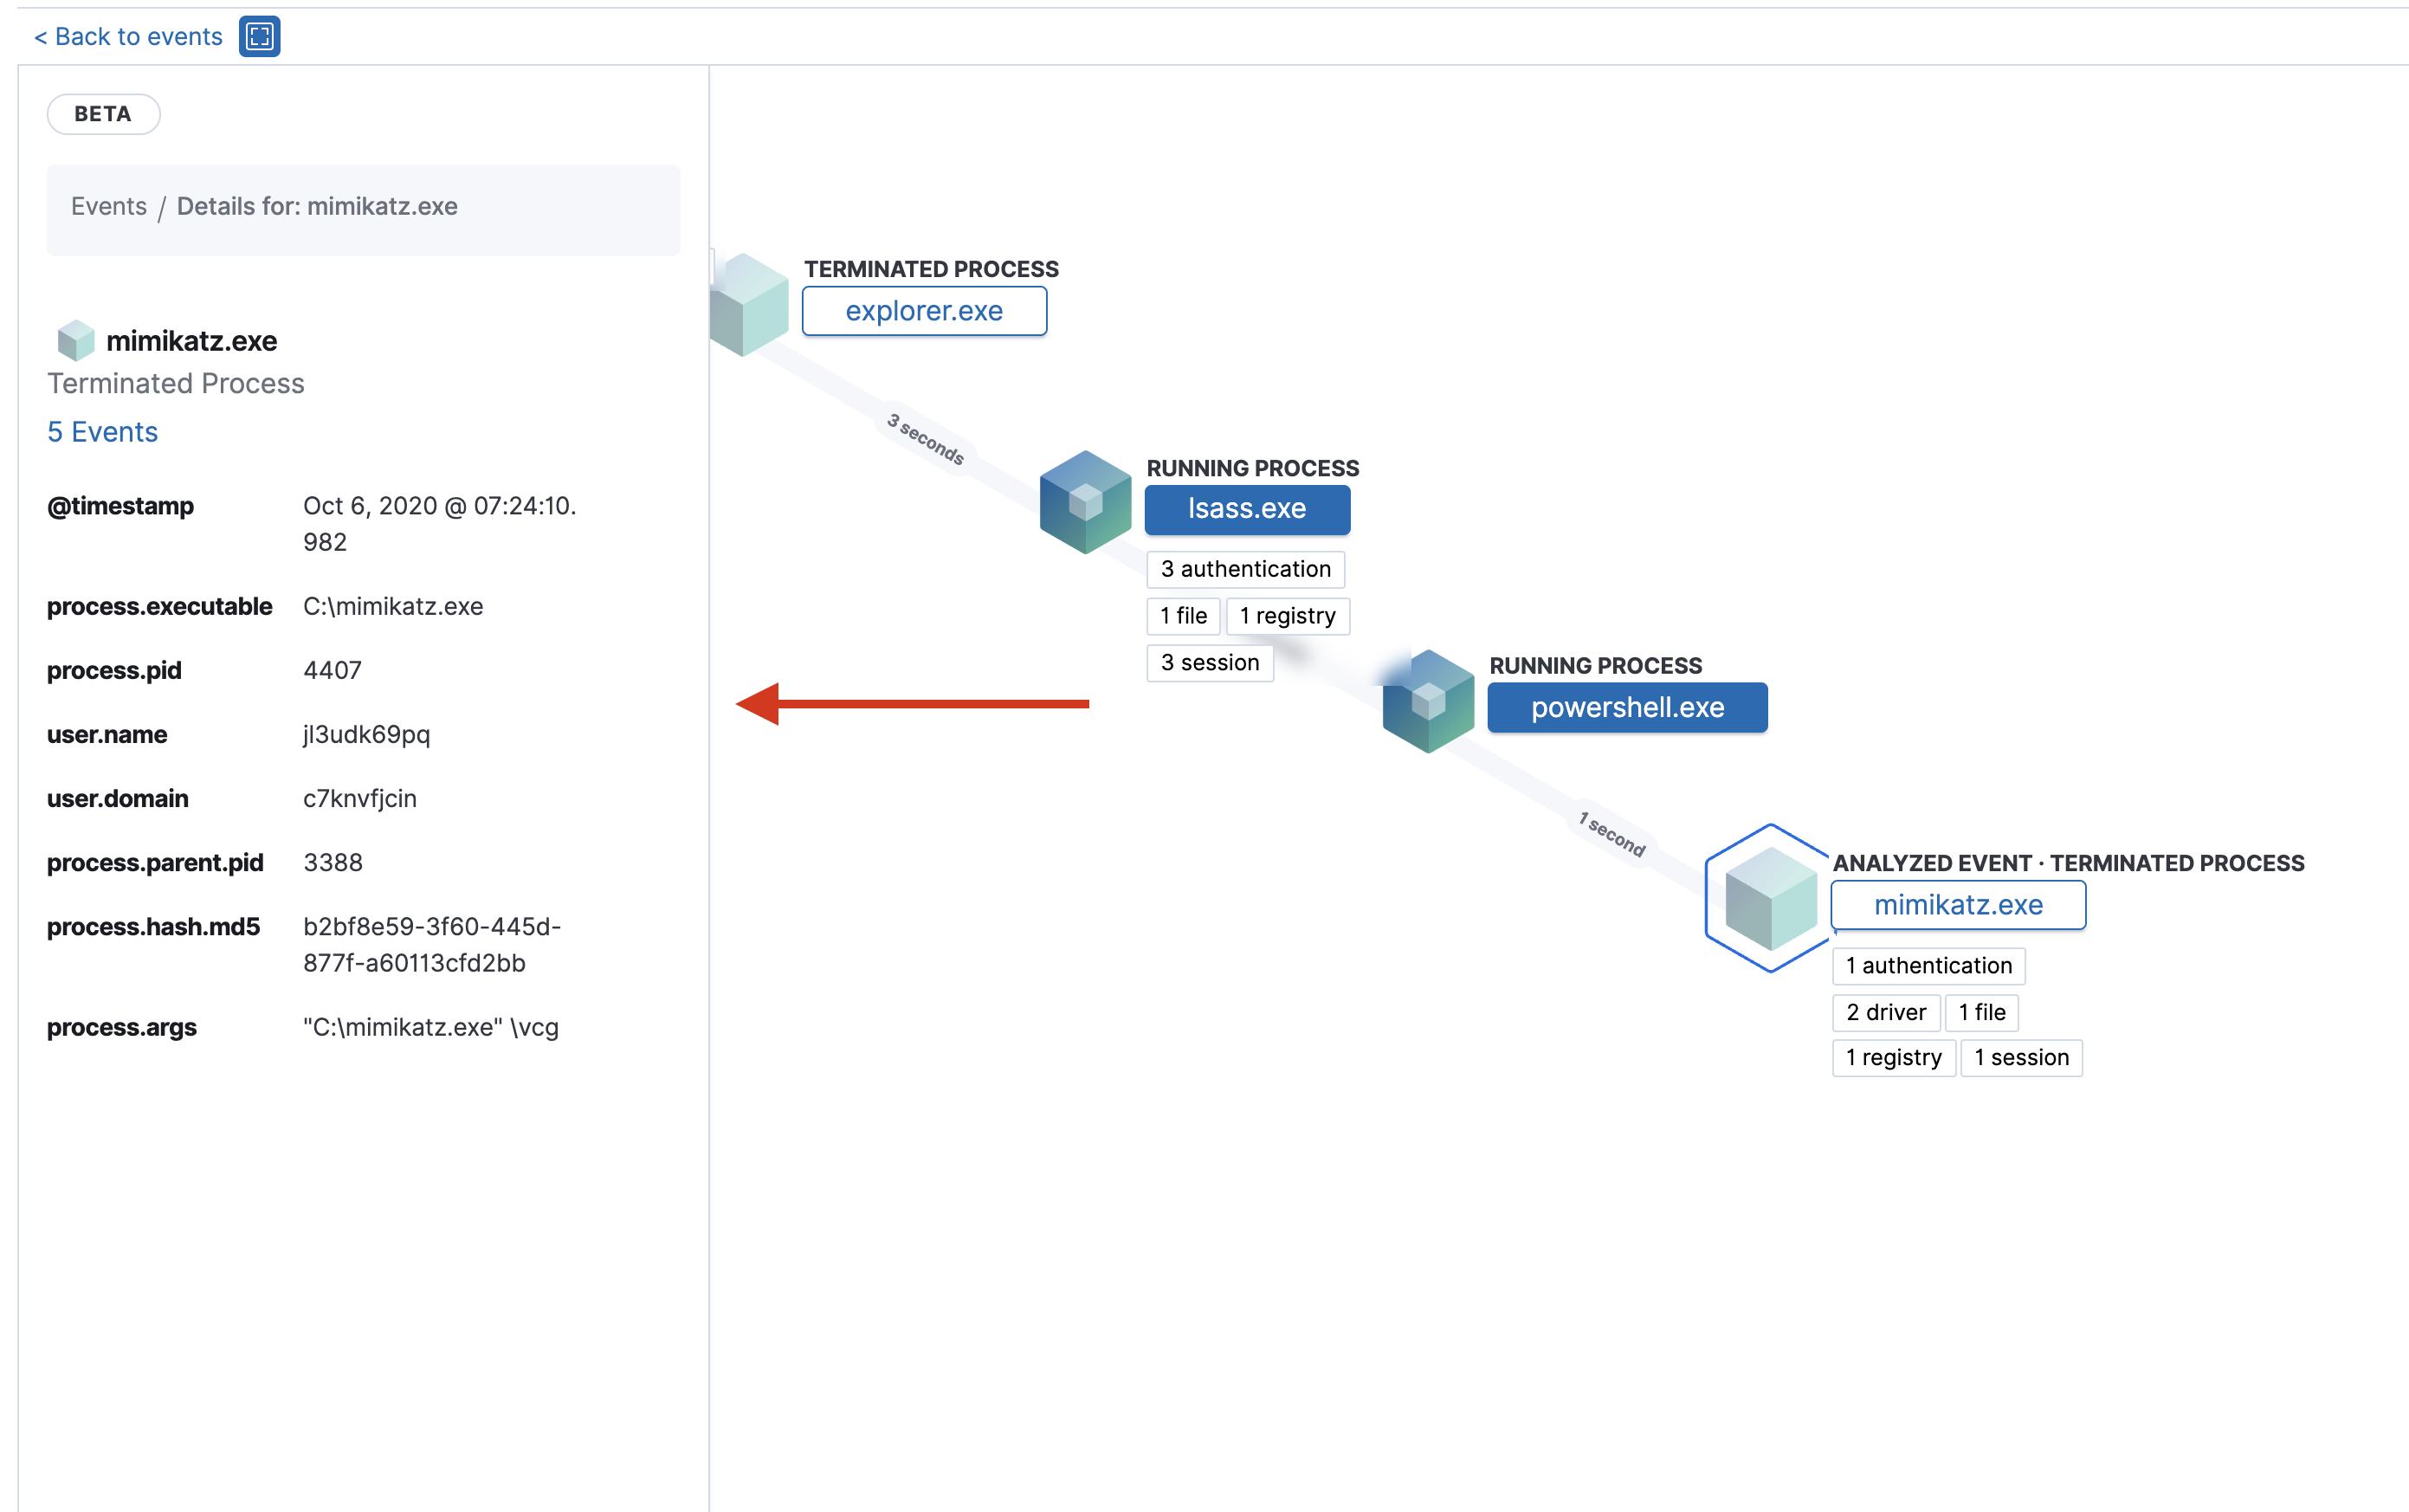
For further investigation of the relationship between processes and events, users can:
- Zoom in and out of the timeline view using the slider to the right of the timeline.
- See the time passed between each node.