Visual event analyzer
editVisual event analyzer
editElastic Security allows any event detected by Elastic Endpoint to be analyzed using a process-based visual analyzer. This enables security analysts to drill down into all related hosts, processes, and other events to aid in their investigations.
Find events to analyze
editYou can only visualize events triggered by hosts configured with the Elastic Endpoint Security Integration. In KQL, this translates to any event with the agent.type set to endpoint.
To access events that can be visually analyzed:
- In Elastic Security, select Hosts > Events. A list of all your host’s events appears in the bottom panel of the host’s view.
-
Create a KQL query that filters all
endpointdetected events by enteringagent.type: endpoint and process.entity_id : *into the KQL search bar, and then select Update.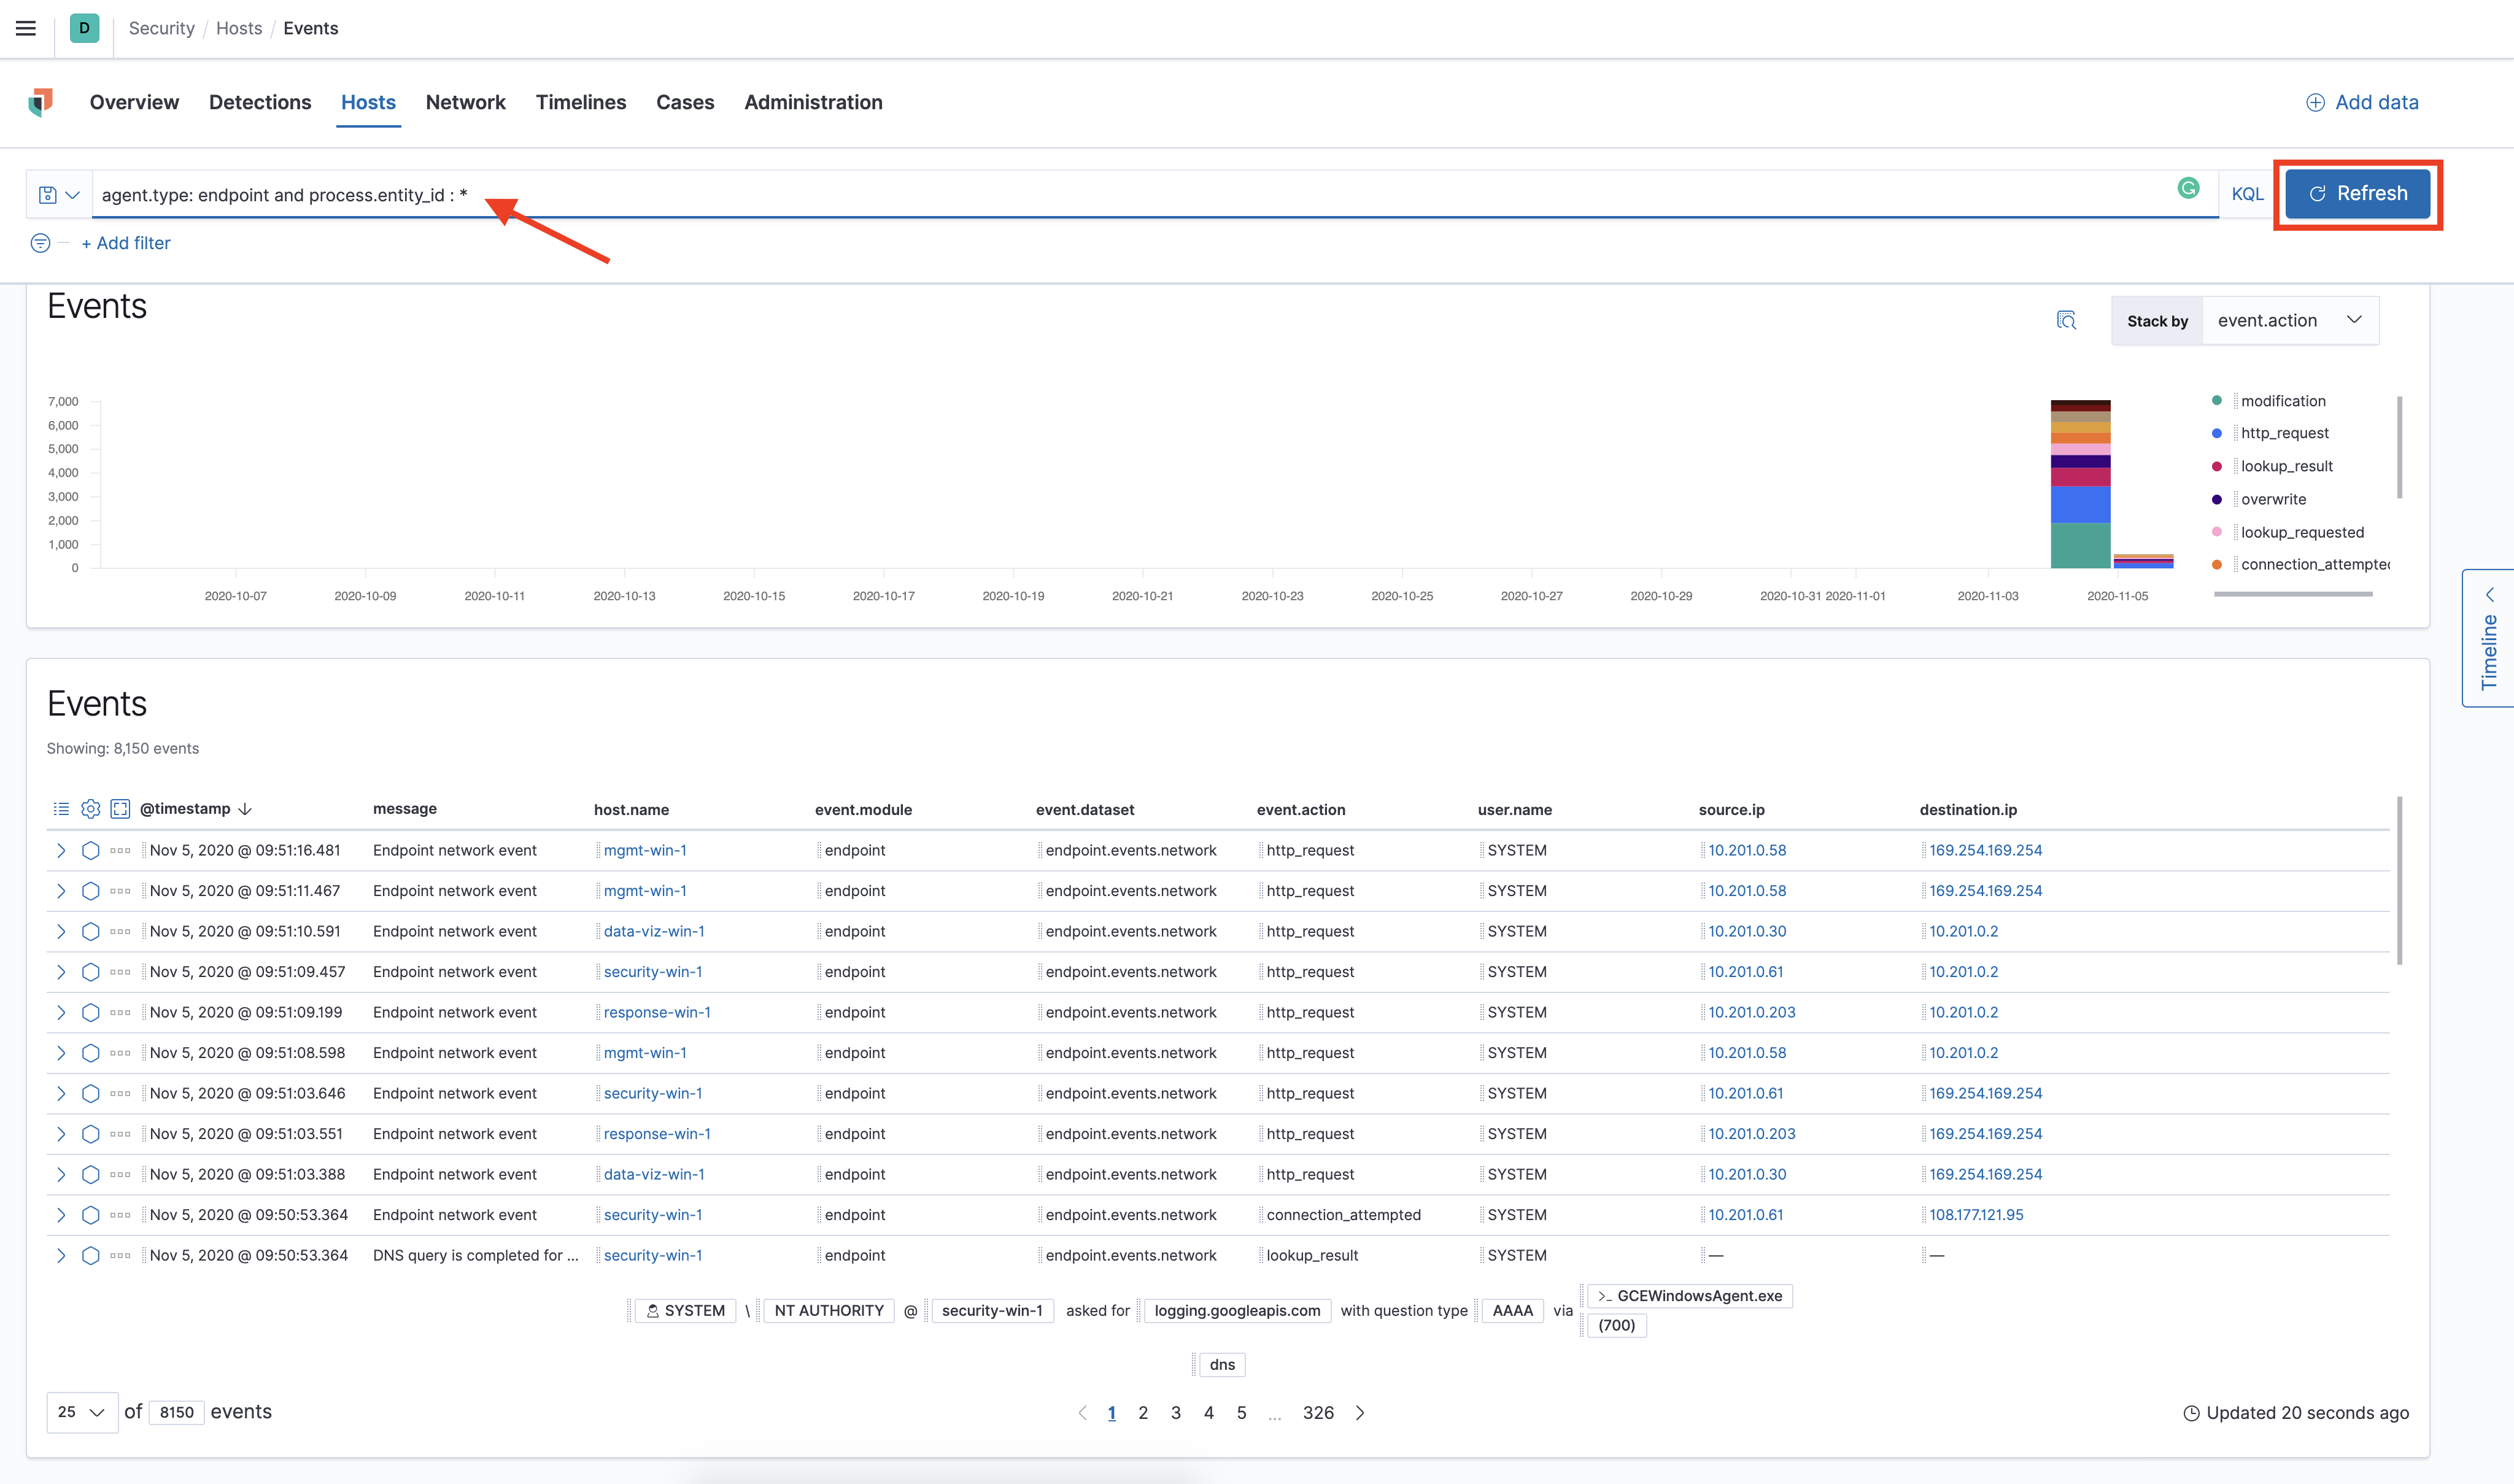
A list of all
endpointrelated events appears. -
Select the Analyze Event icon next to the event you want to analyze.
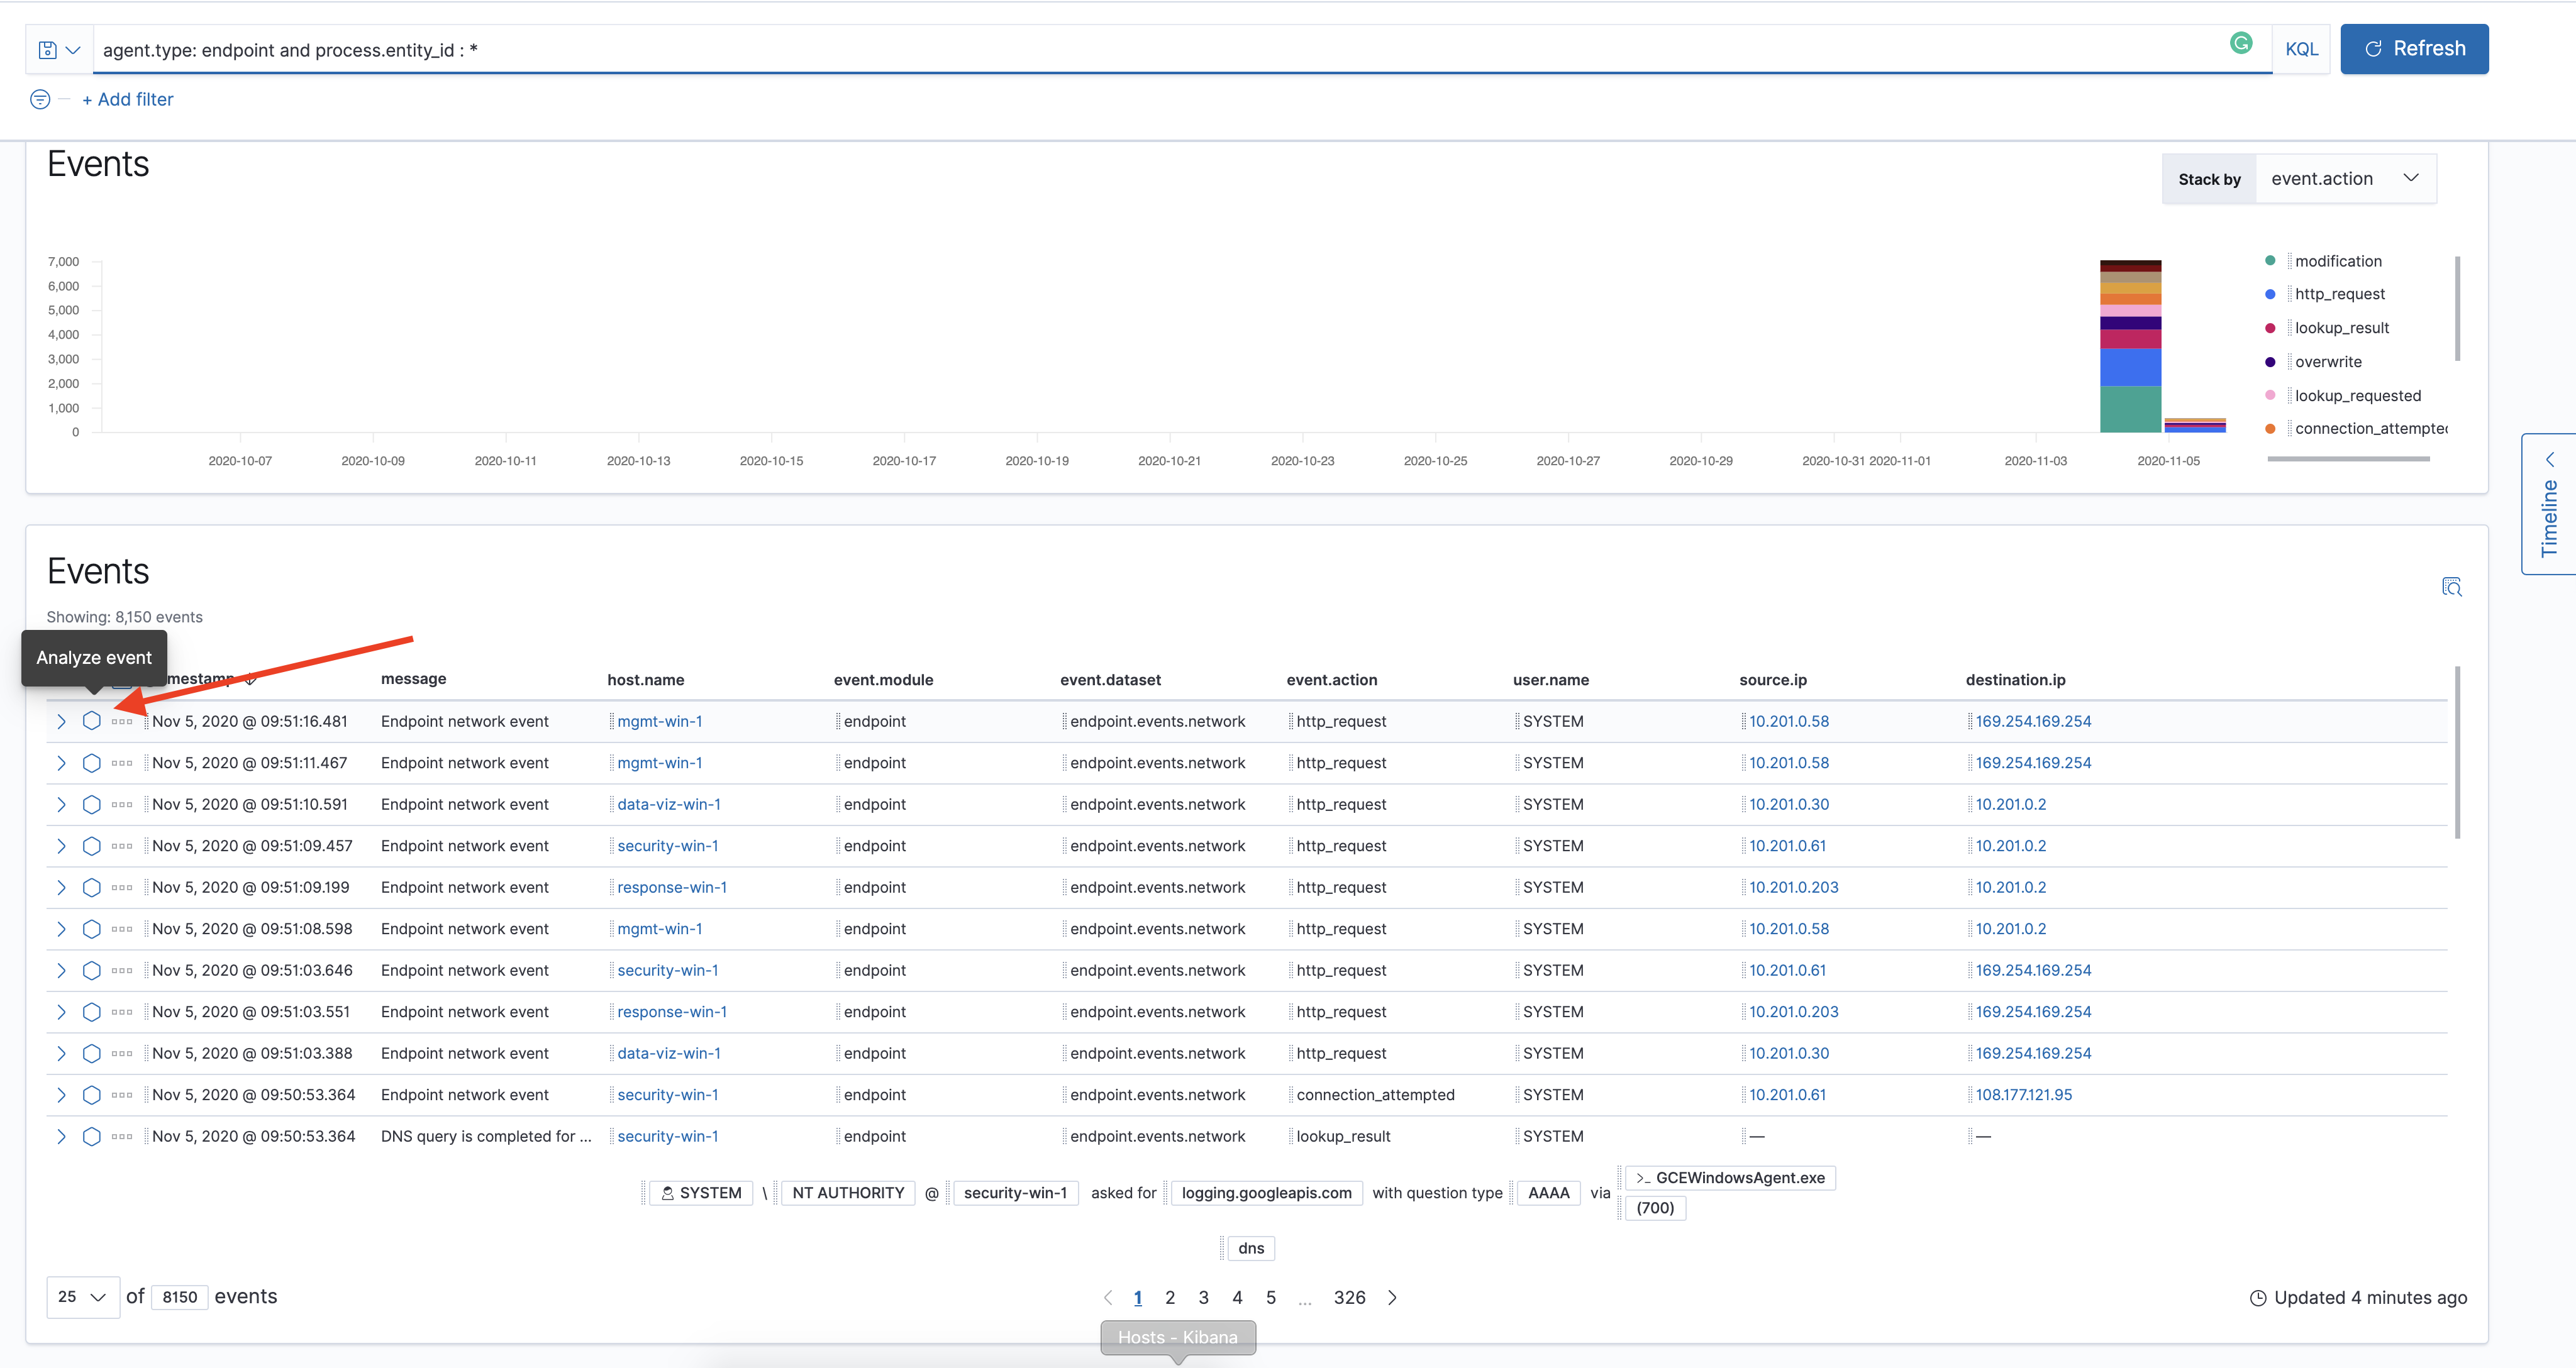
The visual Analyzer view appears.
You can also analyze events from Timelines
Visual event analyzer UI
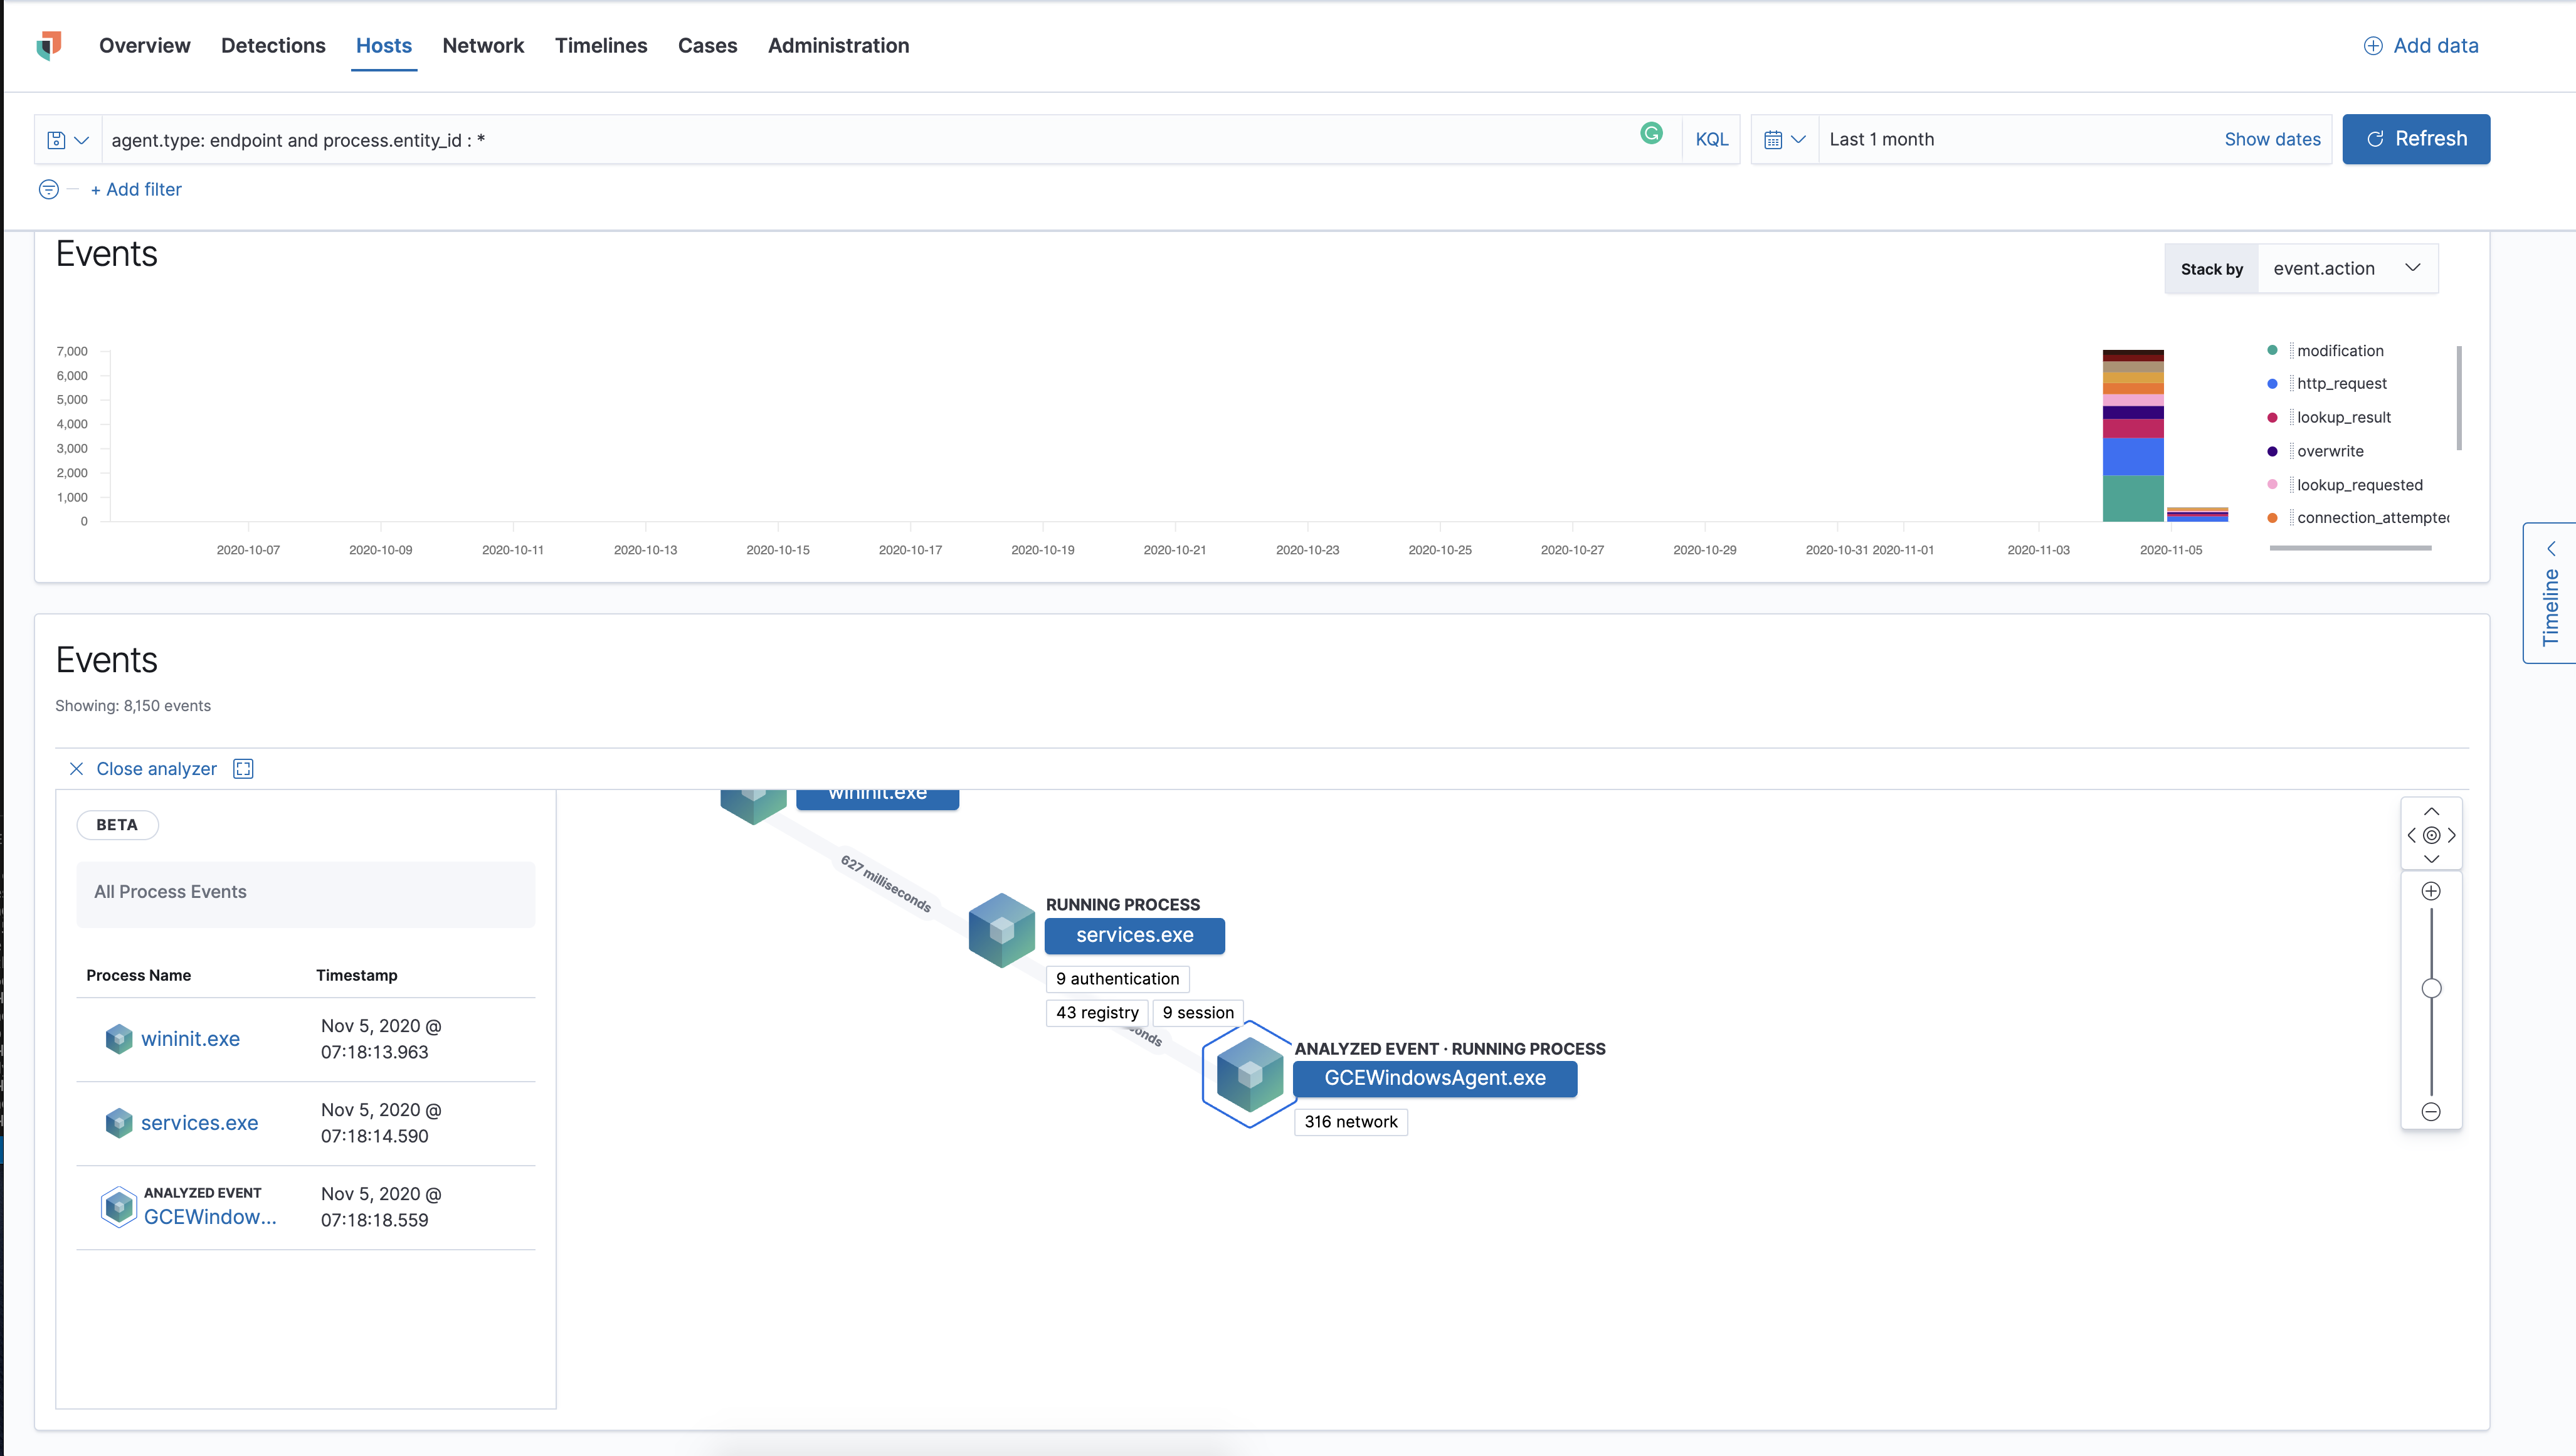
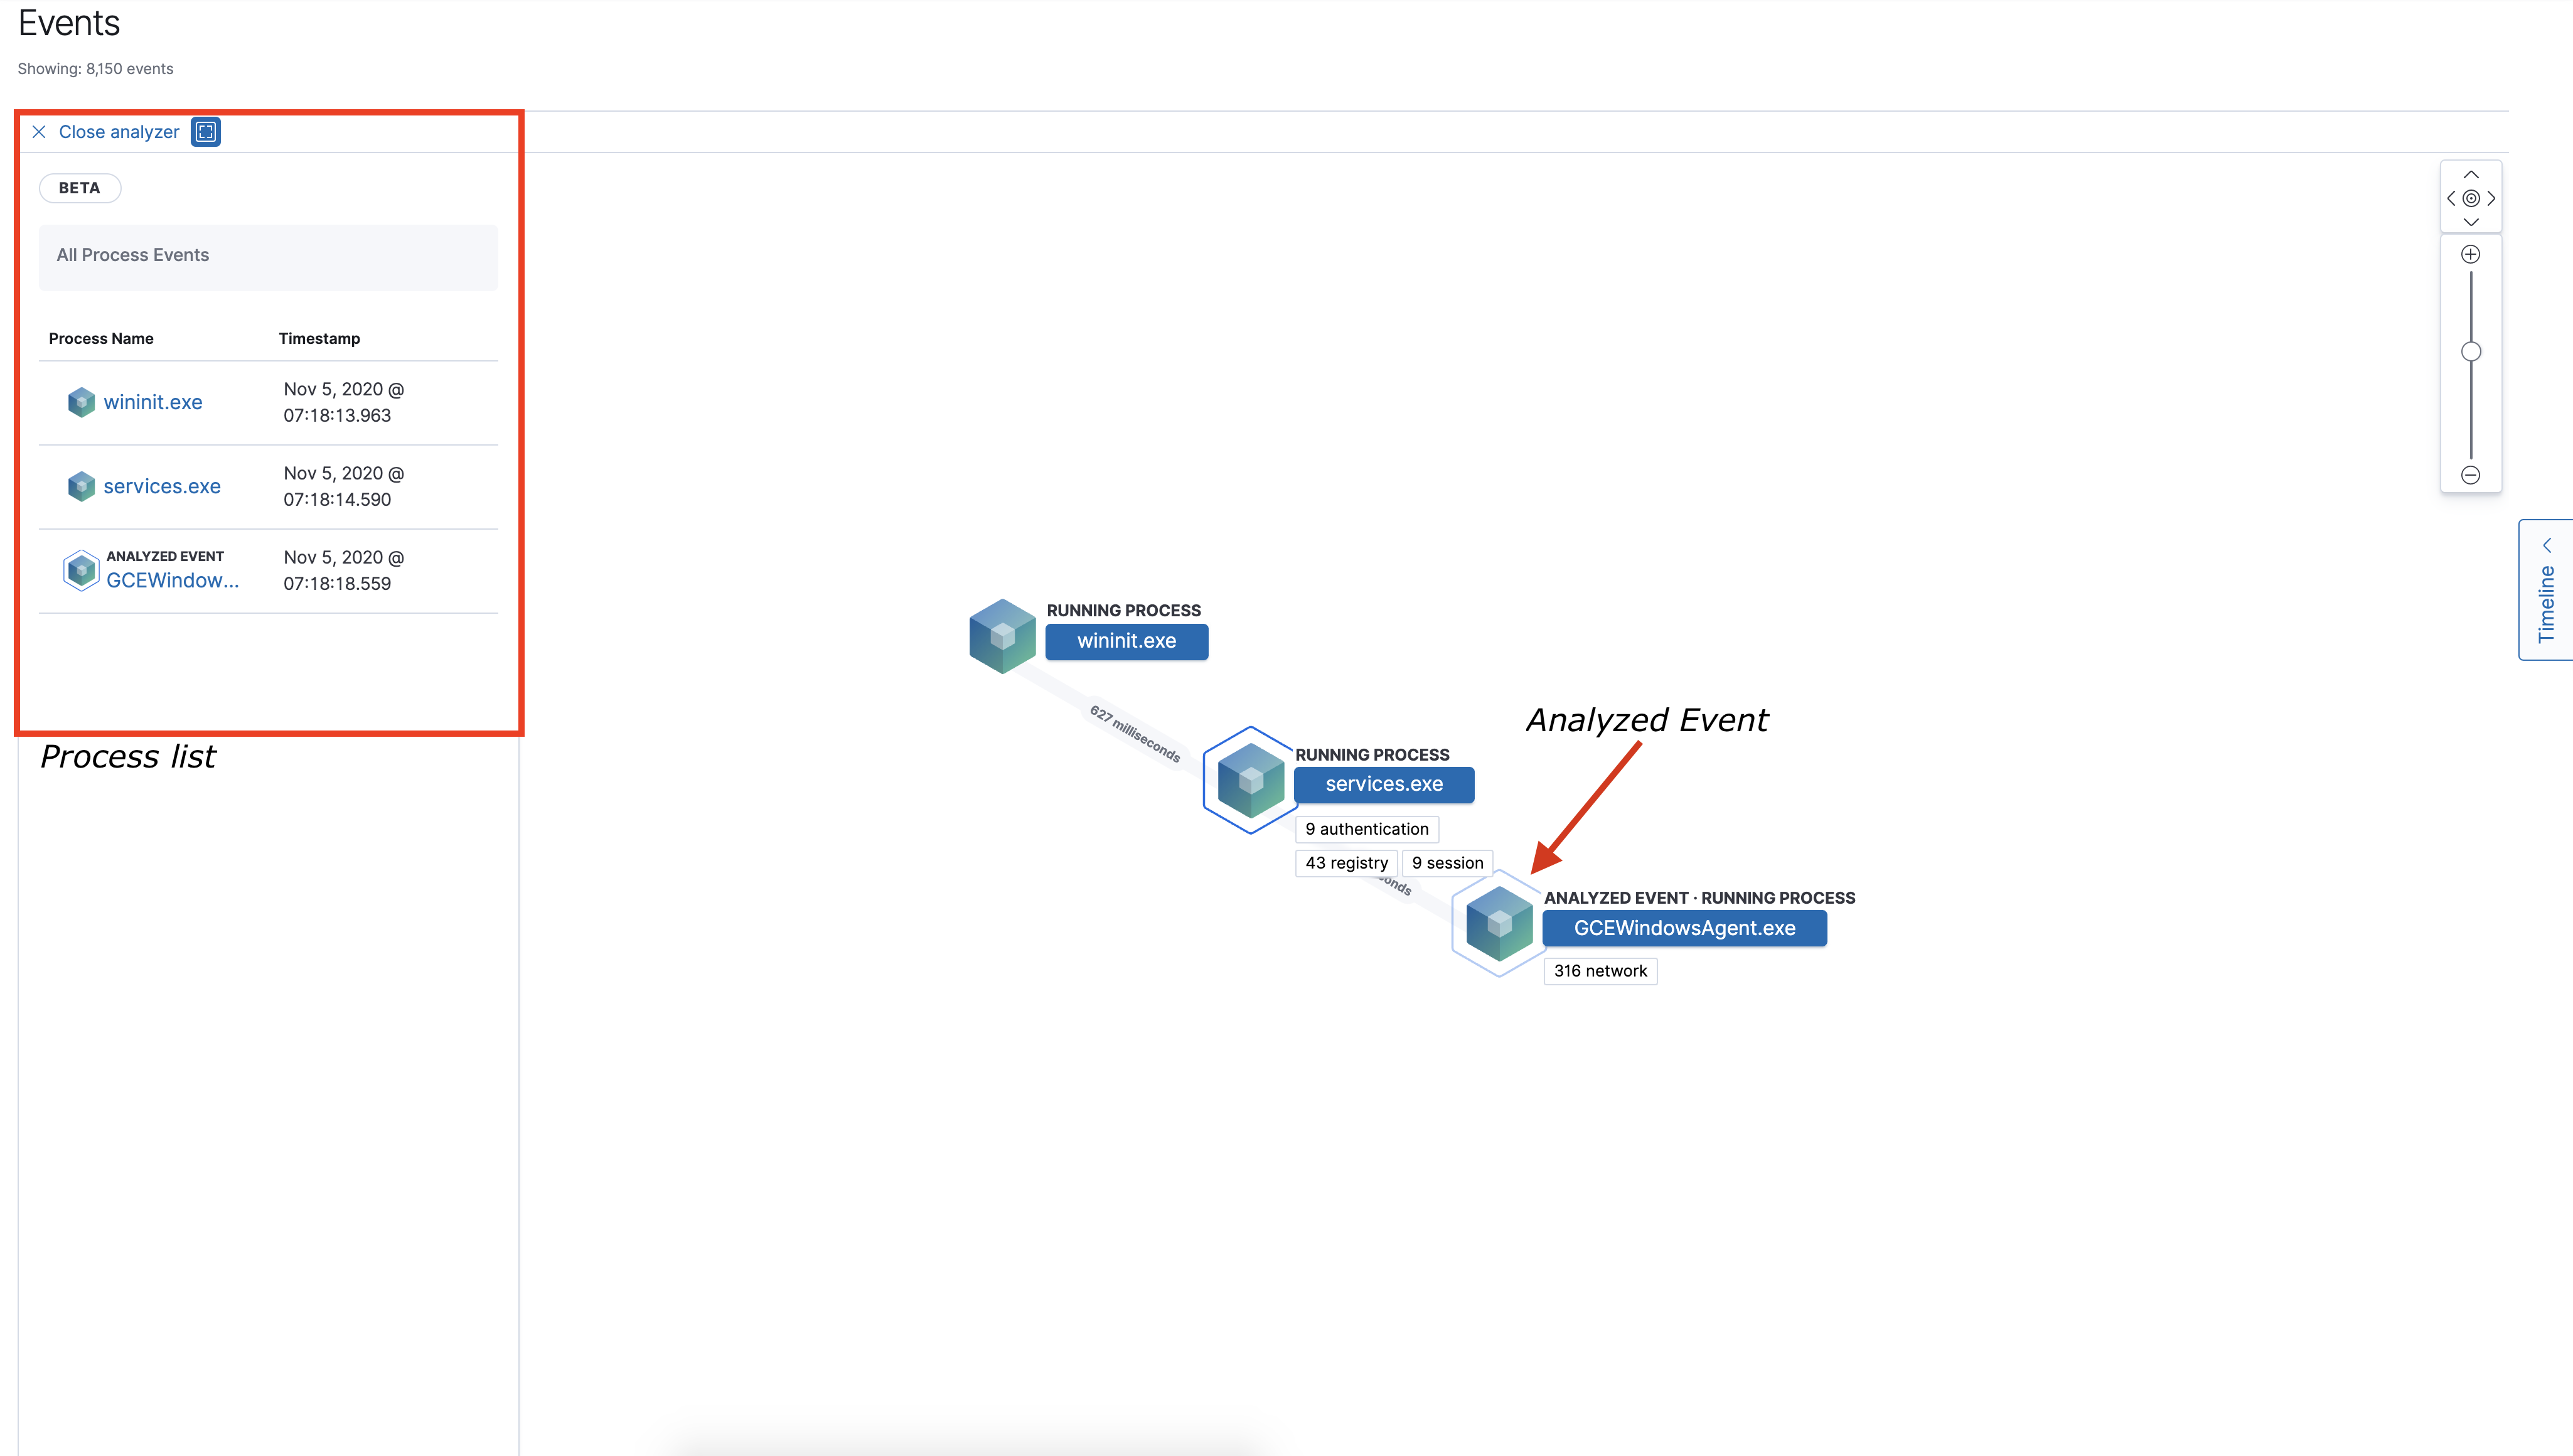
editInside the visual analyzer, each cube represents a process (i.e. an executable file or network event). Click and drag in timeline view to see all process relationships.
To make the analyzer full screen, select the Full Screen icon above the left-panel.
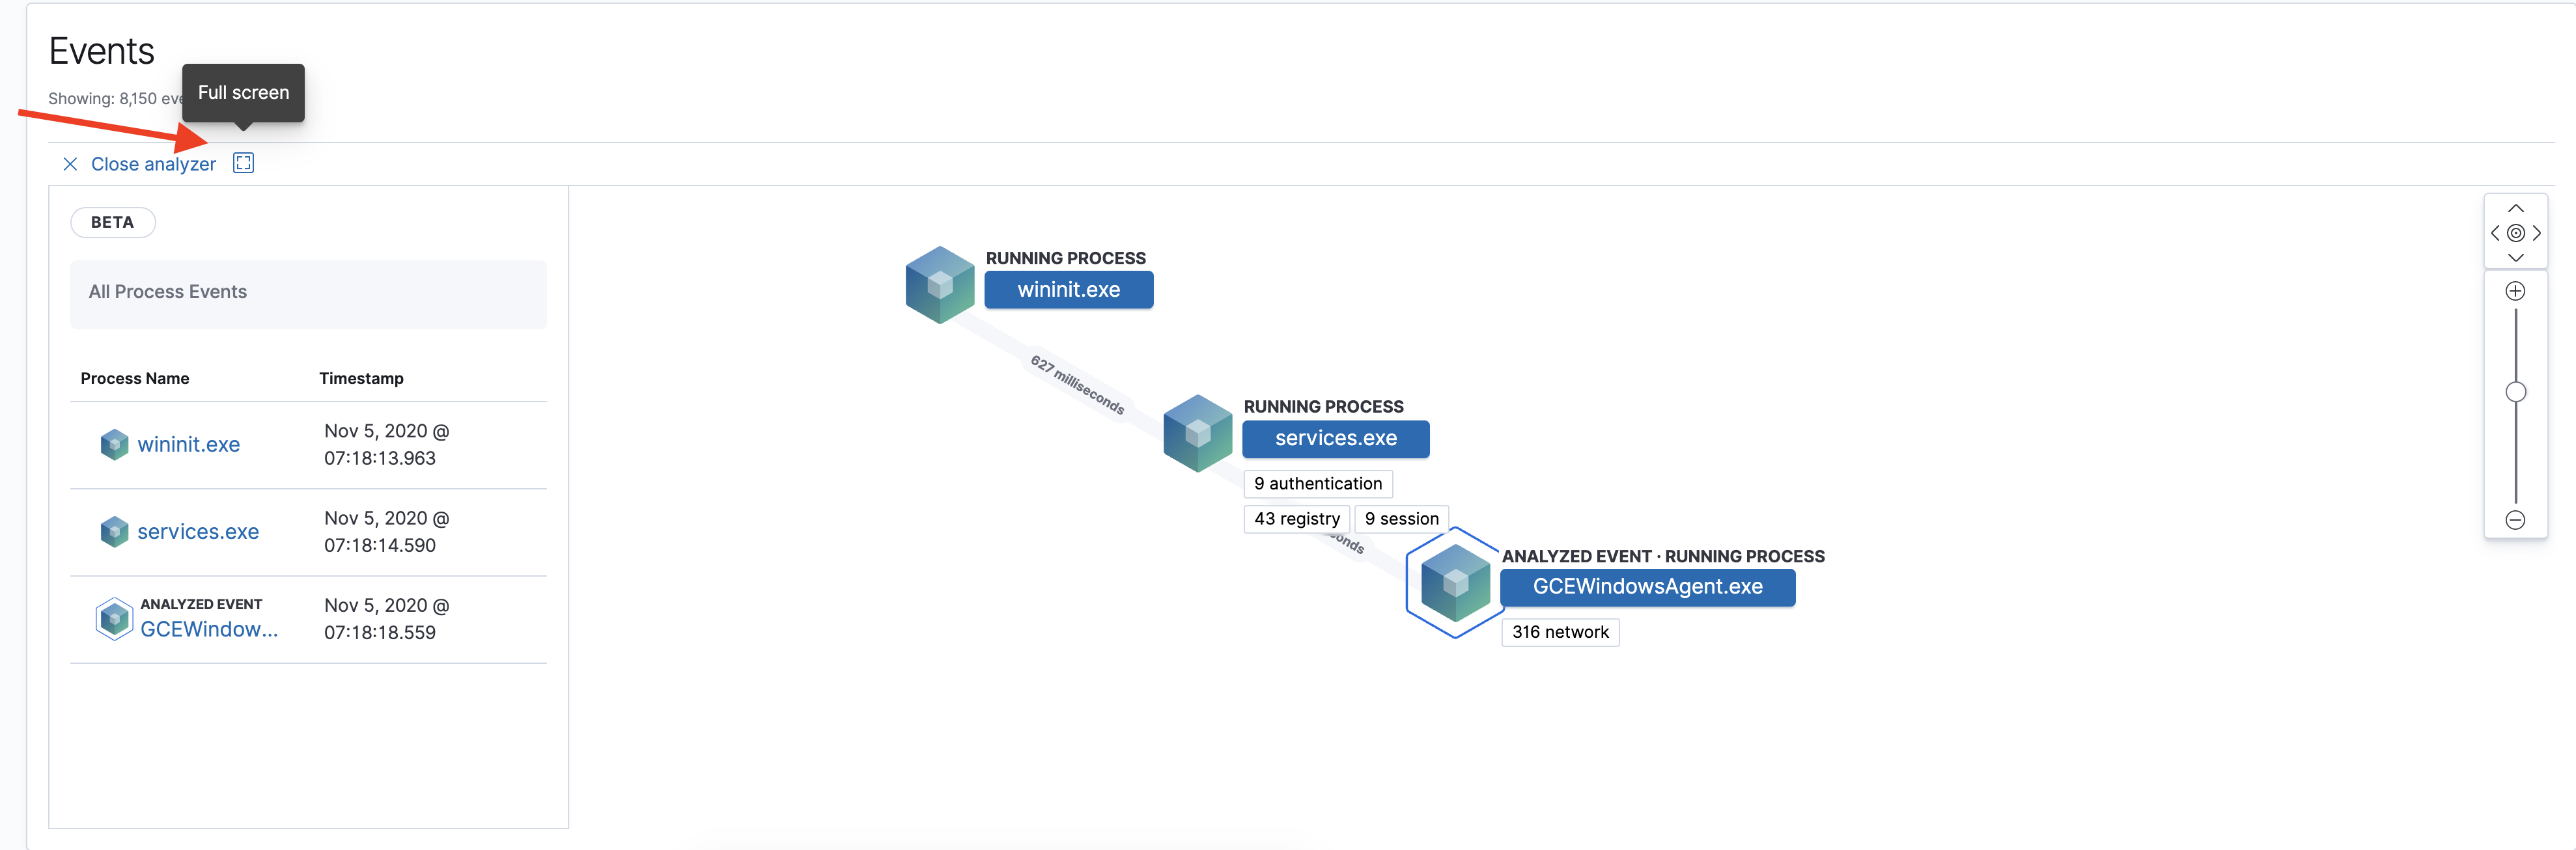
The left panel contains a list of all processes related to the event, starting with the event chain’s first process. Analyzed Events, as in the event you selected to analyze from either the events list or your timeline, are highlighted by a light blue outline around the cube.
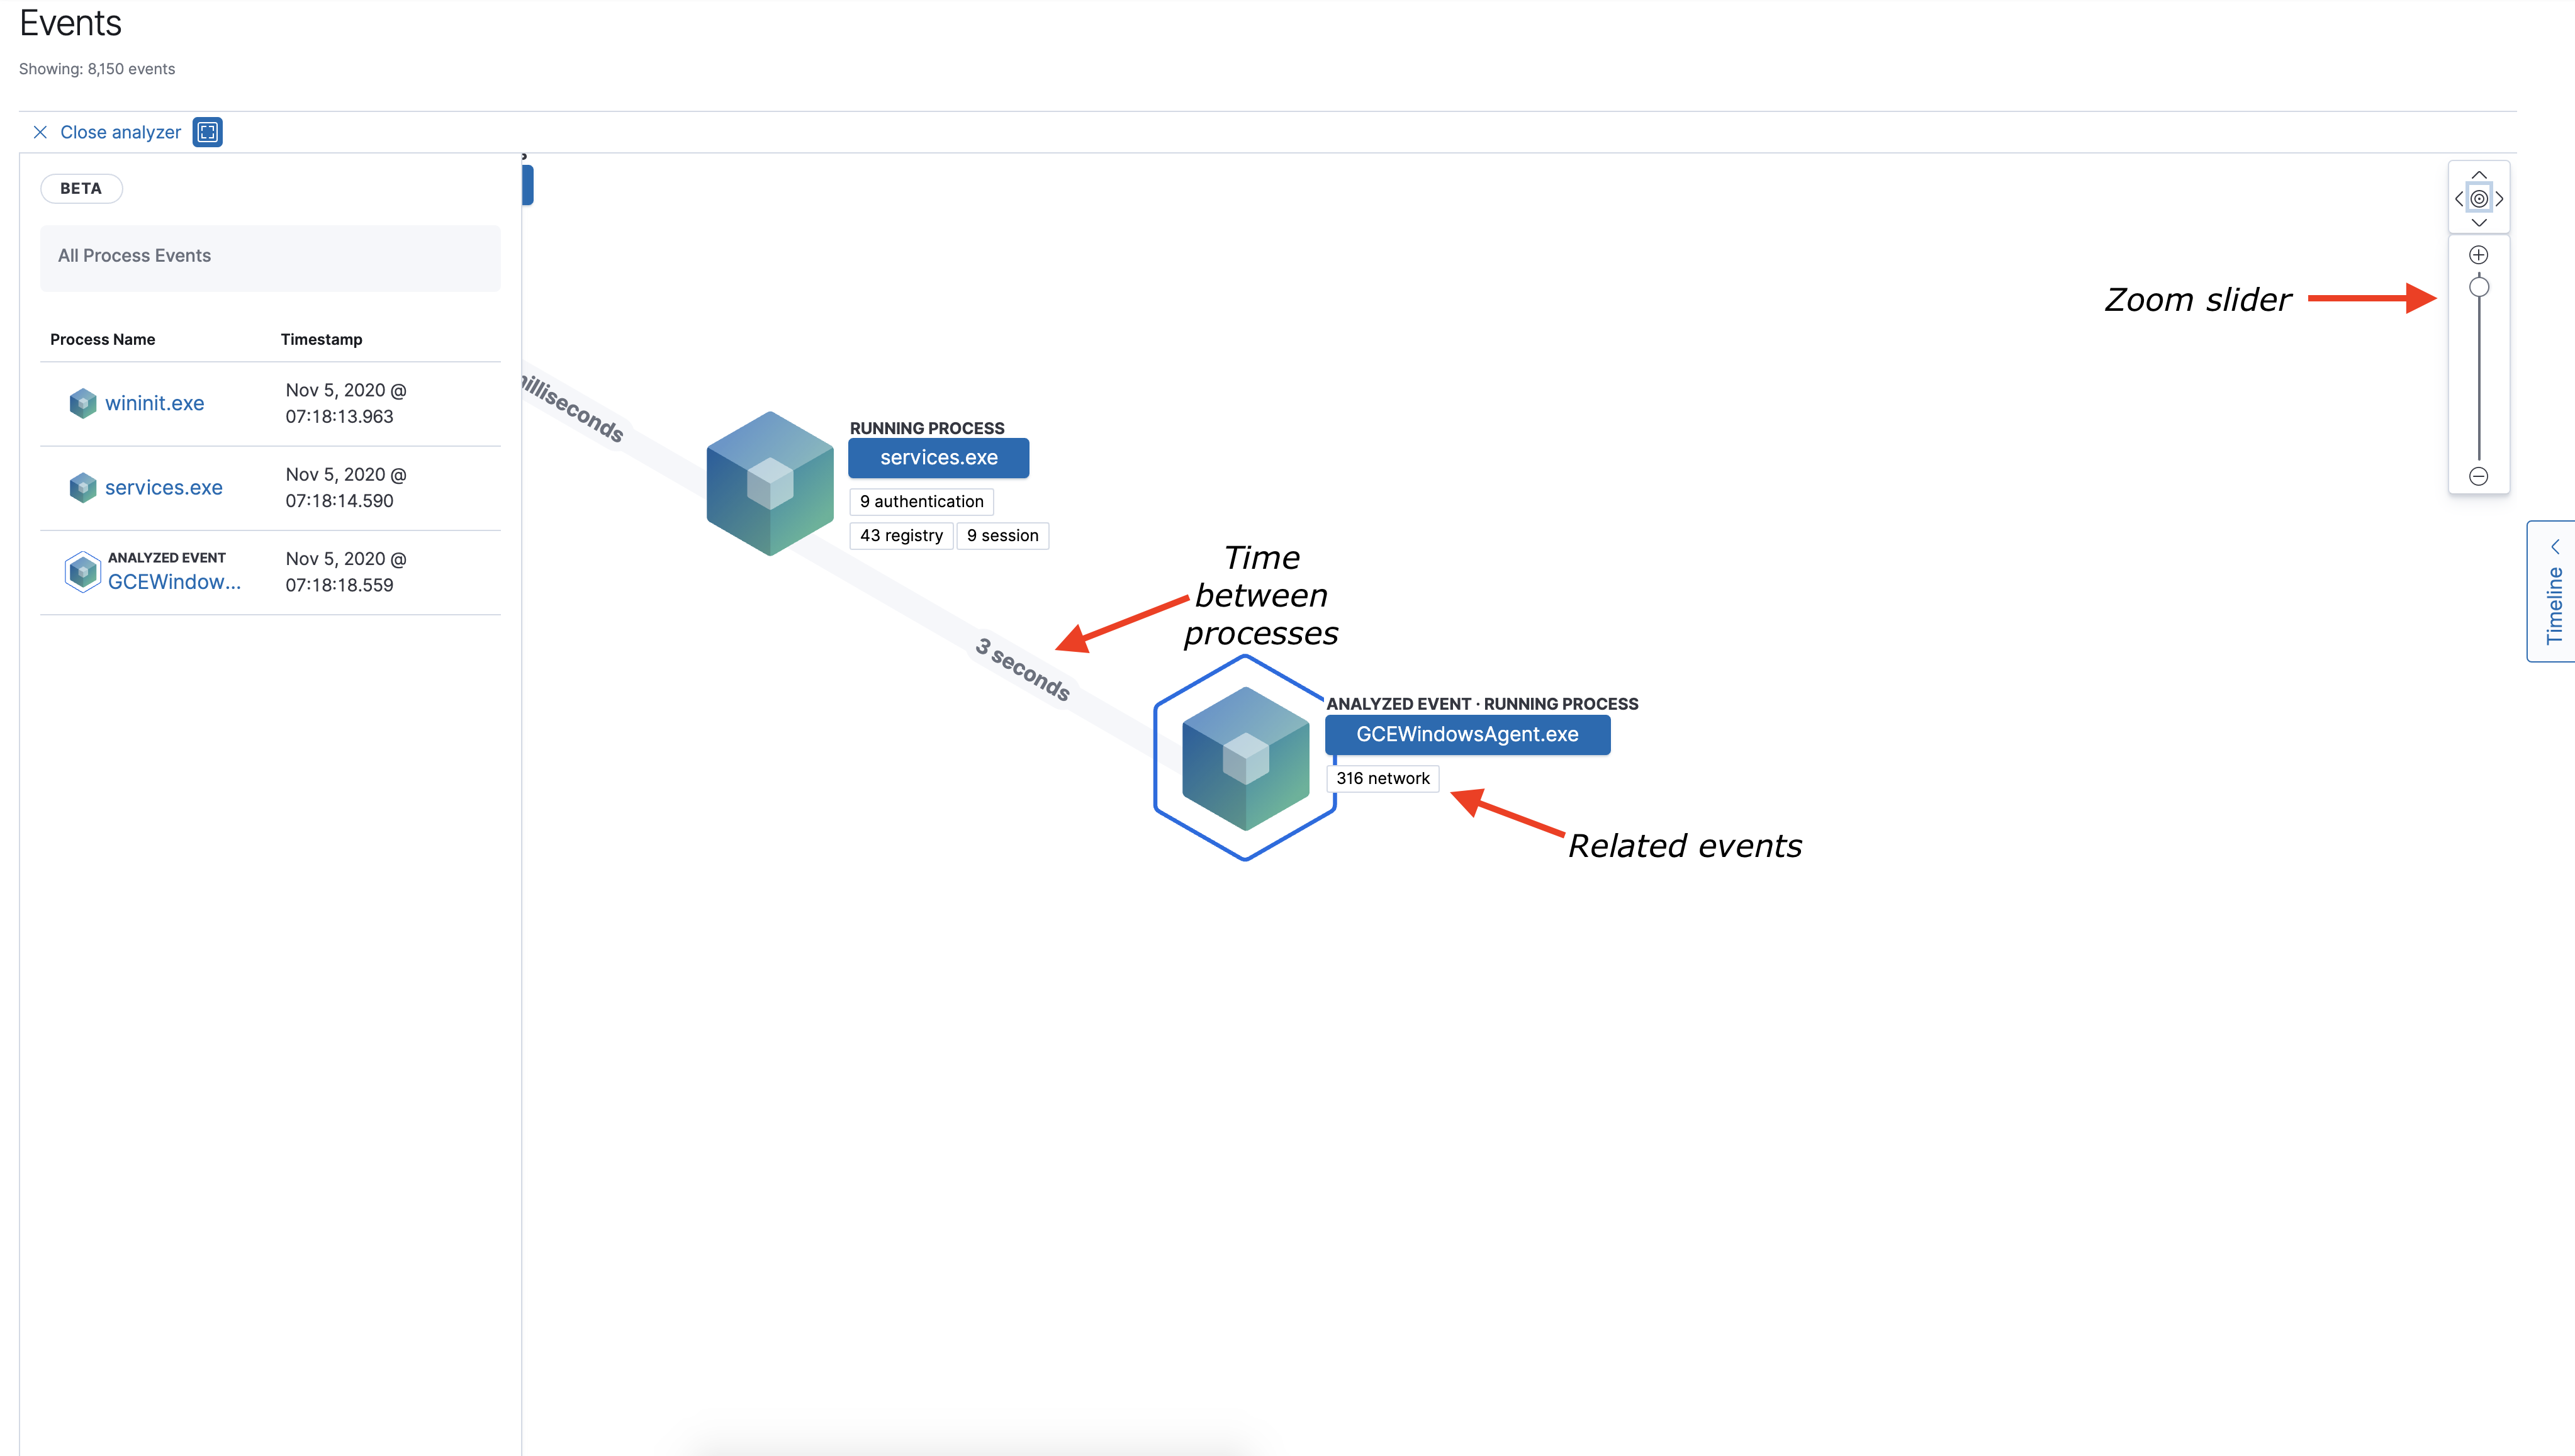
In the graphical view, you can:
- Zoom in and out of the graphical view using the slider to the right of the timeline.
- Click and drag around the graphical view to more process relationships.
- See the time passed between each process.
- See all events related to each process.
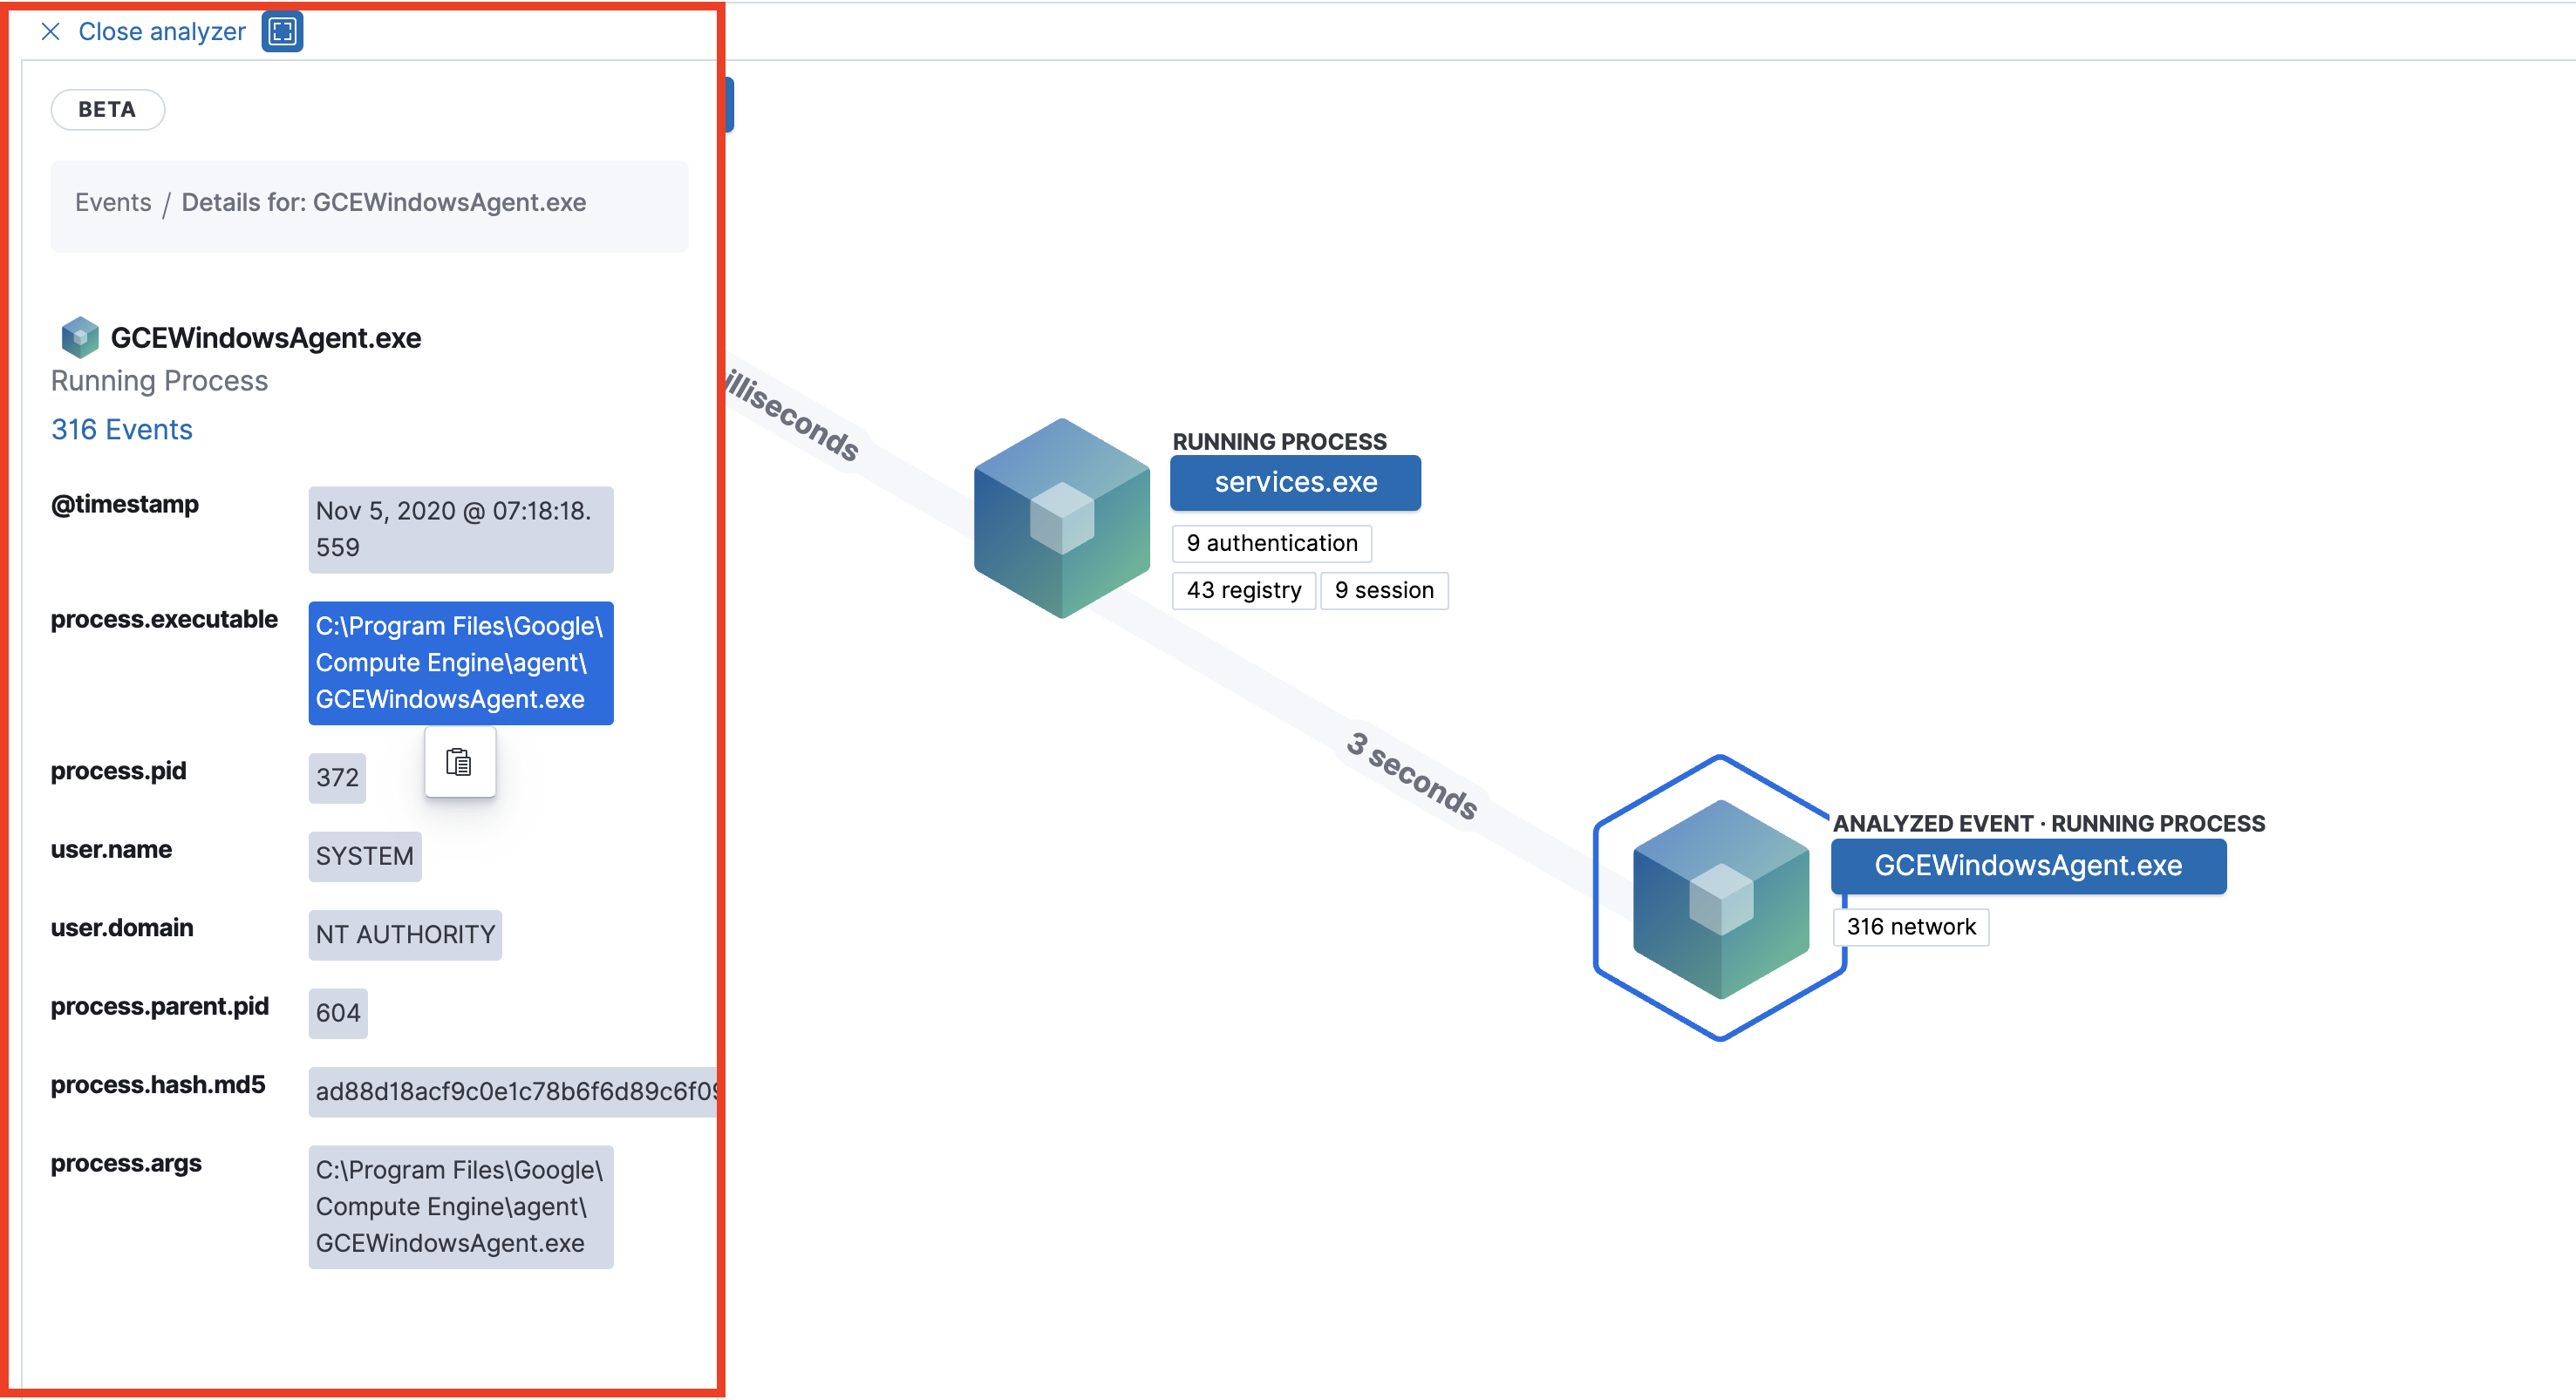
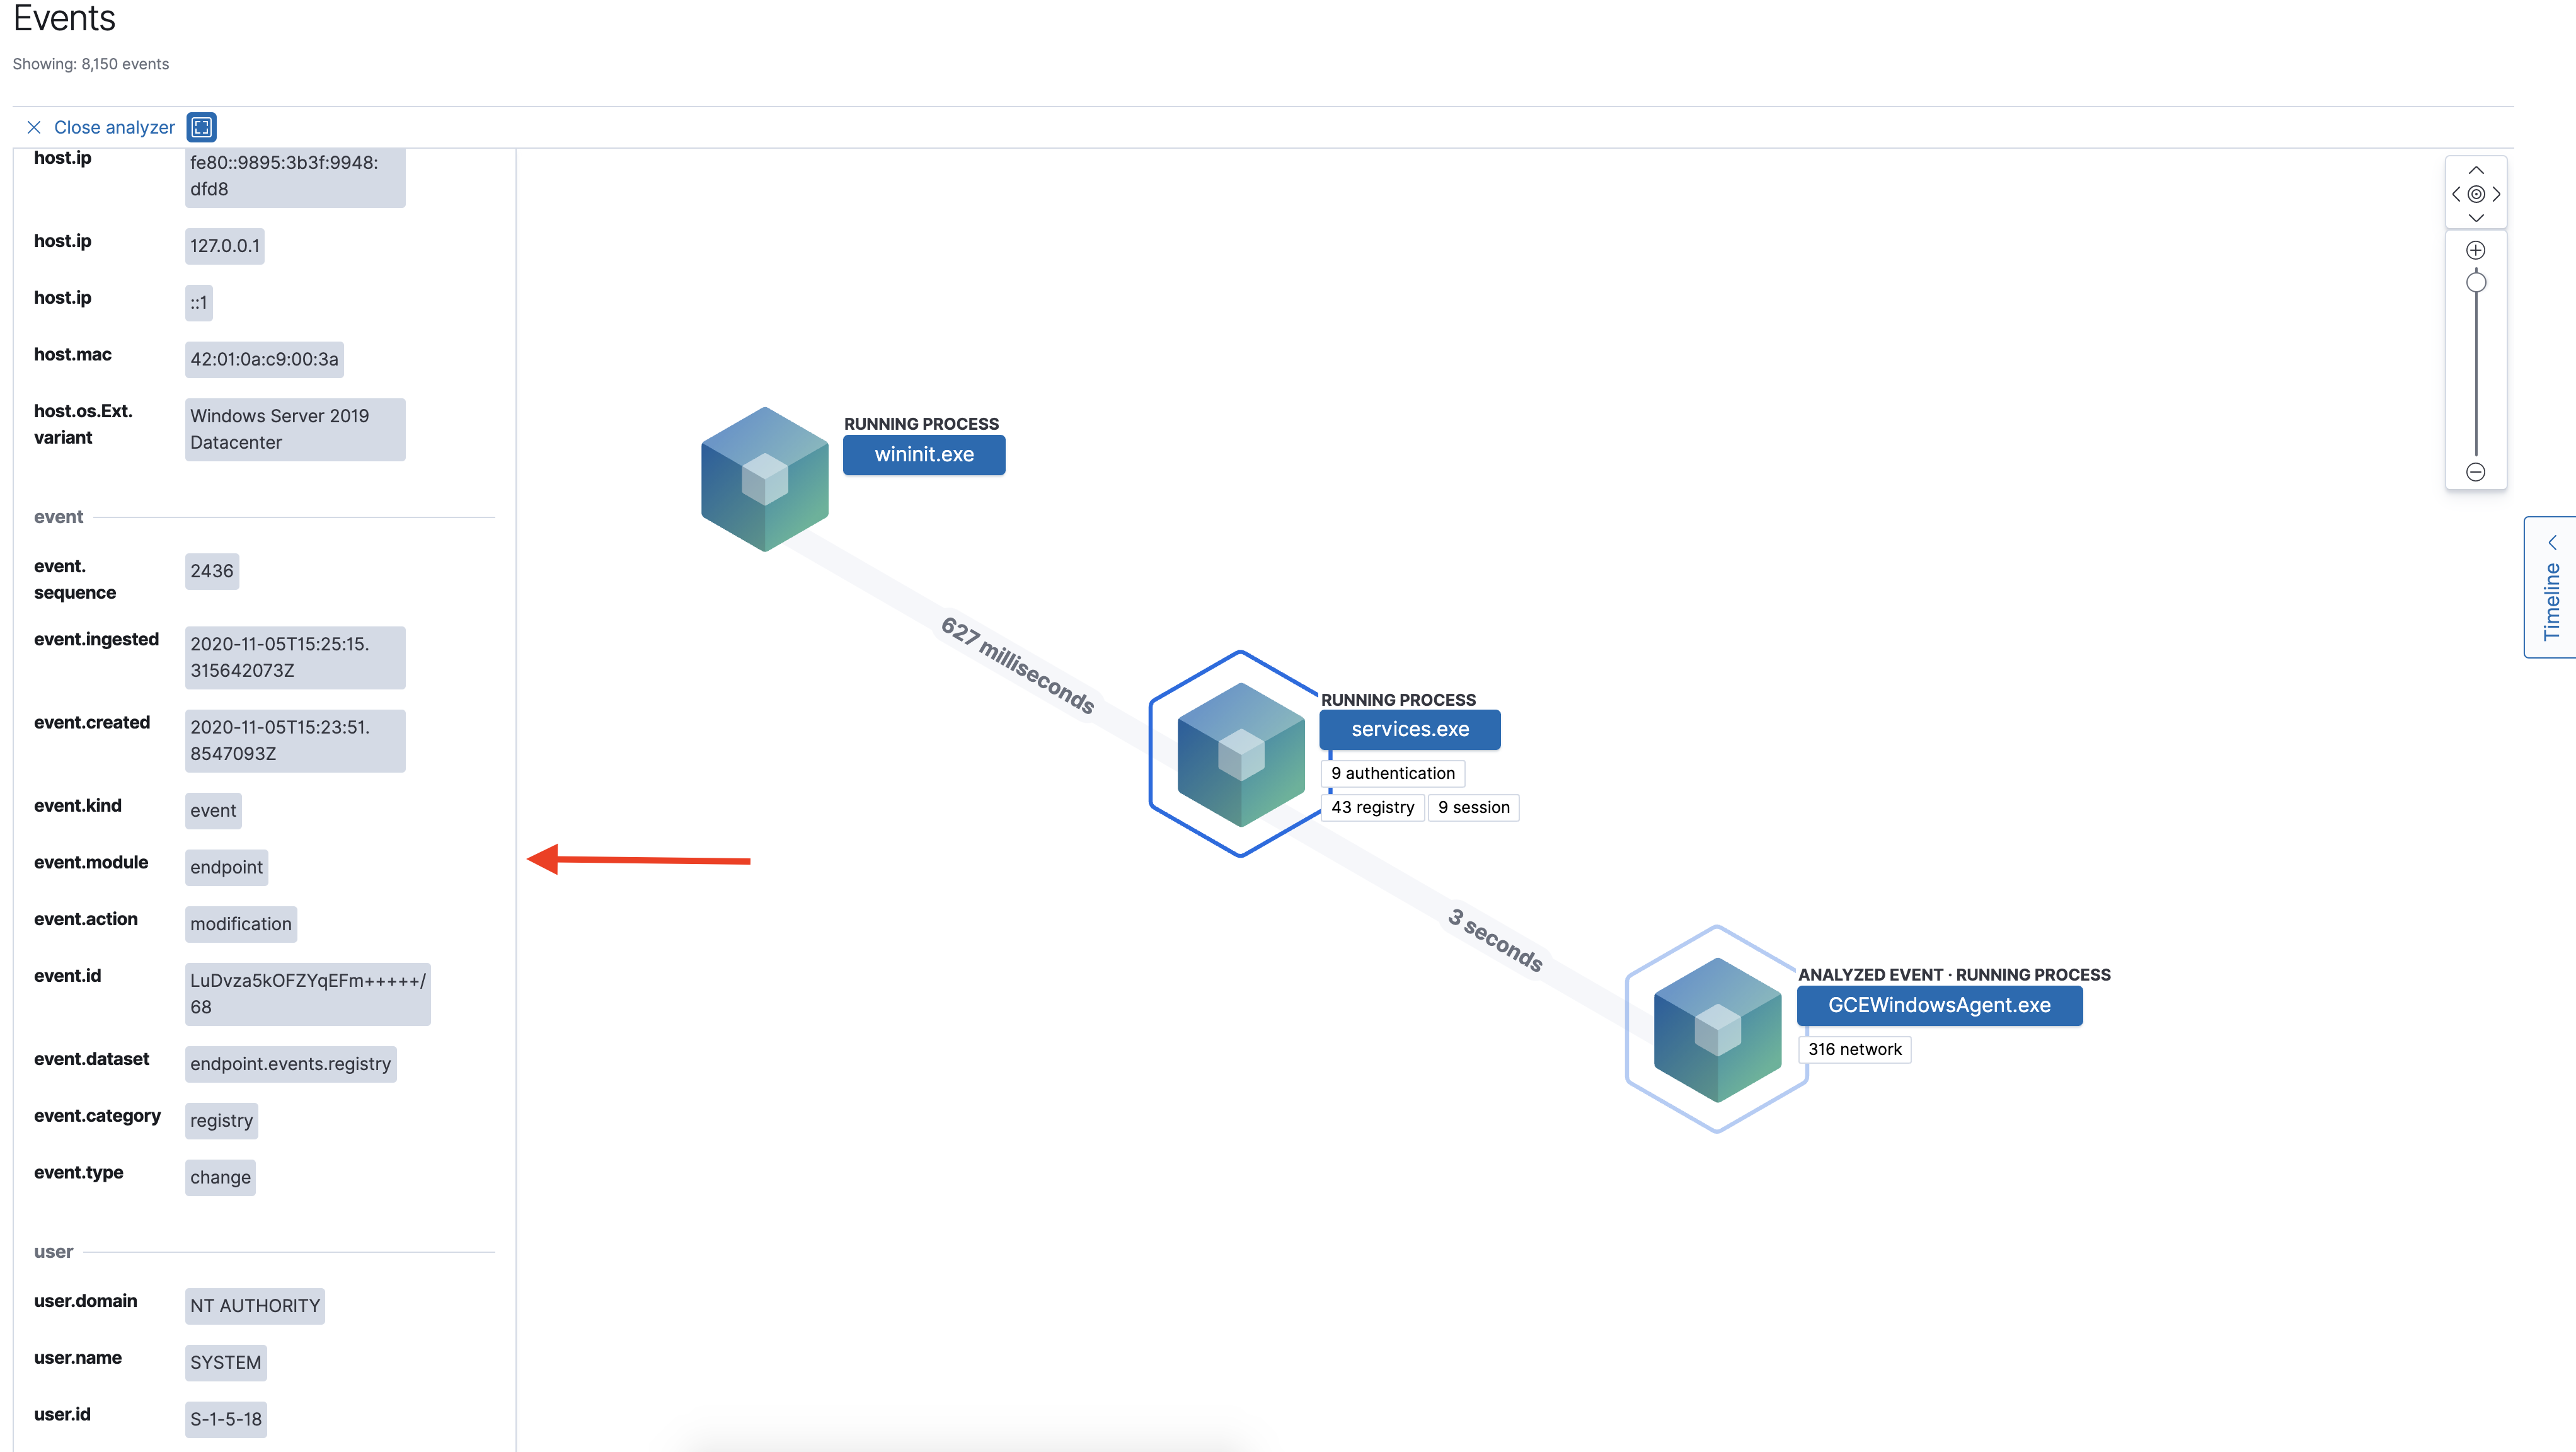
Process and event details
editTo see more details about each related process, select the process either in the left panel or the graphical view. The information on the process appears in the left panel, which typically includes but isn’t limited to:
- The number of events associated with the process.
- The timestamp when the process was executed.
- The file path of the process within the host.
-
The
process-pid. - The user name and domain that ran the process.
- Any other relevant process information.
See event details by selecting the # events URL at the top of the process details view or choosing one of the event pills in the graphical view.
Events are categorized based on their event.category.
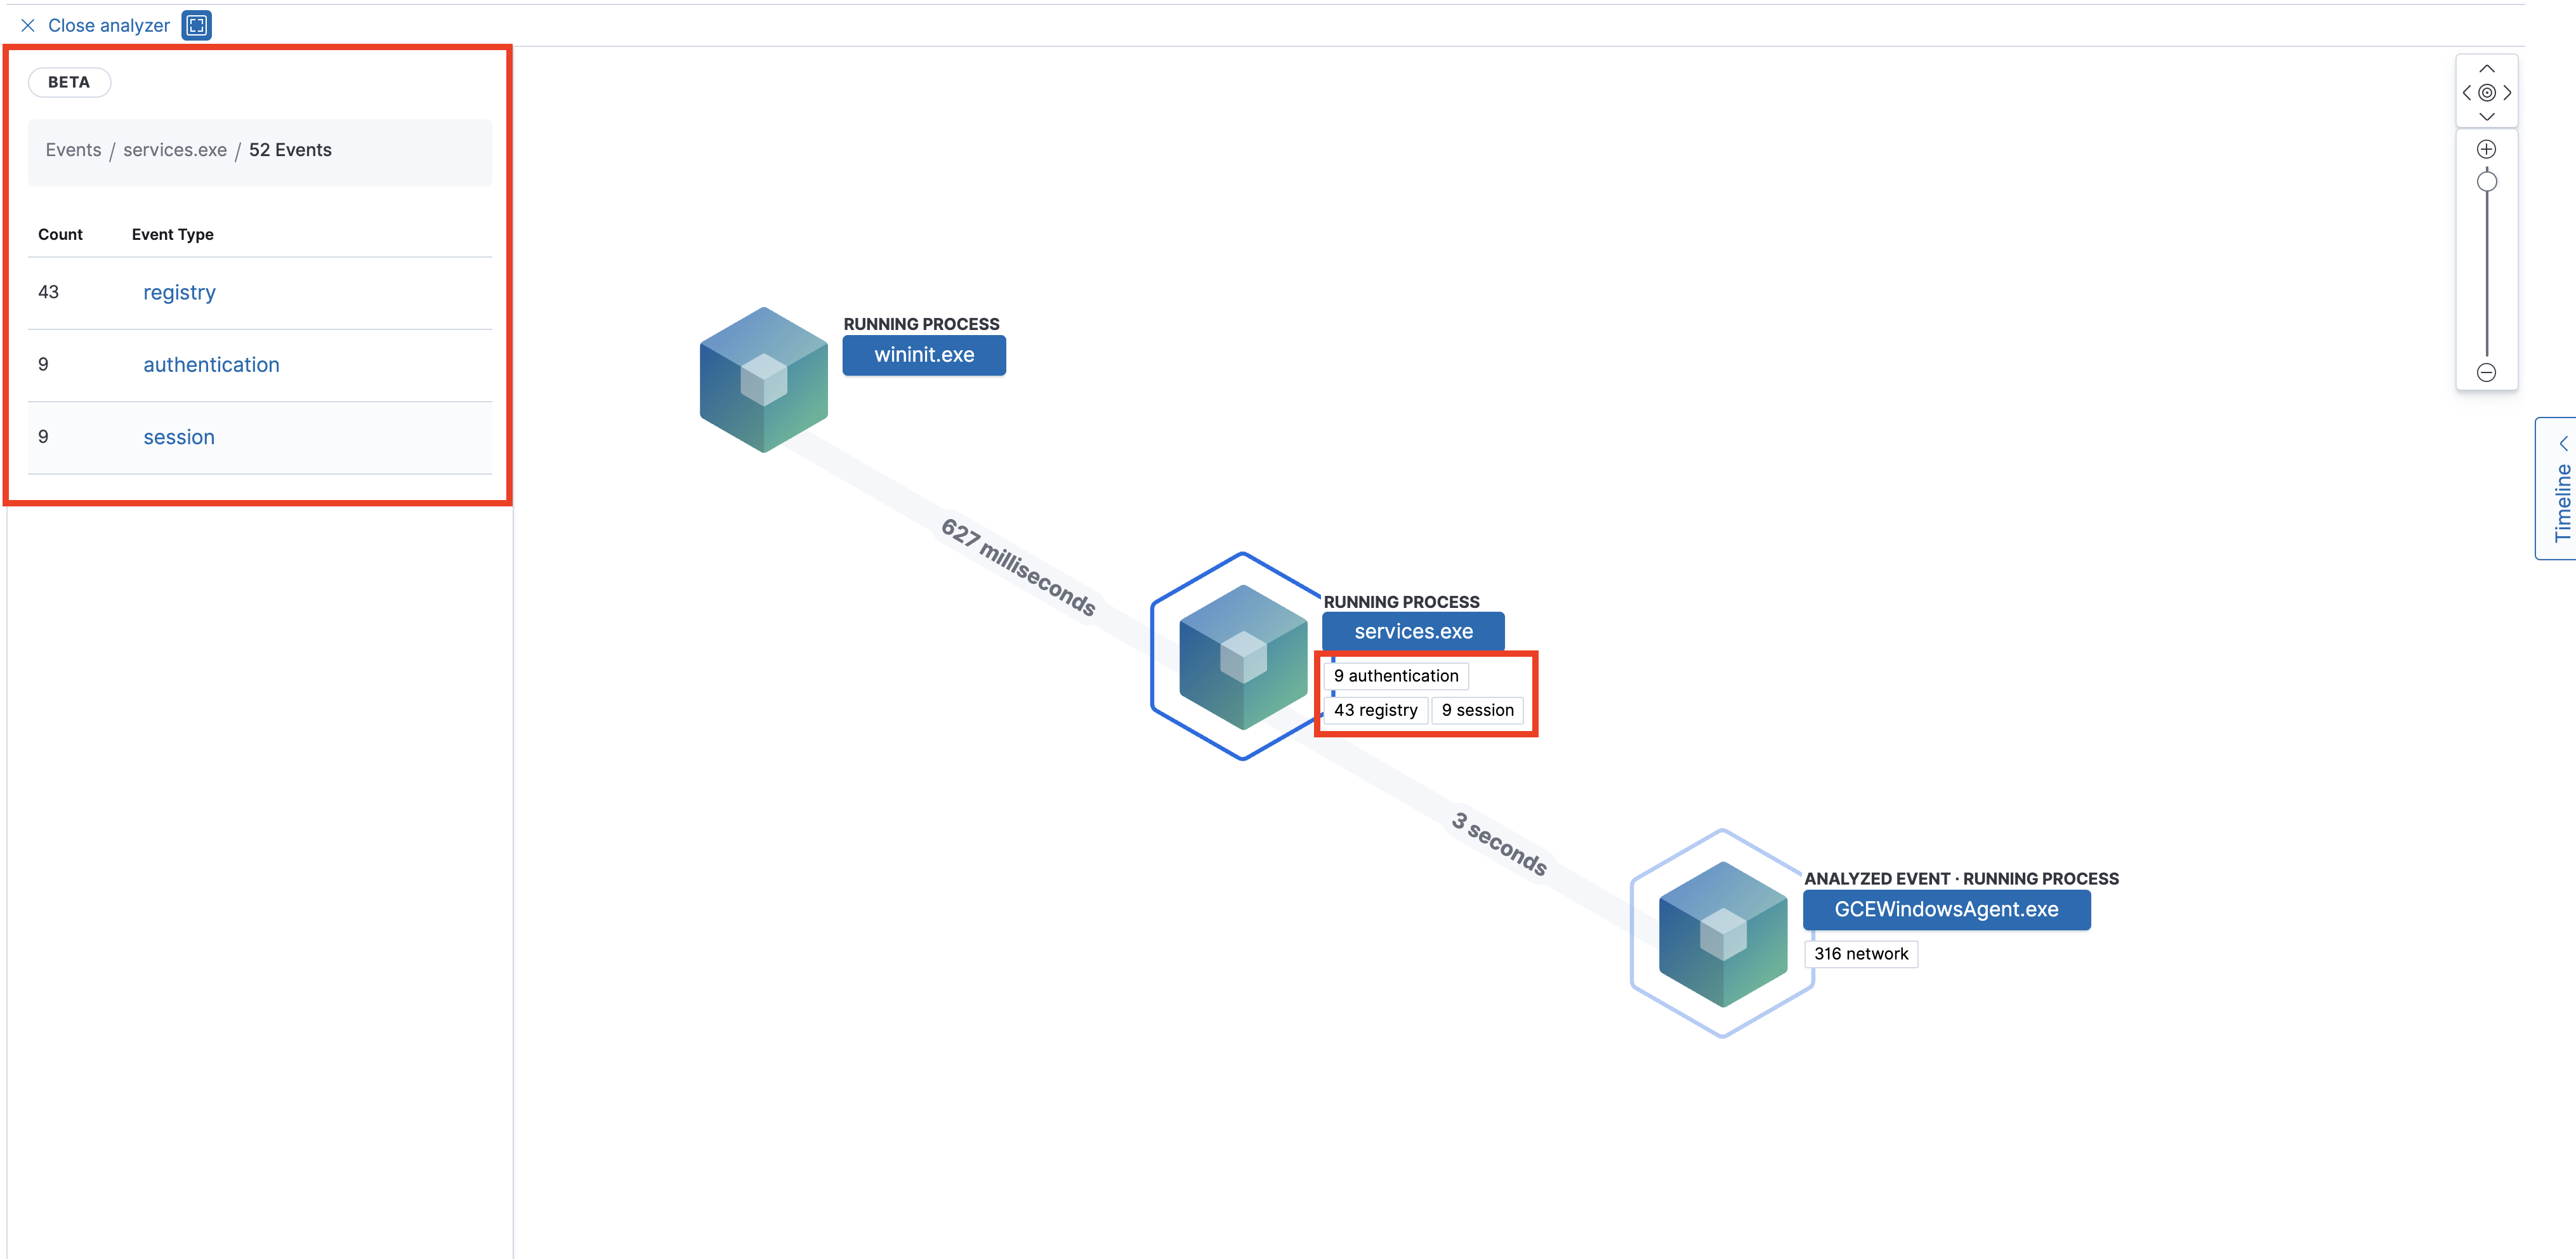
When selecting an event.type, a list of all those types of events appears in the left panel. If you want further details on the event, choose the event from the list. Event details appear in the left panel.
In Elastic Security 7.10 and later, there is no limit to the number of events that can be associated with a process. However, in 7.9, each process is limited to only 100 events.