Elastic Security UI
editElastic Security UI
editThe Elastic Security app is a highly interactive workspace designed for security analysts. It provides a clear overview of events and alerts from your environment, and you can use the interactive UI to drill down into areas of interest.
Search
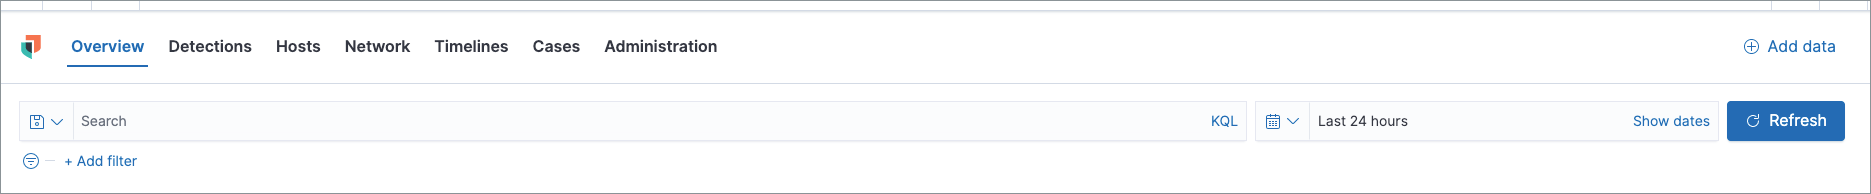
editFilter for alerts, events, processes, and other important security data with the benefit of Kibana Query Language (KQL) in the Search bar, which appears at the top of each page throughout the app. A date/time filter set to Last 24 hours is enabled by default, but can be changed to any time range. If you want to filter your search results with other fields, select Add Filter, followed by the field from which to filter and the operator (such is not or is between) for your query.
To save specific filters and queries, click the Save button, then Save current query.
Page tabs
editThe Elastic Security app contains seven page tabs that enable analysts to view, analyze, and manage security data:
- Overview
- Detections
- Hosts
- Network
- Timelines
- Cases
- Administration
Overview page
editThe Overview page provides a high-level snapshot view of detections, external alerts, and event trends. These trends are useful to assess overall system health and find anomalies that may require further investigation.
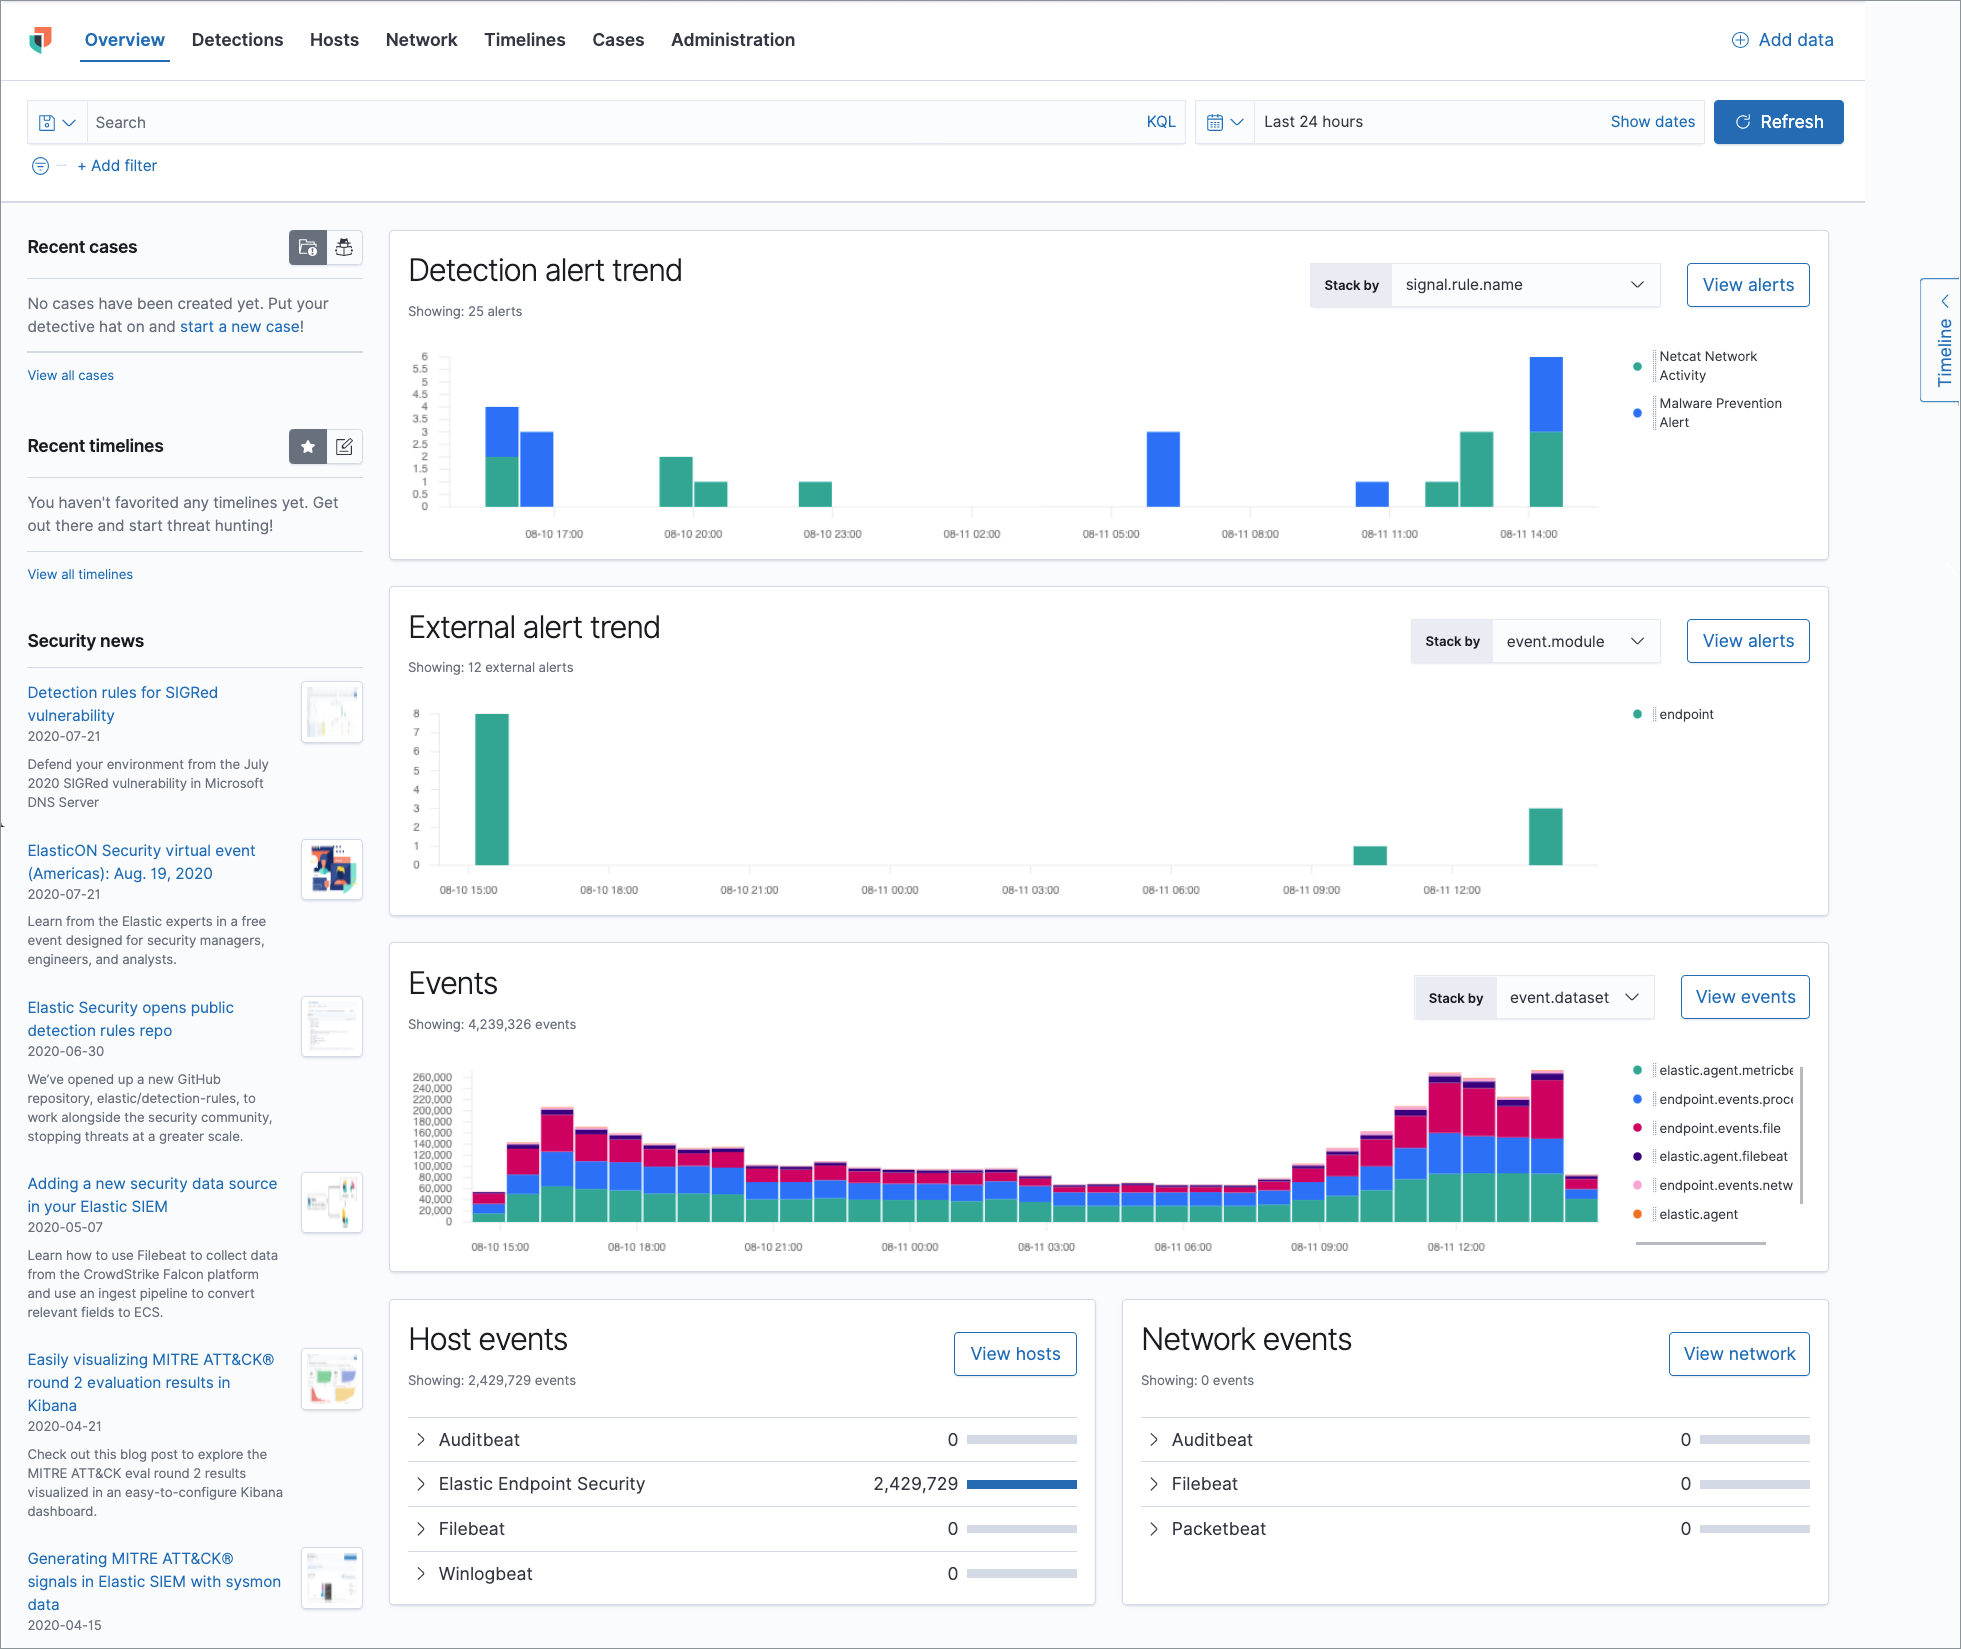
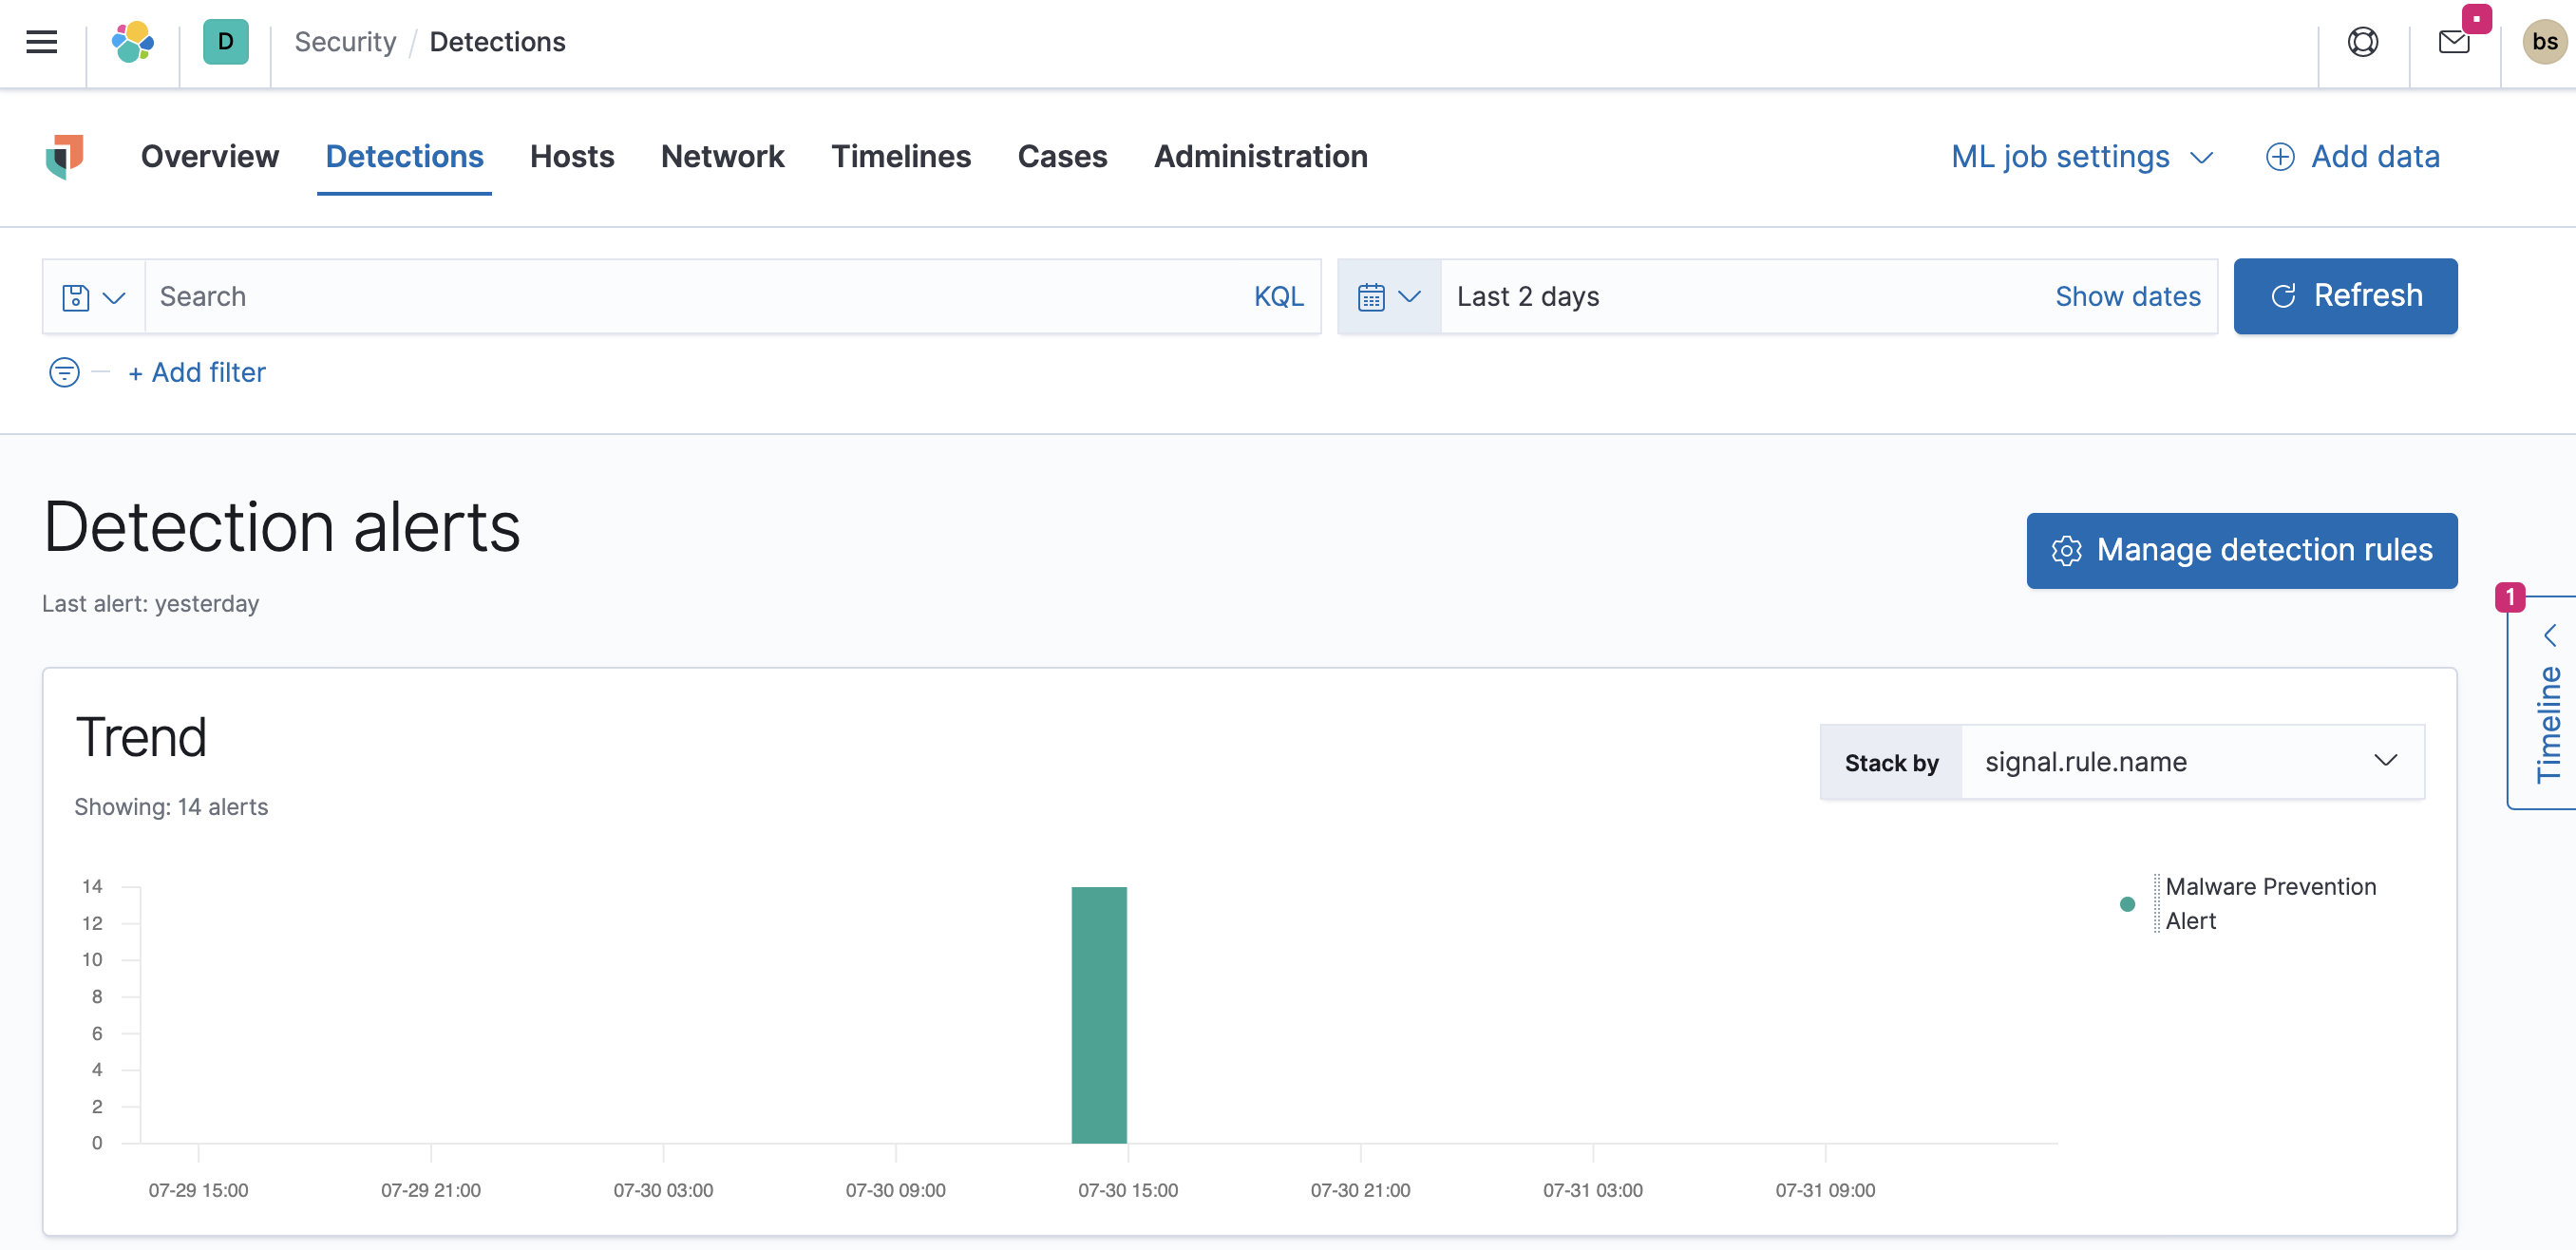
Histograms
Time-based histograms show you the number of detections, alerts, and events that have occurred within the selected time range. You can select areas of interest in time-based histograms by selecting a region to reflect a date range, or by selecting a preset value in the timepicker. In the Stack by dropdown, you can select specific parameters for which to visualize the individual counts. For example, in the Detection alert trend histogram, stack by signal.rule.name to display the total counts by alert name within the specified time frame.
All Elastic Security histograms, graphs, and tables contain an Inspect button so you can examine the Elasticsearch queries used to retrieve data throughout the app.
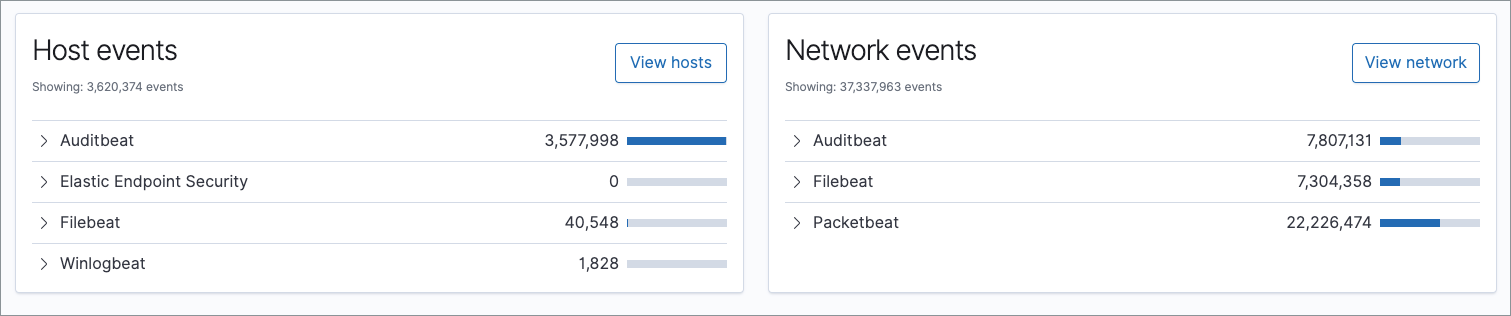
Host and network events
View event and host counts specific to Elastic data shippers and apps, such as Auditbeats or Elastic Endpoint Security. Expand each category to view specific counts of hosts or network events related to the selected category.
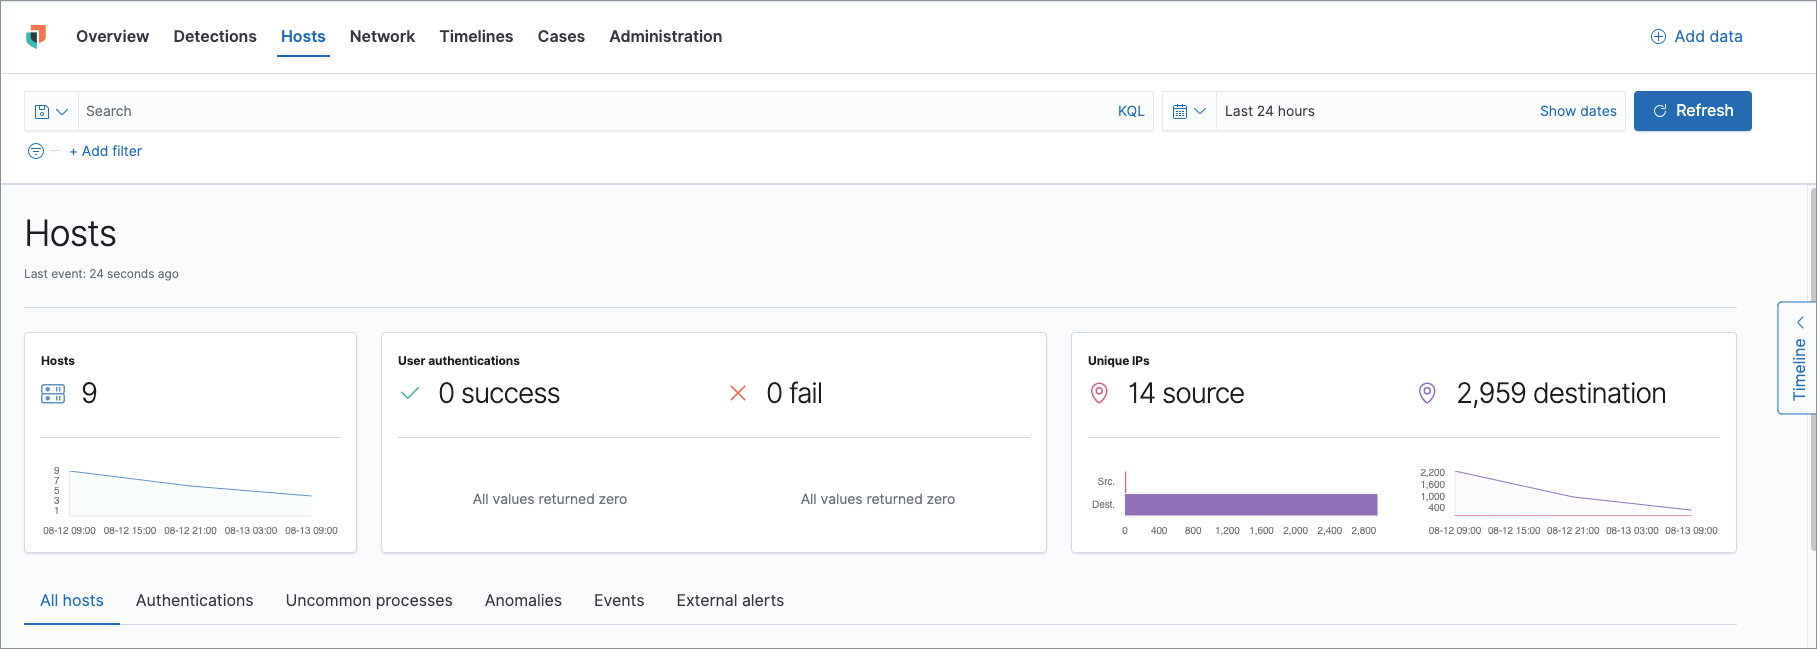
Hosts page
editThe Hosts view provides key metrics regarding host-related security events, and a set of data tables that let you interact with the Timeline. See Hosts page overview for more information.
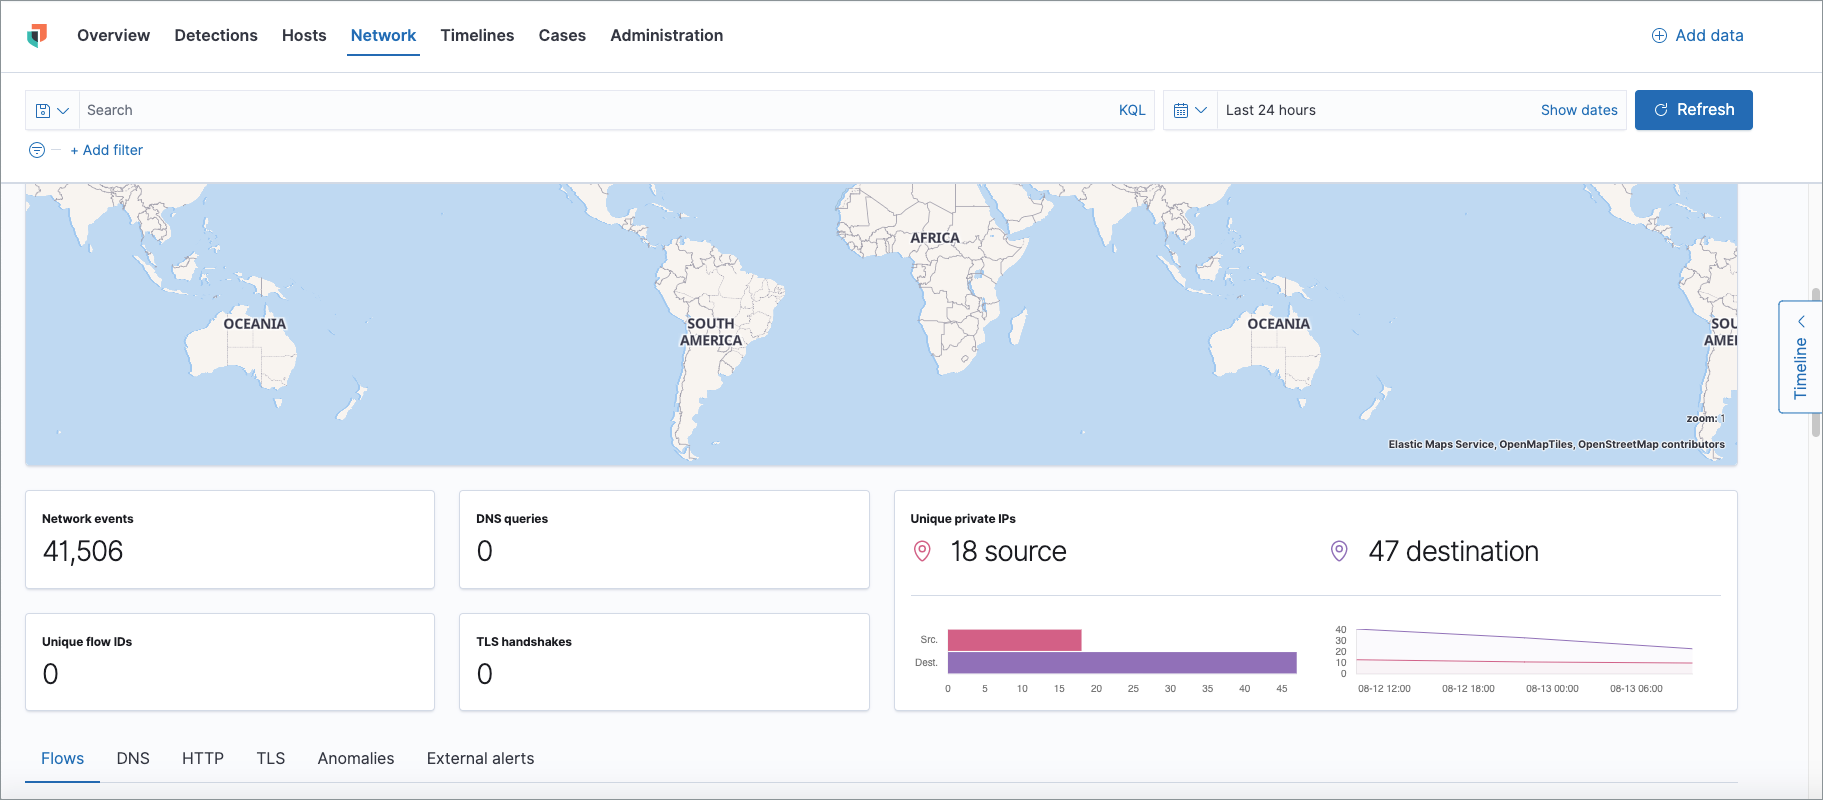
Network page
editThe Network page provides key network activity metrics via an interactive map and network event tables that enable interaction with the Timeline. See Network page overview for more information.
Detections page
editThe Detections page allows you to view and manage all alerts and detection rules to monitor activity within your network. See Detections and Alerts (beta) for more information about detections, prebuilt rules, and alerts.
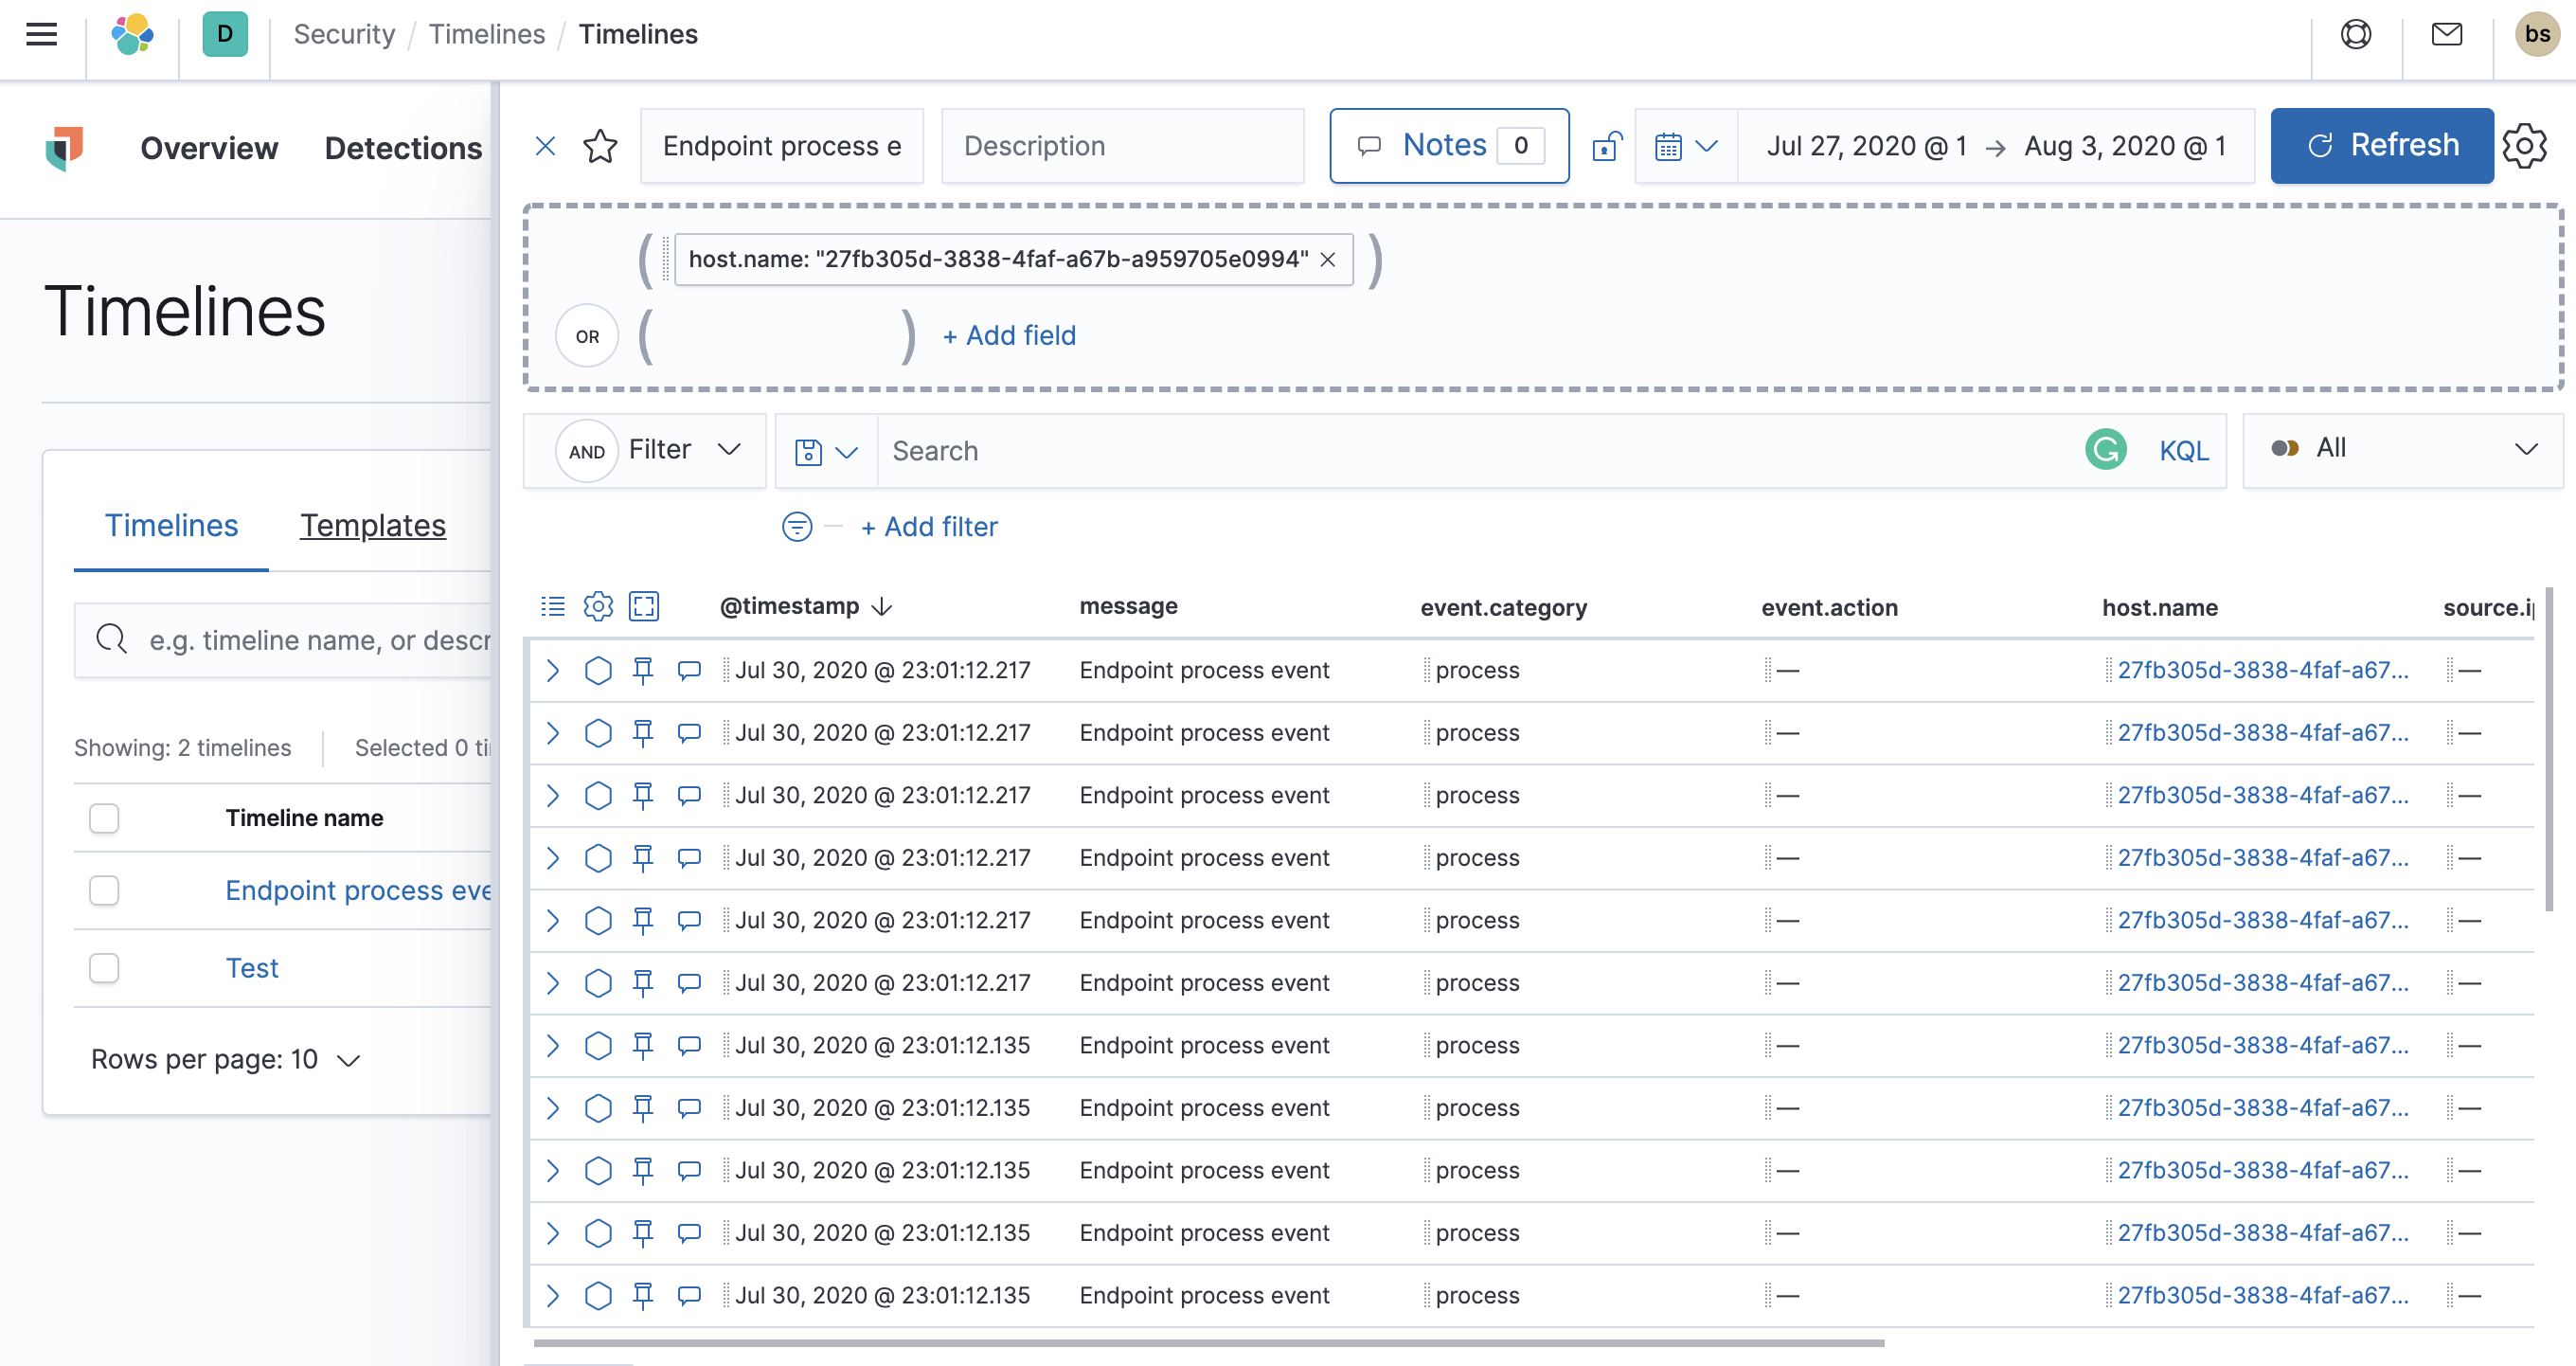
Timelines page
editUse the Timelines page to investigate alerts and complex threats, such as lateral movement of malware across hosts in your network. Timelines are responsive and allow you to share your findings among other team members. See Investigating events in Timeline for information about getting started with Timelines.
Select the collapsable Timeline button on the rightmost side of the Elastic Security app to start an investigation.
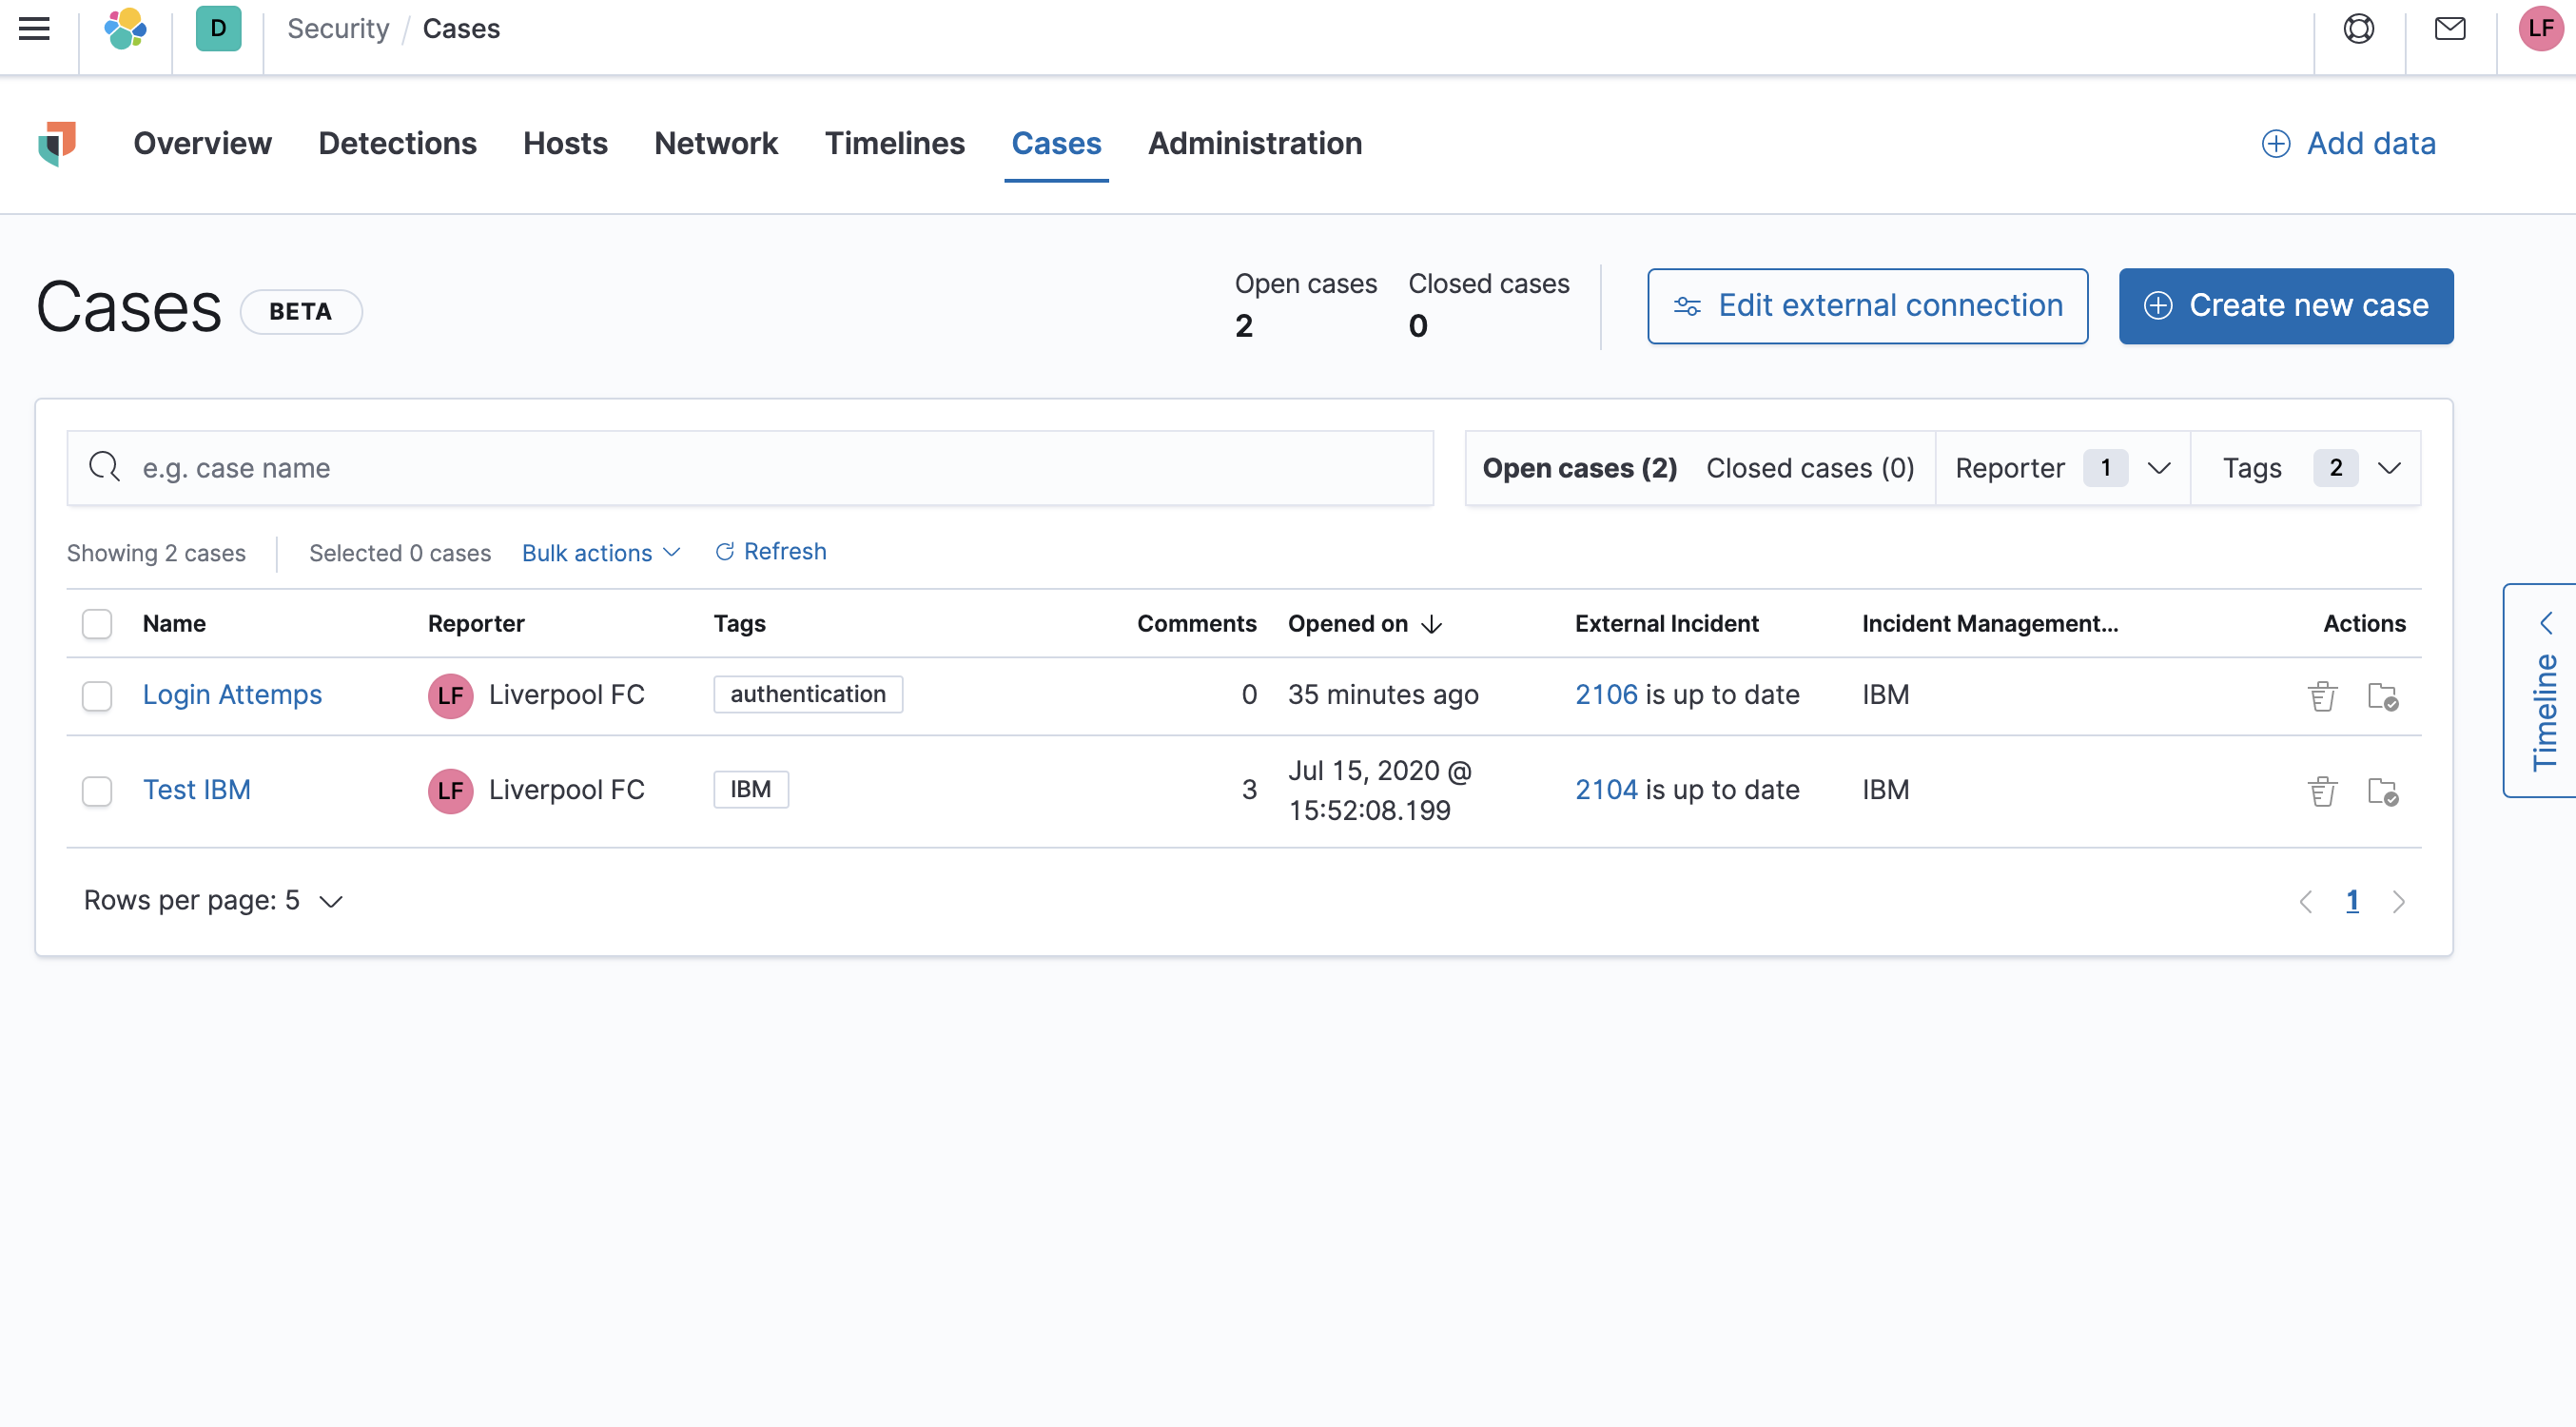
Cases page
editThe Cases page is used to open and track security issues directly in the Elastic Security app. See Cases (beta) for more information.
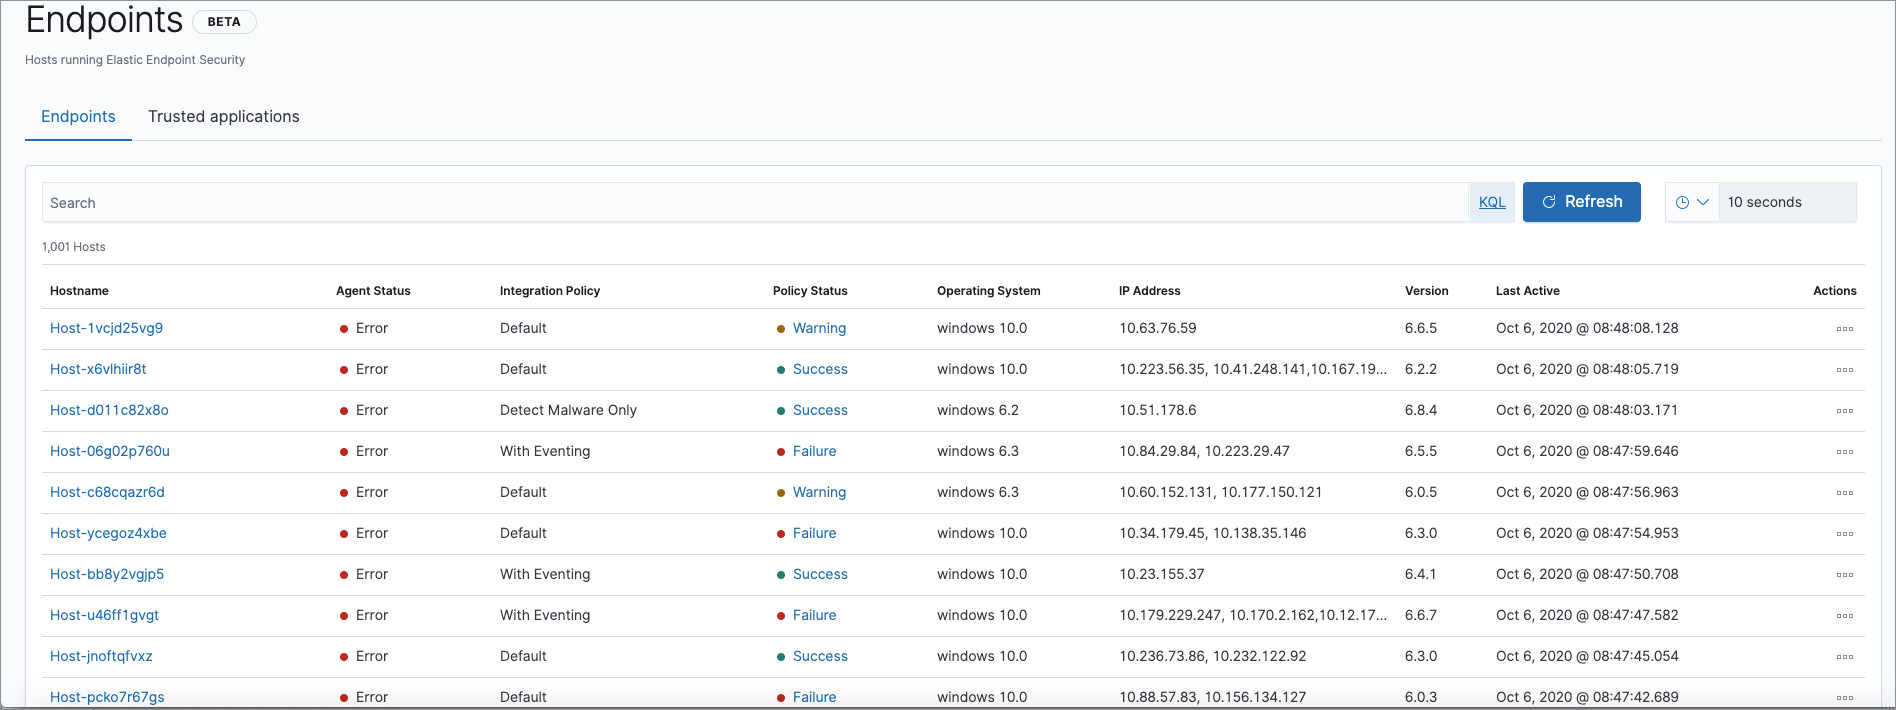
Administration page
editThe Administration page allows you to view and manage hosts that are running Endpoint Security. You can also manage agent integration, trusted applications, and monitor the configuration status of your hosts to ensure they are protected. See Administration page overview for more information.