Stream a log file
editStream a log file
editIn this guide, you’ll learn how to send a log file to Elasticsearch using a standalone Elastic Agent, configure the Elastic Agent and your data streams using the elastic-agent.yml file, and query your logs using the data streams you’ve set up. Once your log files are in Elasticsearch, see the Get the most out of your log data section to learn how to parse your log data and extract fields so you can filter and sort your logs effectively.
Prerequisites
editTo follow the steps in this guide, you need an Elastic Stack deployment that includes:
- Elasticsearch for storing and searching data
- Kibana for visualizing and managing data
-
Kibana user with
Allprivileges on Fleet and Integrations. Since many Integrations assets are shared across spaces, users need the Kibana privileges in all spaces. - Integrations Server (included by default in every Elasticsearch Service deployment)
To get started quickly, spin up a deployment of our hosted Elasticsearch Service. The Elasticsearch Service is available on AWS, GCP, and Azure. Try it out for free.
Install and configure the standalone Elastic Agent
editComplete these steps to install and configure the standalone Elastic Agent and send your log data to Elasticsearch:
Step 1: Download and extract the Elastic Agent installation package
editOn your host, download and extract the installation package that corresponds with your system:
curl -L -O https://artifacts.elastic.co/downloads/beats/elastic-agent/elastic-agent-8.9.2-darwin-x86_64.tar.gz
tar xzvf elastic-agent-8.9.2-darwin-x86_64.tar.gz
curl -L -O https://artifacts.elastic.co/downloads/beats/elastic-agent/elastic-agent-8.9.2-linux-x86_64.tar.gz
tar xzvf elastic-agent-8.9.2-linux-x86_64.tar.gz
# PowerShell 5.0+
wget https://artifacts.elastic.co/downloads/beats/elastic-agent/elastic-agent-8.9.2-windows-x86_64.zip -OutFile elastic-agent-8.9.2-windows-x86_64.zip
Expand-Archive .\elastic-agent-8.9.2-windows-x86_64.zip
Or manually:
- Download the Elastic Agent Windows zip file from the download page.
- Extract the contents of the zip file.
To simplify upgrading to future versions of Elastic Agent, we recommended that you use the tarball distribution instead of the DEB distribution.
curl -L -O https://artifacts.elastic.co/downloads/beats/elastic-agent/elastic-agent-8.9.2-amd64.deb
sudo dpkg -i elastic-agent-8.9.2-amd64.deb
To simplify upgrading to future versions of Elastic Agent, we recommended that you use the tarball distribution instead of the RPM distribution.
curl -L -O https://artifacts.elastic.co/downloads/beats/elastic-agent/elastic-agent-8.9.2-x86_64.rpm
sudo rpm -vi elastic-agent-8.9.2-x86_64.rpm
Step 2: Install and start the Elastic Agent
editAfter downloading and extracting the installation package, you’re ready to install the Elastic Agent. From the agent directory, run the install command that corresponds with your system:
On macOS, Linux (tar package), and Windows, run the install command to
install and start Elastic Agent as a managed service and start the service. The DEB and RPM
packages include a service unit for Linux systems with
systemd, For these systems, you must enable and start the service.
You must run this command as the root user because some integrations require root privileges to collect sensitive data.
sudo ./elastic-agent install
You must run this command as the root user because some integrations require root privileges to collect sensitive data.
sudo ./elastic-agent install
Open a PowerShell prompt as an Administrator (right-click the PowerShell icon and select Run As Administrator).
From the PowerShell prompt, change to the directory where you installed Elastic Agent, and run:
.\elastic-agent.exe install
You must run this command as the root user because some integrations require root privileges to collect sensitive data.
You must run this command as the root user because some integrations require root privileges to collect sensitive data.
During installation, you’re prompted with some questions:
-
When asked if you want to install the agent as a service, enter
Y. -
When asked if you want to enroll the agent in Fleet, enter
n.
Step 3: Configure the Elastic Agent
editWith your agent installed, configure it by updating the elastic-agent.yml file.
Locate your configuration file
editAfter installing the agent, you’ll find the elastic-agent.yml in one of the following locations according to your system:
Main Elastic Agent configuration file location:
/Library/Elastic/Agent/elastic-agent.yml
Main Elastic Agent configuration file location:
/opt/Elastic/Agent/elastic-agent.yml
Main Elastic Agent configuration file location:
C:\Program Files\Elastic\Agent\elastic-agent.yml
Main Elastic Agent configuration file location:
/etc/elastic-agent/elastic-agent.yml
Main Elastic Agent configuration file location:
/etc/elastic-agent/elastic-agent.yml
Update your configuration file
editThe following is an example of a standalone Elastic Agent configuration. To configure your Elastic Agent, replace the contents of the elastic-agent.yml file with this configuration:
outputs:
  default:
    type: elasticsearch
    hosts: '<your-elasticsearch-endpoint>:<port>'
    api_key: 'your-api-key'
inputs:
  - id: your-log-id
    type: filestream
    streams:
      - id: your-log-stream-id
        data_stream:
          dataset: generic
        paths:
          - /var/log/your-logs.log
Next, set the values for these fields:
-
hosts– Copy the Elasticsearch endpoint from your deployment’s page and add the port (the default port is443). For example,<YOUR_ELASTICSEARCH_ENDPOINT>:443.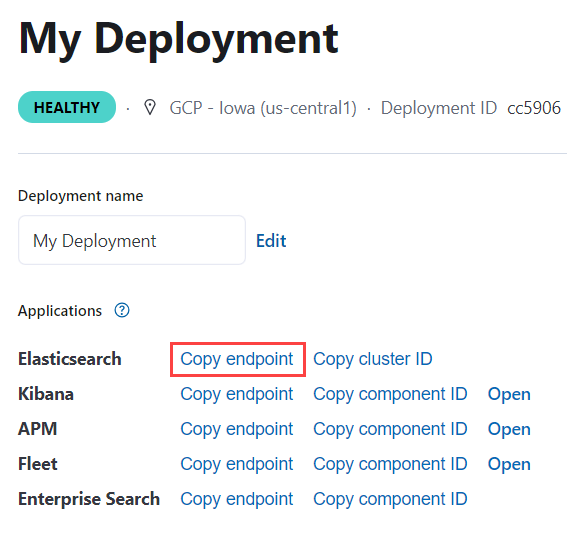
-
api-key– Use an API key to grant the agent access to Elasticsearch. To create an API key for your agent, see Create API keys for standalone agents.The API key format should be
<id>:<key>. Make sure you selected Beats when you created your API key. Base64 encoded API keys are not currently supported in this configuration. -
inputs.id– A unique identifier for your input. -
type– The type of input. For collecting logs, set this tofilestream. -
streams.id– A unique identifier for your stream of log data. -
data_stream.dataset– The name for your dataset data stream. Name this data stream anything that signifies the source of the data. The default value isgeneric. -
paths– The path to your log files. You can also use a pattern like/var/log/your-logs.log*.
Restart the Elastic Agent
editAfter updating your configuration file, you need to restart the Elastic Agent:
First, stop the Elastic Agent and its related executables using the command that works with your system:
sudo launchctl unload /Library/LaunchDaemons/co.elastic.elastic-agent.plist
Elastic Agent will restart automatically if the system is rebooted.
sudo service elastic-agent stop
Elastic Agent will restart automatically if the system is rebooted.
Stop-Service Elastic Agent
If necessary, use Task Manager on Windows to stop Elastic Agent. This will kill the
elastic-agent process and any sub-processes it created (such as Beats).
Elastic Agent will restart automatically if the system is rebooted.
The DEB package includes a service unit for Linux systems with systemd. On these systems, you can manage Elastic Agent by using the usual systemd commands.
Use systemctl to stop the agent:
sudo systemctl stop elastic-agent
Otherwise, use:
sudo service elastic-agent stop
Elastic Agent will restart automatically if the system is rebooted.
The RPM package includes a service unit for Linux systems with systemd. On these systems, you can manage Elastic Agent by using the usual systemd commands.
Use systemctl to stop the agent:
sudo systemctl stop elastic-agent
Otherwise, use:
sudo service elastic-agent stop
Elastic Agent will restart automatically if the system is rebooted.
Next, restart the Elastic Agent using the command that works with your system:
sudo launchctl load /Library/LaunchDaemons/co.elastic.elastic-agent.plist
sudo service elastic-agent start
Start-Service Elastic Agent
The DEB package includes a service unit for Linux systems with systemd. On these systems, you can manage Elastic Agent by using the usual systemd commands.
Use systemctl to start the agent:
sudo systemctl start elastic-agent
Otherwise, use:
sudo service elastic-agent start
The RPM package includes a service unit for Linux systems with systemd. On these systems, you can manage Elastic Agent by using the usual systemd commands.
Use systemctl to start the agent:
sudo systemctl start elastic-agent
Otherwise, use:
sudo service elastic-agent start
View and search your data
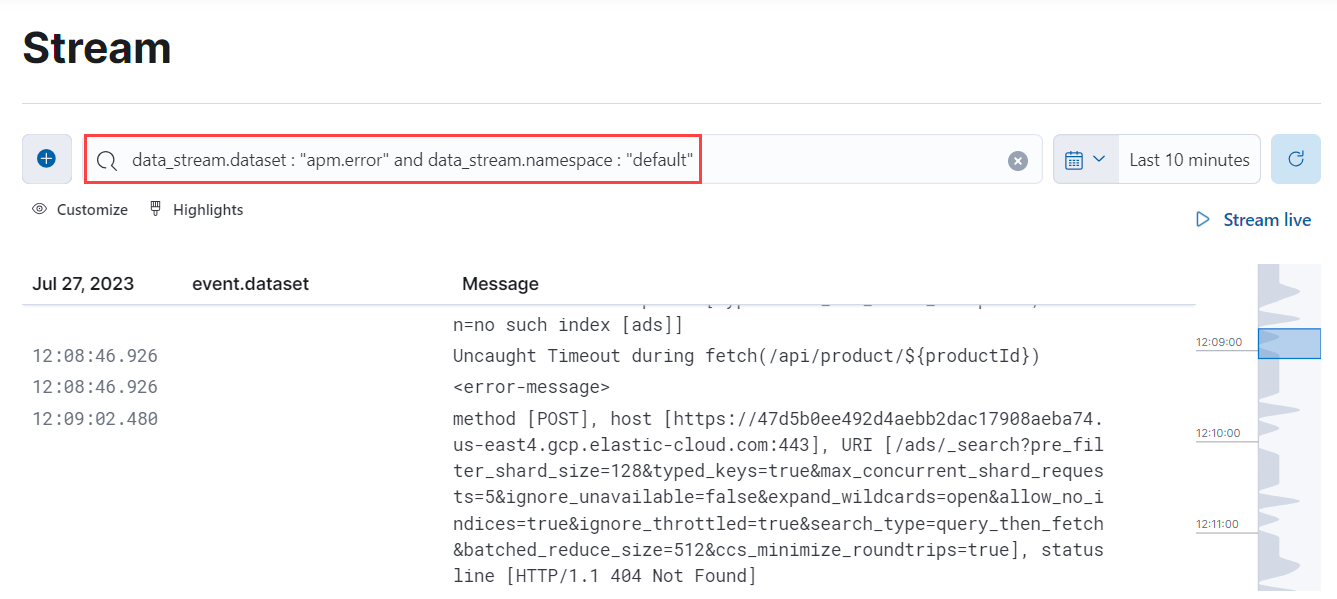
editWith your Elastic Agent and data streams configured, you can now view, filter, and search your log data. In Kibana, navigate to Observability → Logs → Stream, and use the search bar to search for your data_stream.type and data_stream.dataset.
See the following examples for ways to search specific data types and datasets:
-
data_stream.type: logs– showslogsdata streams. -
data_stream.dataset: nginx.access– shows data streams with annginx.accessdataset.
This example shows the search results for logs with an apm.error dataset and a default namespace:
Troubleshoot your Elastic Agent configuration
editIf you’re not seeing your log files in Kibana, verify the following in the elastic-agent.yml file:
-
The path to your logs file under
pathsis correct. -
Your API key is in
<id>:<key>format. If not, your API key may be in an unsupported format, and you’ll need to create an API key in Beats format.
If you’re still running into issues, see Elastic Agent troubleshooting and Configure standalone Elastic Agents.
Get the most out of your log data
editMake your logs more useful by extracting structured fields from your unstructured log data. Extracting structured fields makes it easier to search, analyze, and filter your log data.
Let’s look at this log example:
2023-08-08T13:45:12.123Z WARN 192.168.1.101 Disk usage exceeds 90%.
Add this log to Elasticsearch using the following command in Dev Tools, found in your deployment in the left navigation under Management:
POST logs-example-default/_doc
{
  "message": "2023-08-08T13:45:12.123Z WARN 192.168.1.101 Disk usage exceeds 90%."
}
The previous command stores the document in logs-example-default. Retrieve it with the following search:
GET /logs-example-default/_search
You see something like this:
{
  ...
  "hits": {
    ...
    "hits": [
      {
        "_index": ".ds-logs-example-default-2023.08.09-000001",
        ...
        "_source": {
          "message": "2023-08-08T13:45:12.123Z WARN 192.168.1.101 Disk usage exceeds 90%.",
          "@timestamp": "2023-08-09T17:19:27.73312243Z"
        }
      }
    ]
  }
}
Elasticsearch indexes the message field by default meaning you can search for phrases like WARN or Disk usage exceeds. For example, the following command searches for the phrase WARN in the log message field:
GET logs-example-default/_search
{
  "query": {
    "match": {
      "message": {
        "query": "WARN"
      }
    }
  }
}
While you can search for phrases in the message field, you can’t use this field to filter log data. Your message, however, contains all of the following potential fields you can extract and use to filter and aggregate your log data:
-
@timestamp –
2023-08-08T13:45:12.123Z– Extracting this field lets you sort logs by date and time. This is helpful when you want to view your logs in the order that they occurred or identify when issues happened. -
log.level –
WARN– Extracting this field lets you filter logs by severity. This is helpful if you want to focus on high-severity WARN or ERROR-level logs, and reduce noise by filtering out low-severity INFO-level logs. -
host.ip –
192.168.1.101– Extracting this field lets you filter logs by the host IP addresses. This is helpful if you want to focus on specific hosts that you’re having issues with or if you want to find disparities between hosts. -
message –
Disk usage exceeds 90%.– You can search for keywords in the message field.
These fields are part of the Elastic Common Schema (ECS). The ECS defines a common set of fields that you can use across Elasticsearch when storing data, including log and metric data.
Extract the @timestamp field
editWhen you ingested the document in the previous section, you’ll notice the @timestamp field shows when you added the data to Elasticsearch, not when the log occurred:
        ...
        "_source": {
          "message": "2023-08-08T13:45:12.123Z WARN 192.168.1.101 Disk usage exceeds 90%.",
          "@timestamp": "2023-08-09T17:19:27.73312243Z"
        }
        ...
This section shows you how to extract the @timestamp field from the log message so you can filter by when the logs and issues actually occurred.
To extract the timestamp, you need to:
Use an ingest pipeline to extract the @timestamp
editIngest pipelines consist of a series of processors that perform common transformations on incoming documents before they are indexed. To extract the @timestamp field from the example log, use an ingest pipeline with a dissect processor. The dissect processor extracts structured fields from unstructured log messages based on a pattern you set.
Elasticsearch can parse string timestamps that are in yyyy-MM-dd'T'HH:mm:ss.SSSZ and yyyy-MM-dd formats into date fields. Since the log example’s timestamp is in one of these formats, you don’t need additional processors. More complex or nonstandard timestamps require a date processor to parse the timestamp into a date field. Date processors can also set the timezone, change the target field, and change the output format of the timestamp.
In the following command, the dissect processor extracts the timestamp from the message field to the @timestamp field and leaves the rest of the message in the message field:
PUT _ingest/pipeline/logs-example-default
{
  "description": "Extracts the timestamp from log",
  "processors": [
    {
      "dissect": {
        "field": "message",
        "pattern": "%{@timestamp} %{message}"
      }
    }
  ]
}
The previous command sets the following values for your ingest pipeline:
-
_ingest/pipeline/logs-example-default– The name of the pipeline,logs-example-default, needs to match the name of your data stream. You’ll set up your data stream in the next section. See the data stream naming scheme for more information. -
field– The field you’re extracting data from,messagein this case. -
pattern– The pattern of the elements in your log data. The following pattern extracts the timestamp,2023-08-08T13:45:12.123Z, to the@timestampfield, while the rest of the message,WARN 192.168.1.101 Disk usage exceeds 90%., stays in themessagefield. The dissect processor looks for the space as a separator defined by the pattern%{timestamp} %{message}.
Test your pipeline with the simulate pipeline API
editThe simulate pipeline API runs the ingest pipeline without storing any documents. This lets you verify your pipeline works using multiple documents. Run the following command to test your ingest pipeline with the simulate pipeline API.
POST _ingest/pipeline/logs-example-default/_simulate
{
  "docs": [
    {
      "_source": {
        "message": "2023-08-08T13:45:12.123Z WARN 192.168.1.101 Disk usage exceeds 90%."
      }
    }
  ]
}
The results should show the @timestamp field extracted from the message field:
{
  "docs": [
    {
      "doc": {
        "_index": "_index",
        "_id": "_id",
        "_version": "-3",
        "_source": {
          "message": "WARN 192.168.1.101 Disk usage exceeds 90%.",
          "@timestamp": "2023-08-08T13:45:12.123Z"
        },
        ...
      }
    }
  ]
}
Make sure you’ve created the index pipeline using the PUT command in the previous section before using the simulate pipeline API.
Configure your data stream with an index template
editAfter creating your ingest pipeline, create an index template to point your log data to your pipeline using this command:
PUT _index_template/logs-example-default-template
{
  "index_patterns": [ "logs-example-*" ],
  "data_stream": { },
  "priority": 500,
  "template": {
    "settings": {
      "index.default_pipeline":"logs-example-default"
    }
  },
  "composed_of": [
    "logs-mappings",
    "logs-settings",
    "logs@custom",
    "ecs@dynamic_templates"
  ],
  "ignore_missing_component_templates": ["logs@custom"]
}
The previous command sets the following values for your index template:
-
index_patterns– The index pattern needs to match your log data stream. Naming conventions for data streams are<type>-<dataset>-<namespace>. In this example, your logs data stream is namedlogs-example-default. Data that matches this pattern will go through your pipeline. -
data_stream– Enables data streams. -
priority– Index templates with higher priority take precedence over lower priority. If a data stream matches multiple index templates, Elasticsearch uses the template with the higher priority. Built-in templates have a priority of200, so use a priority higher than200for custom templates. -
index.default_pipeline– The name of your ingest pipeline.logs-example-defaultin this case. -
composed_of– Here you can set component templates. Component templates are building blocks for constructing index templates that specify index mappings, settings, and aliases. Elastic has several built-in templates that help when ingesting your data.
The component templates that are set in the previous index template are defined as follows:
-
logs-mappings– general mappings for logs data streams that includes disabling automatic date detection fromstringfields and specifying mappings fordata_streamECS fields. -
logs-settings– Sets the general settings for logs data streams including the default lifecycle policy and default pipeline:- The default lifecycle policy rolls over when the primary shard reaches 50 GB or after 30 days.
-
The default pipeline:
-
Sets a
@timestampif there isn’t one using the ingest timestamp. -
Places a hook for the
logs@custompipeline. If alogs@custompipeline is installed, it’s applied to logs ingested into this data stream.
-
Sets a
-
Sets the
ignore_malformedflag totrue. If a field in the log document contains an incorrect value type and the field’s mapping type supports this flag, the document is still processed.
-
logs@custom– a predefined component template that is not installed by default. Use this name to install a custom component template if you wish to override or extend any of the default mappings or settings. -
ecs@dynamic_templates– dynamic templates that automatically ensure your data stream mappings comply with the Elastic Common Schema (ECS).
Create your data stream
editCreate your data stream using the data stream naming scheme. Since the name needs to match the name of your pipeline, name the data stream logs-example-default. Post the example log to your data stream with this command:
POST logs-example-default/_doc
{
  "message": "2023-08-08T13:45:12.123Z WARN 192.168.1.101 Disk usage exceeds 90%."
}
View your documents using this command:
GET /logs-example-default/_search
You should see the pipeline has extracted the @timestamp field:
{
...
{
  ...
  "hits": {
    ...
    "hits": [
      {
        "_index": ".ds-logs-example-default-2023.08.09-000001",
        "_id": "RsWy3IkB8yCtA5VGOKLf",
        "_score": 1,
        "_source": {
          "message": "WARN 192.168.1.101 Disk usage exceeds 90%.",
          "@timestamp": "2023-08-08T13:45:12.123Z"
        }
      }
    ]
  }
}
You can now use the @timestamp field to sort your logs by the date and time they happened.
Troubleshoot your @timestamp field
editCheck the following common issues and solutions with timestamps:
-
Timestamp failure – If your data has inconsistent date formats, set
ignore_failuretotruefor your date processor. This processes logs with correctly formatted dates and ignores those with issues. -
Incorrect timezone – Set your timezone using the
timezoneoption on the date processor. - Incorrect timestamp format – Your timestamp can be a Java time pattern or one of the following formats: ISO8601, UNIX, UNIX_MS, or TAI64N. See the mapping date format for more information on timestamp formats.
Extract the log.level field
editExtracting the log.level field lets you filter by severity and focus on critical issues. This section shows you how to extract the log.level field from this example log:
2023-08-08T13:45:12.123Z WARN 192.168.1.101 Disk usage exceeds 90%.
To extract and use the log.level field:
Add log.level to your ingest pipeline
editAdd the %{log.level} option to the dissect processor pattern in the ingest pipeline you created in the Extract the @timestamp field section:
PUT _ingest/pipeline/logs-example-default
{
  "description": "Extracts the timestamp from log",
  "processors": [
    {
      "dissect": {
        "field": "message",
        "pattern": "%{@timestamp} %{log.level} %{message}"
      }
    }
  ]
}
Now your pipeline will extract these fields:
-
The
@timestampfield –2023-08-08T13:45:12.123Z -
The
log.levelfield –WARN -
The
messagefield –192.168.1.101 Disk usage exceeds 90%.
After creating your pipeline, an index template points your log data to your pipeline. Use the index template you created in the Extract the @timestamp field section.
Test the pipeline with the simulate API
editTest that your ingest pipeline works as expected with the simulate pipeline API:
POST _ingest/pipeline/logs-example-default/_simulate
{
  "docs": [
    {
      "_source": {
        "message": "2023-08-08T13:45:12.123Z WARN 192.168.1.101 Disk usage exceeds 90%."
      }
    }
  ]
}
The results should show the @timestamp and the log.level fields extracted from the message field:
{
  "docs": [
    {
      "doc": {
        "_index": "_index",
        "_id": "_id",
        "_version": "-3",
        "_source": {
          "message": "192.168.1.101 Disk usage exceeds 90%.",
          "log": {
            "level": "WARN"
          },
          "@timestamp": "2023-8-08T13:45:12.123Z",
        },
        ...
      }
    }
  ]
}
Query logs based on log.level
editOnce you’ve extracted the log.level field, you can query for high-severity logs like WARN and ERROR, which may need immediate attention, and filter out less critical INFO and DEBUG logs.
Let’s say you have the following logs with varying severities:
2023-08-08T13:45:12.123Z WARN 192.168.1.101 Disk usage exceeds 90%.
2023-08-08T13:45:14.003Z ERROR 192.168.1.103 Database connection failed.
2023-08-08T13:45:15.004Z DEBUG 192.168.1.104 Debugging connection issue.
2023-08-08T13:45:16.005Z INFO 192.168.1.102 User changed profile picture.
Add them to your data stream using this command:
POST logs-example-default/_bulk
{ "create": {} }
{ "message": "2023-08-08T13:45:12.123Z WARN 192.168.1.101 Disk usage exceeds 90%." }
{ "create": {} }
{ "message": "2023-08-08T13:45:14.003Z ERROR 192.168.1.103 Database connection failed." }
{ "create": {} }
{ "message": "2023-08-08T13:45:15.004Z DEBUG 192.168.1.104 Debugging connection issue." }
{ "create": {} }
{ "message": "2023-08-08T13:45:16.005Z INFO 192.168.1.102 User changed profile picture." }
Then, query for documents with a log level of WARN or ERROR with this command:
GET logs-example-default/_search
{
  "query": {
    "terms": {
      "log.level": ["WARN", "ERROR"]
    }
  }
}
You should see the following results showing only your high-severity logs:
{
...
  },
  "hits": {
  ...
    "hits": [
      {
        "_index": ".ds-logs-example-default-2023.08.14-000001",
        "_id": "3TcZ-4kB3FafvEVY4yKx",
        "_score": 1,
        "_source": {
          "message": "192.168.1.101 Disk usage exceeds 90%.",
          "log": {
            "level": "WARN"
          },
          "@timestamp": "2023-08-08T13:45:12.123Z"
        }
      },
      {
        "_index": ".ds-logs-example-default-2023.08.14-000001",
        "_id": "3jcZ-4kB3FafvEVY4yKx",
        "_score": 1,
        "_source": {
          "message": "192.168.1.103 Database connection failed.",
          "log": {
            "level": "ERROR"
          },
          "@timestamp": "2023-08-08T13:45:14.003Z"
        }
      }
    ]
  }
}
Extract the host.ip field
editExtracting the host.ip field lets you filter logs by host IP addresses allowing you to focus on specific hosts that you’re having issues with or find disparities between hosts.
The host.ip field is part of the Elastic Common Schema (ECS). Through the ECS, the host.ip field is mapped as an ip field type. ip field types allow range queries so you can find logs with IP addresses in a specific range. You can also query ip field types using CIDR notation to find logs from a particular network or subnet.
This section shows you how to extract the host.ip field from the following example logs and query based on the extracted fields:
2023-08-08T13:45:12.123Z WARN 192.168.1.101 Disk usage exceeds 90%.
2023-08-08T13:45:14.003Z ERROR 192.168.1.103 Database connection failed.
2023-08-08T13:45:15.004Z DEBUG 192.168.1.104 Debugging connection issue.
2023-08-08T13:45:16.005Z INFO 192.168.1.102 User changed profile picture.
To extract and use the host.ip field:
Add host.ip to your ingest pipeline
editAdd the %{host.ip} option to the dissect processor pattern in the ingest pipeline you created in the Extract the @timestamp field section:
PUT _ingest/pipeline/logs-example-default
{
  "description": "Extracts the timestamp from log",
  "processors": [
    {
      "dissect": {
        "field": "message",
        "pattern": "%{@timestamp} %{log.level} %{host.ip} %{message}"
      }
    }
  ]
}
Your pipeline will extract these fields:
-
The
@timestampfield –2023-08-08T13:45:12.123Z -
The
log.levelfield –WARN -
The
host.ipfield –192.168.1.101 -
The
messagefield –Disk usage exceeds 90%.
After creating your pipeline, an index template points your log data to your pipeline. Use the index template you created in the Extract the @timestamp field section.
Test the pipeline with the simulate API
editTest that your ingest pipeline works as expected with the simulate pipeline API:
POST _ingest/pipeline/logs-example-default/_simulate
{
  "docs": [
    {
      "_source": {
        "message": "2023-08-08T13:45:12.123Z WARN 192.168.1.101 Disk usage exceeds 90%."
      }
    }
  ]
}
The results should show the host.ip, @timestamp, and log.level fields extracted from the message field:
{
  "docs": [
    {
      "doc": {
        ...
        "_source": {
          "host": {
            "ip": "192.168.1.101"
          },
          "@timestamp": "2023-08-08T13:45:12.123Z",
          "message": "Disk usage exceeds 90%.",
          "log": {
            "level": "WARN"
          }
        },
        ...
      }
    }
  ]
}
Query logs based on host.ip
editYou can query your logs based on the host.ip field in different ways, including using CIDR notation and range queries.
Before querying your logs, add them to your data stream using this command:
POST logs-example-default/_bulk
{ "create": {} }
{ "message": "2023-08-08T13:45:12.123Z WARN 192.168.1.101 Disk usage exceeds 90%." }
{ "create": {} }
{ "message": "2023-08-08T13:45:14.003Z ERROR 192.168.1.103 Database connection failed." }
{ "create": {} }
{ "message": "2023-08-08T13:45:15.004Z DEBUG 192.168.1.104 Debugging connection issue." }
{ "create": {} }
{ "message": "2023-08-08T13:45:16.005Z INFO 192.168.1.102 User changed profile picture." }
CIDR notation
editYou can use CIDR notation to query your log data using a block of IP addresses that fall within a certain network segment. CIDR notations uses the format of [IP address]/[prefix length]. The following command queries IP addresses in the 192.168.1.0/24 subnet meaning IP addresses from 192.168.1.0 to 192.168.1.255.
GET logs-example-default/_search
{
  "query": {
    "term": {
      "host.ip": "192.168.1.0/24"
    }
  }
}
Because all of the example logs are in this range, you’ll get the following results:
{
  ...
  },
  "hits": {
    ...
      {
        "_index": ".ds-logs-example-default-2023.08.16-000001",
        "_id": "ak4oAIoBl7fe5ItIixuB",
        "_score": 1,
        "_source": {
          "host": {
            "ip": "192.168.1.101"
          },
          "@timestamp": "2023-08-08T13:45:12.123Z",
          "message": "Disk usage exceeds 90%.",
          "log": {
            "level": "WARN"
          }
        }
      },
      {
        "_index": ".ds-logs-example-default-2023.08.16-000001",
        "_id": "a04oAIoBl7fe5ItIixuC",
        "_score": 1,
        "_source": {
          "host": {
            "ip": "192.168.1.103"
          },
          "@timestamp": "2023-08-08T13:45:14.003Z",
          "message": "Database connection failed.",
          "log": {
            "level": "ERROR"
          }
        }
      },
      {
        "_index": ".ds-logs-example-default-2023.08.16-000001",
        "_id": "bE4oAIoBl7fe5ItIixuC",
        "_score": 1,
        "_source": {
          "host": {
            "ip": "192.168.1.104"
          },
          "@timestamp": "2023-08-08T13:45:15.004Z",
          "message": "Debugging connection issue.",
          "log": {
            "level": "DEBUG"
          }
        }
      },
      {
        "_index": ".ds-logs-example-default-2023.08.16-000001",
        "_id": "bU4oAIoBl7fe5ItIixuC",
        "_score": 1,
        "_source": {
          "host": {
            "ip": "192.168.1.102"
          },
          "@timestamp": "2023-08-08T13:45:16.005Z",
          "message": "User changed profile picture.",
          "log": {
            "level": "INFO"
          }
        }
      }
    ]
  }
}
Range queries
editUse range queries to query logs in a specific range.
The following command searches for IP addresses greater than or equal to 192.168.1.100 and less than or equal to 192.168.1.102.
GET logs-example-default/_search
{
  "query": {
    "range": {
      "host.ip": {
        "gte": "192.168.1.100",
        "lte": "192.168.1.102"
      }
    }
  }
}
You’ll get the following results matching the range you’ve set:
{
  ...
  },
  "hits": {
    ...
      {
        "_index": ".ds-logs-example-default-2023.08.16-000001",
        "_id": "ak4oAIoBl7fe5ItIixuB",
        "_score": 1,
        "_source": {
          "host": {
            "ip": "192.168.1.101"
          },
          "@timestamp": "2023-08-08T13:45:12.123Z",
          "message": "Disk usage exceeds 90%.",
          "log": {
            "level": "WARN"
          }
        }
      },
      {
        "_index": ".ds-logs-example-default-2023.08.16-000001",
        "_id": "bU4oAIoBl7fe5ItIixuC",
        "_score": 1,
        "_source": {
          "host": {
            "ip": "192.168.1.102"
          },
          "@timestamp": "2023-08-08T13:45:16.005Z",
          "message": "User changed profile picture.",
          "log": {
            "level": "INFO"
          }
        }
      }
    ]
  }
}
Ignore malformed IP addresses
editWhen you’re ingesting a large batch of log data, a single malformed IP address can cause the entire batch to fail. Prevent this by setting ignore_malformed to true for the host.ip field. Update the host.ip field to ignore malformed IPs using the update mapping API:
PUT /logs-example-default/_mapping
{
  "properties": {
    "host.ip": {
      "type": "ip",
      "ignore_malformed": true
    }
  }
}
Reroute log data to specific data stream
editThis functionality is in technical preview and may be changed or removed in a future release. Elastic will work to fix any issues, but features in technical preview are not subject to the support SLA of official GA features.
By default, an ingest pipeline sends your log data to a single data stream. To simplify log data management, use a reroute processor to route data from the generic data stream to a target data stream. For example, you might want to send high-severity logs to a specific data stream to help with categorization.
This section shows you how to use a reroute processor to send the high-severity logs (WARN or ERROR) from the following example logs to a specific data stream and keep the regular logs (DEBUG and INFO) in the default data stream:
2023-08-08T13:45:12.123Z WARN 192.168.1.101 Disk usage exceeds 90%.
2023-08-08T13:45:14.003Z ERROR 192.168.1.103 Database connection failed.
2023-08-08T13:45:15.004Z DEBUG 192.168.1.104 Debugging connection issue.
2023-08-08T13:45:16.005Z INFO 192.168.1.102 User changed profile picture.
When routing data to different data streams, we recommend keeping the number of data streams relatively low to avoid oversharding. See Size your shards for more information.
To use a reroute processor:
Add a reroute processor to your ingest pipeline
editAdd a reroute processor to your ingest pipeline with the following command:
PUT _ingest/pipeline/logs-example-default
{
  "description": "Extracts fields and reroutes WARN",
  "processors": [
    {
      "dissect": {
        "field": "message",
        "pattern": "%{@timestamp} %{log.level} %{host.ip} %{message}"
      },
      "reroute": {
        "tag": "high_severity_logs",
        "if" : "ctx.log?.level == 'WARN' || ctx.log?.level == 'ERROR'",
        "dataset": "critical"
      }
    }
  ]
}
The previous command sets the following values for your reroute processor:
-
tag– Identifier for the processor that you can use for debugging and metrics. In the example, the tag is set tohigh_severity_logs. -
if– Conditionally runs the processor. In the example,"ctx.log?.level == 'WARN' || ctx.log?.level == 'ERROR'",means the processor runs when thelog.levelfield isWARNorERROR. -
dataset– the data stream dataset to route your document to if the previous condition istrue. In the example, logs with alog.levelofWARNorERRORare routed to thelogs-critical-defaultdata stream.
After creating your pipeline, an index template points your log data to your pipeline. Use the index template you created in the Extract the @timestamp field section.
Add logs to your data stream
editAdd the example logs to your data stream with this command:
POST logs-example-default/_bulk
{ "create": {} }
{ "message": "2023-08-08T13:45:12.123Z WARN 192.168.1.101 Disk usage exceeds 90%." }
{ "create": {} }
{ "message": "2023-08-08T13:45:14.003Z ERROR 192.168.1.103 Database connection failed." }
{ "create": {} }
{ "message": "2023-08-08T13:45:15.004Z DEBUG 192.168.1.104 Debugging connection issue." }
{ "create": {} }
{ "message": "2023-08-08T13:45:16.005Z INFO 192.168.1.102 User changed profile picture." }
Verify that the reroute processor worked
editThe reroute processor should route any logs with a log.level of WARN or ERROR to the logs-critical-default data stream. Query the the data stream using the following command to verify the log data was routed as intended:
GET log-critical-default/_search
Your query should return similar results to the following:
{
  ...
  "hits": {
    ...
    "hits": [
        ...
        "_source": {
          "host": {
            "ip": "192.168.1.101"
          },
          "@timestamp": "2023-08-08T13:45:12.123Z",
          "message": "Disk usage exceeds 90%.",
          "log": {
            "level": "WARN"
          },
          "data_stream": {
            "namespace": "default",
            "type": "logs",
            "dataset": "critical"
          },
          {
        ...
        "_source": {
          "host": {
            "ip": "192.168.1.103"
           },
          "@timestamp": "2023-08-08T13:45:14.003Z",
          "message": "Database connection failed.",
          "log": {
            "level": "ERROR"
          },
          "data_stream": {
            "namespace": "default",
            "type": "logs",
            "dataset": "critical"
          }
        }
      }
    ]
  }
}
You can see the high-severity logs and that they’re now in the critical dataset.