Host metrics
editHost metrics
editIf you haven’t already, you need to install and configure Metricbeat to populate the Metrics app with data. For more information, see Ingest metrics.
Host metrics are ingested using the Metricbeat system module, which is enabled by default, and become available for analysis in the Metrics app.
To help you analyze the host metrics listed on the Inventory page, you can select view filters based on the following predefined metrics or you can add custom metrics.
CPU Usage |
Average of |
Memory Usage |
Average of |
Load |
Average of |
Inbound Traffic |
Derivative of the maximum of |
Outbound Traffic |
Derivative of the maximum of |
Log Rate |
Derivative of the cumulative sum of the document count scaled to a 1 second rate. This metric relies on the same indices as the logs. |
For information about which required fields the Metrics app uses to display host metrics, see the Metrics field reference.
Host details
editWithout leaving the Inventory page, you can view enhanced details relating to each host running in your infrastructure. On the waffle map, select the host to display the host details overlay.
The host details overlay contains the following tabs:
Metrics
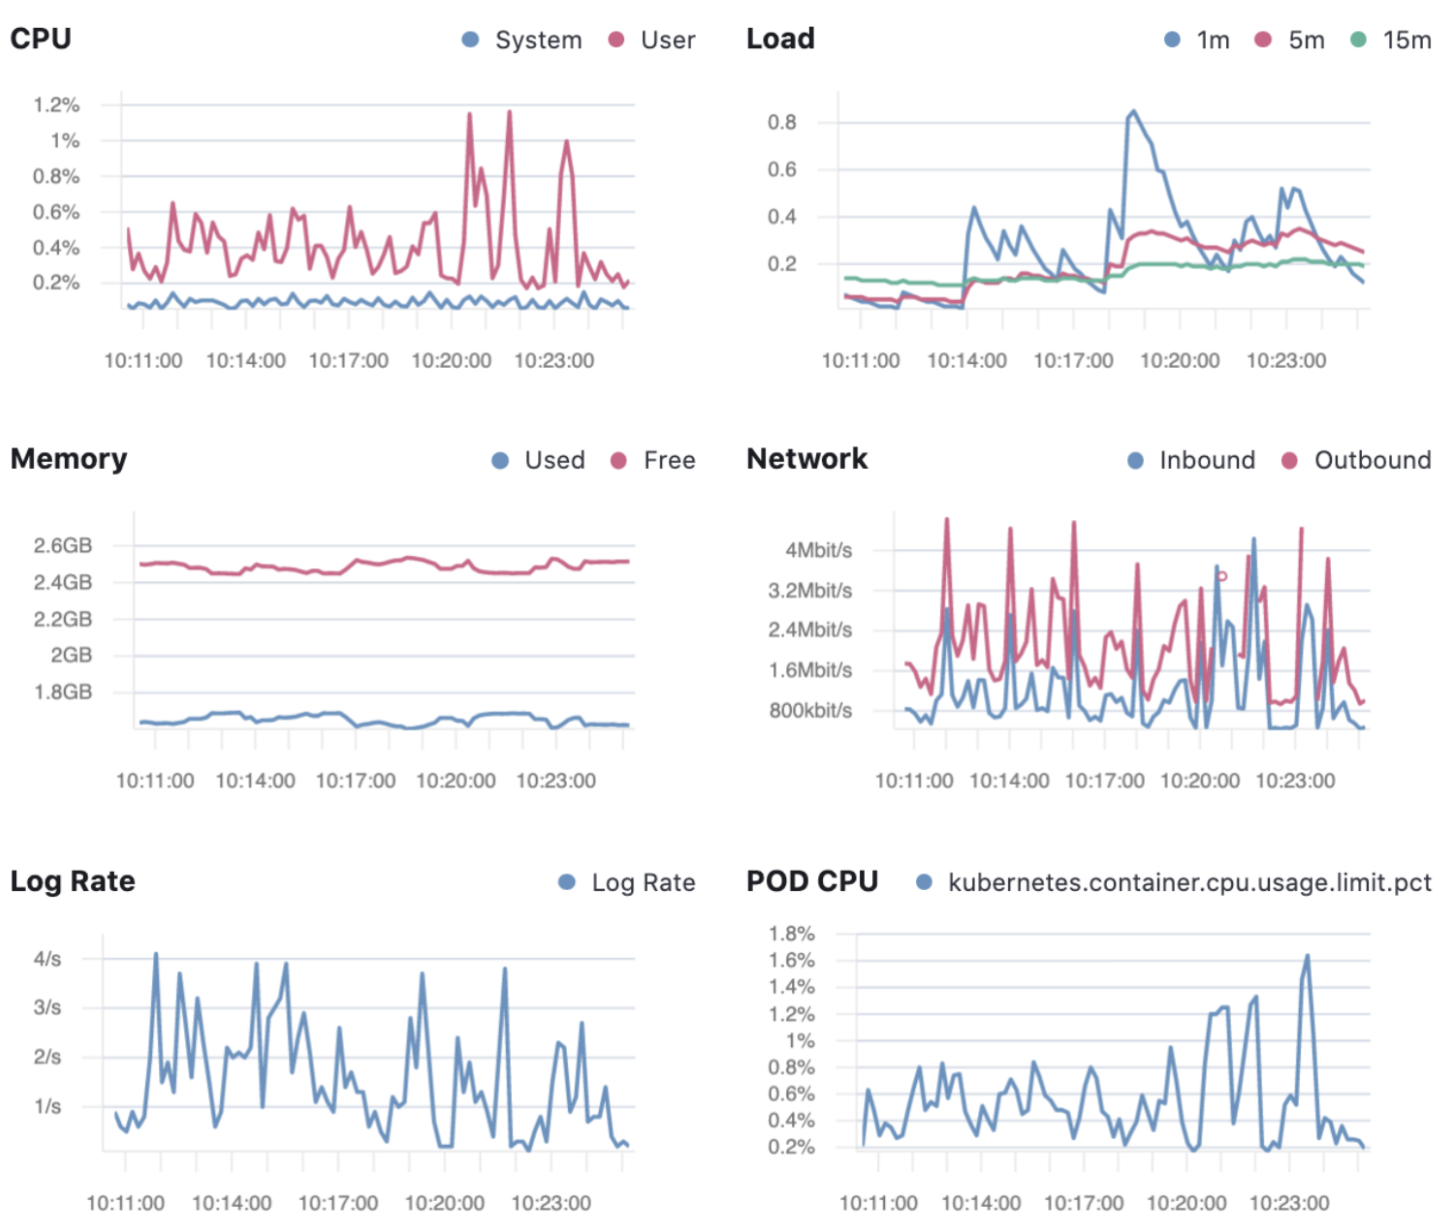
The Metrics tab displays CPU, load, memory, and network metrics relating to the host, along with the log rate and any custom metric that you have defined. You can change the time range to view metrics over the last 15 minutes, hour, 3 hours, 24 hours, or over the previous seven days. You can also hover over a specific time period on a chart to compare the various metrics at that given time.
CPU |
Averages of |
Load |
Averages of |
Memory |
For Linux systems, memory used is the average of For non-Linux systems, memory used is the average of |
Network |
Rates of |
Log Rate |
Derivative of the cumulative sum of the document count scaled to a 1 second rate. This metric relies on the same indices as the logs. |
Custom metric |
A chart is displayed for each custom metric that you have added and defined on the Inventory page. |
Logs
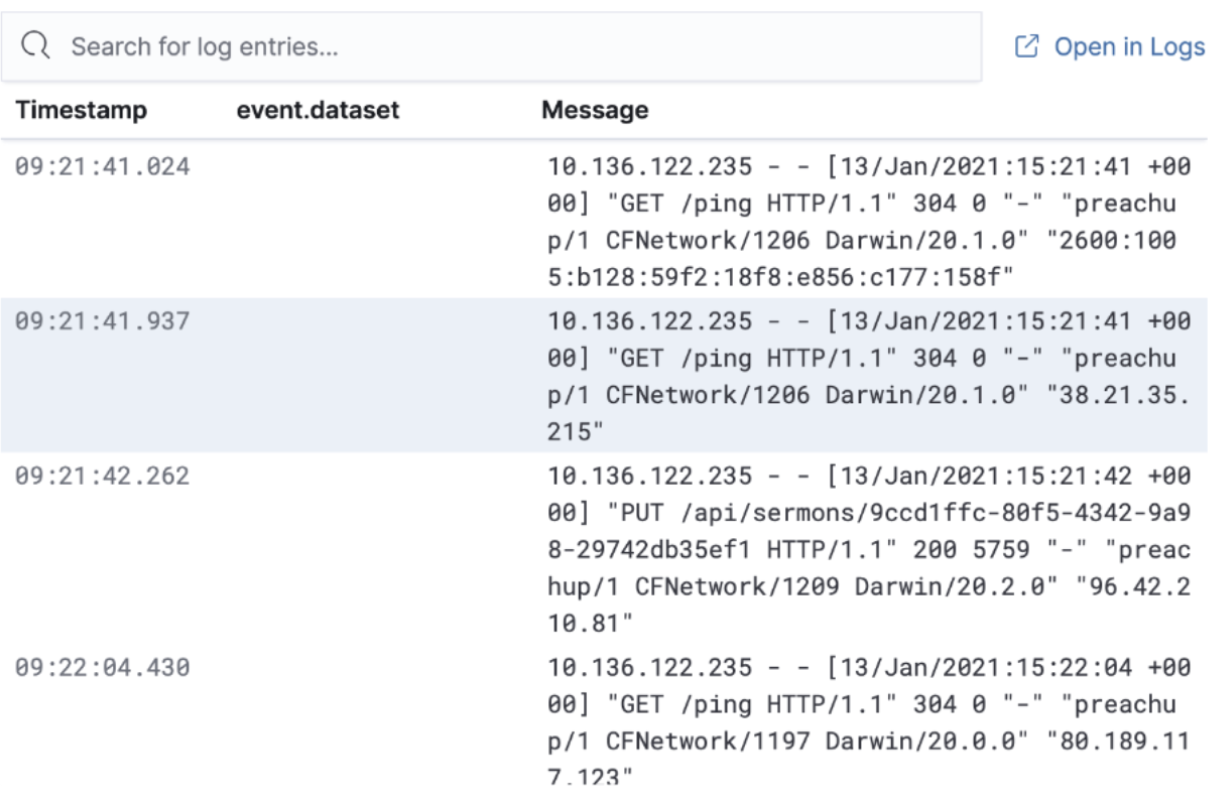
The Logs tab displays logs relating to the host that you have selected. By default, the logs tab displays the following columns.
Timestamp |
The timestamp of the log entry from the |
Message |
The message extracted from the document.
The content of this field depends on the type of log message.
If no special log message type is detected, the Elastic Common Schema (ECS)
base field, |
You can customize the logs view by adding a column for an arbitrary field you would like to filter by. For more information, see Customize Stream. To view the logs in the Logs app for a detailed analysis, click Open in Logs.
Processes
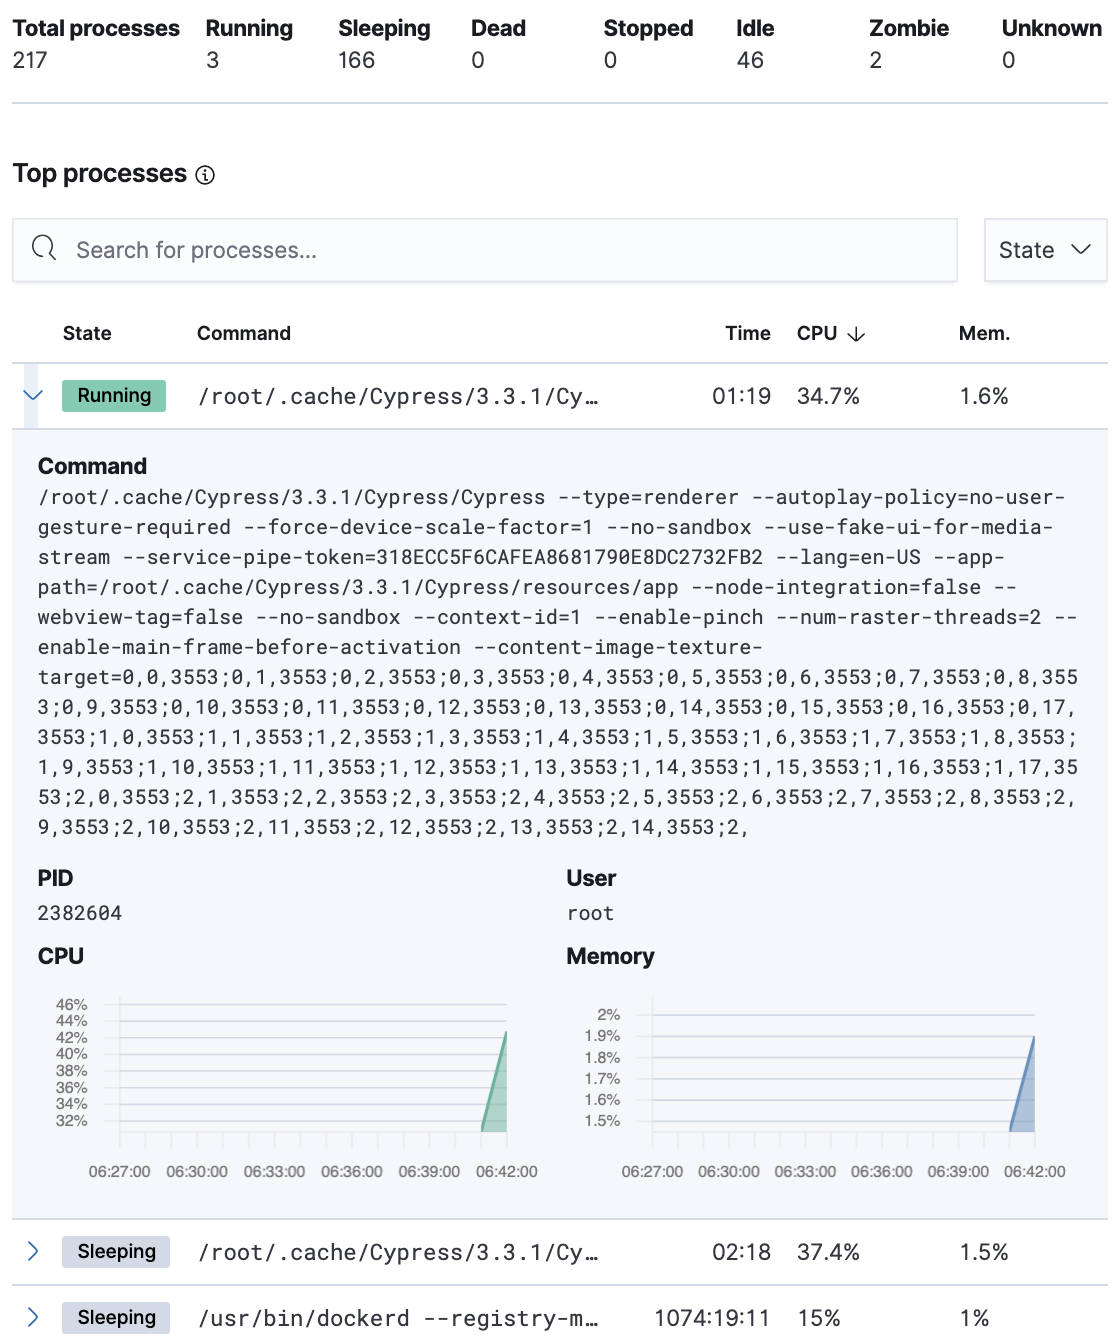
The Processes tab lists the total number of processes (system.process.summary.total) running on the host,
along with the total number of processes in these various states:
-
Running (
system.process.summary.running) -
Sleeping (
system.process.summary.sleeping) -
Stopped (
system.process.summary.stopped) -
Idle (
system.process.summary.idle) -
Dead (
system.process.summary.dead) -
Zombie (
system.process.summary.zombie) -
Unknown (
system.process.summary.unknown)
The processes listed in the Top processes table are based on an aggregation of the top CPU and the top memory consuming processes.
The number of top processes is controlled by process.include_top_n.by_cpu and process.include_top_n.by_memory.
Command |
Full command line that started the process, including the absolute path to the executable, and all the arguments ( |
PID |
Process id ( |
User |
User name ( |
CPU |
The percentage of CPU time spent by the process since the last event ( |
Time |
The time the process started ( |
Memory |
The percentage of memory ( |
State |
The current state of the process and the total number of processes ( |
Metadata
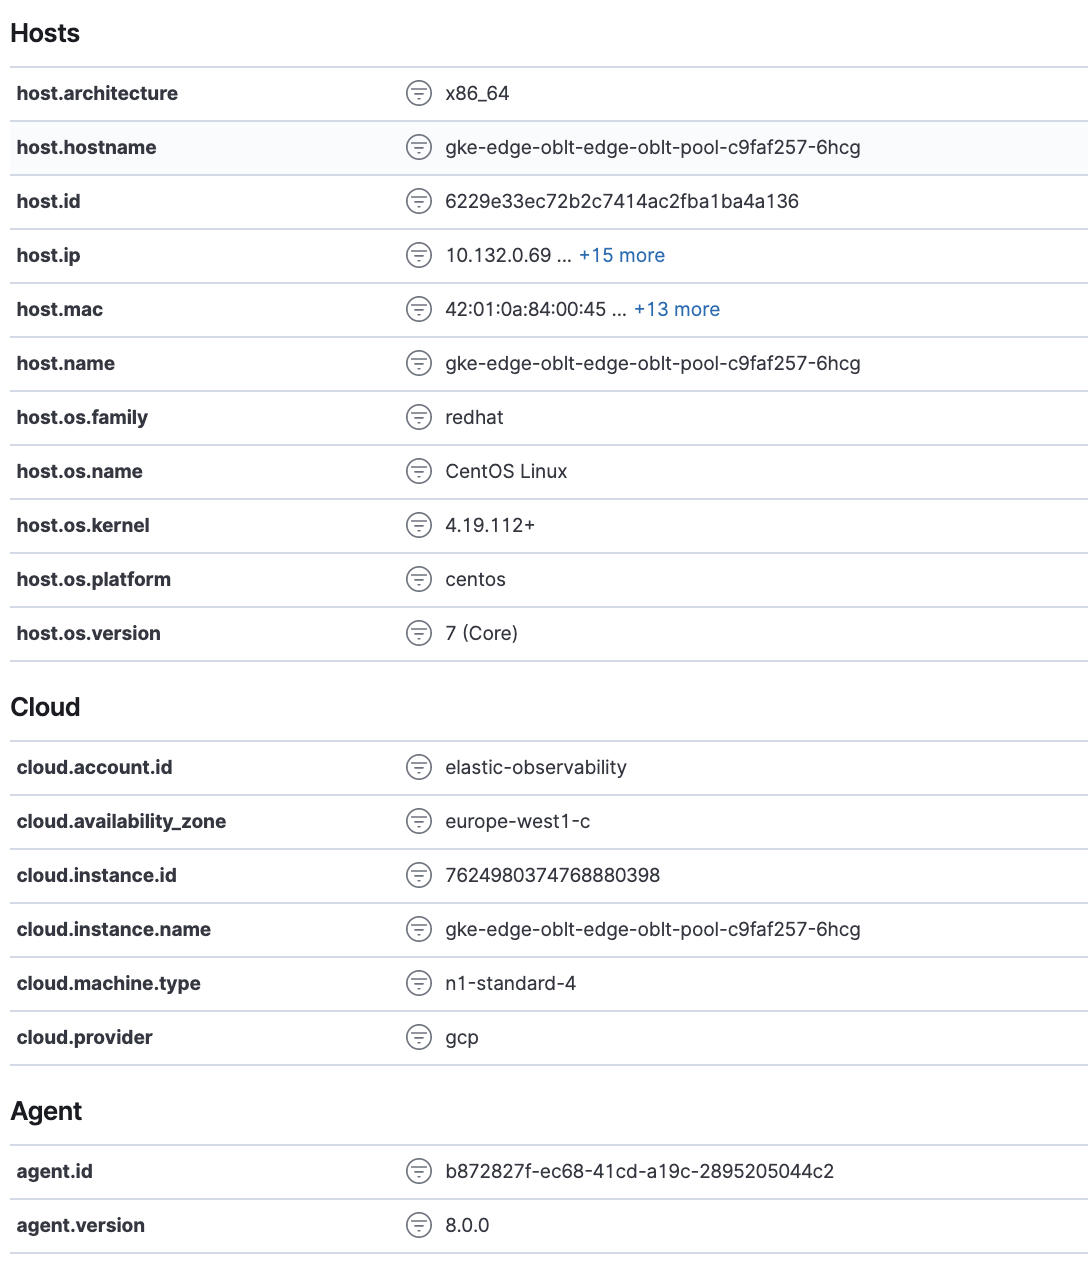
The Metadata tab lists all the meta information relating to the host:
- Host information
- Cloud information
- Agent information
All of this information can help when investigating events—for example, filtering by operating system or architecture.
Anomalies
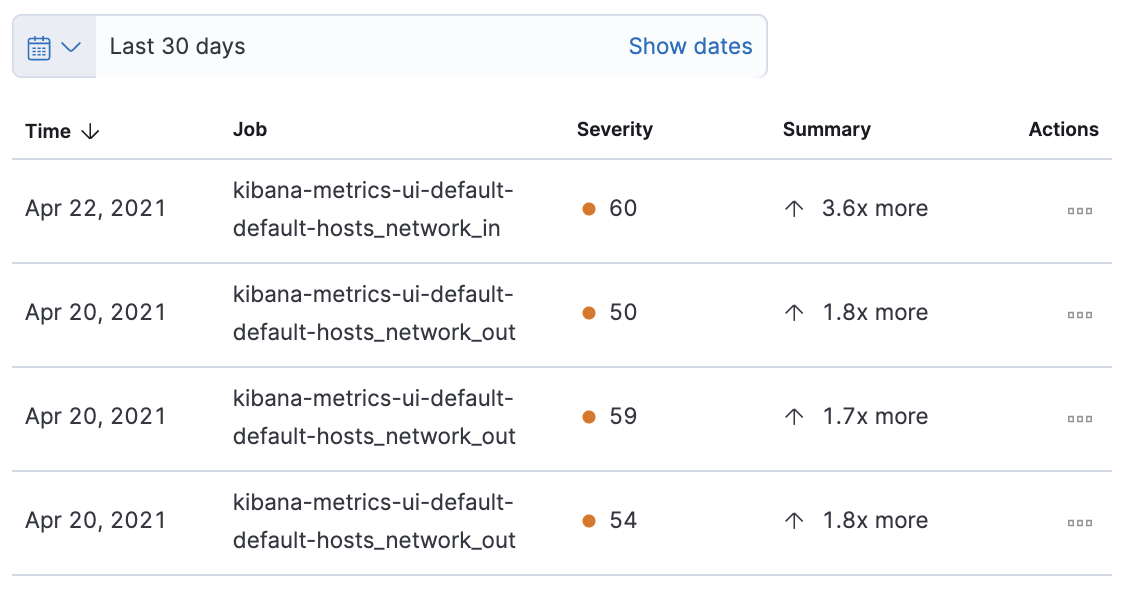
The Anomalies table displays a list of each single metric anomaly detection job for the specific host. By default, anomaly jobs are sorted by time to show the most recent job.
Along with the name of each anomaly job, detected anomalies with a severity score equal to 50, or higher, are listed. These scores represent a severity of "warning" or higher in the selected time period. The summary value represents the increase between the actual value and the expected ("typical") value of the host metric in the anomaly record result.
To drill down and analyze the metric anomaly, select Actions > Open in Anomaly Explorer to view the Anomaly Explorer in Machine Learning. You can also select Actions > Show in Inventory to view the host Inventory page, filtered by the specific metric.
Osquery
You must have an active Elastic Agent with an assigned agent policy that includes the Osquery Manager integration and have Osquery Kibana privileges as a user.
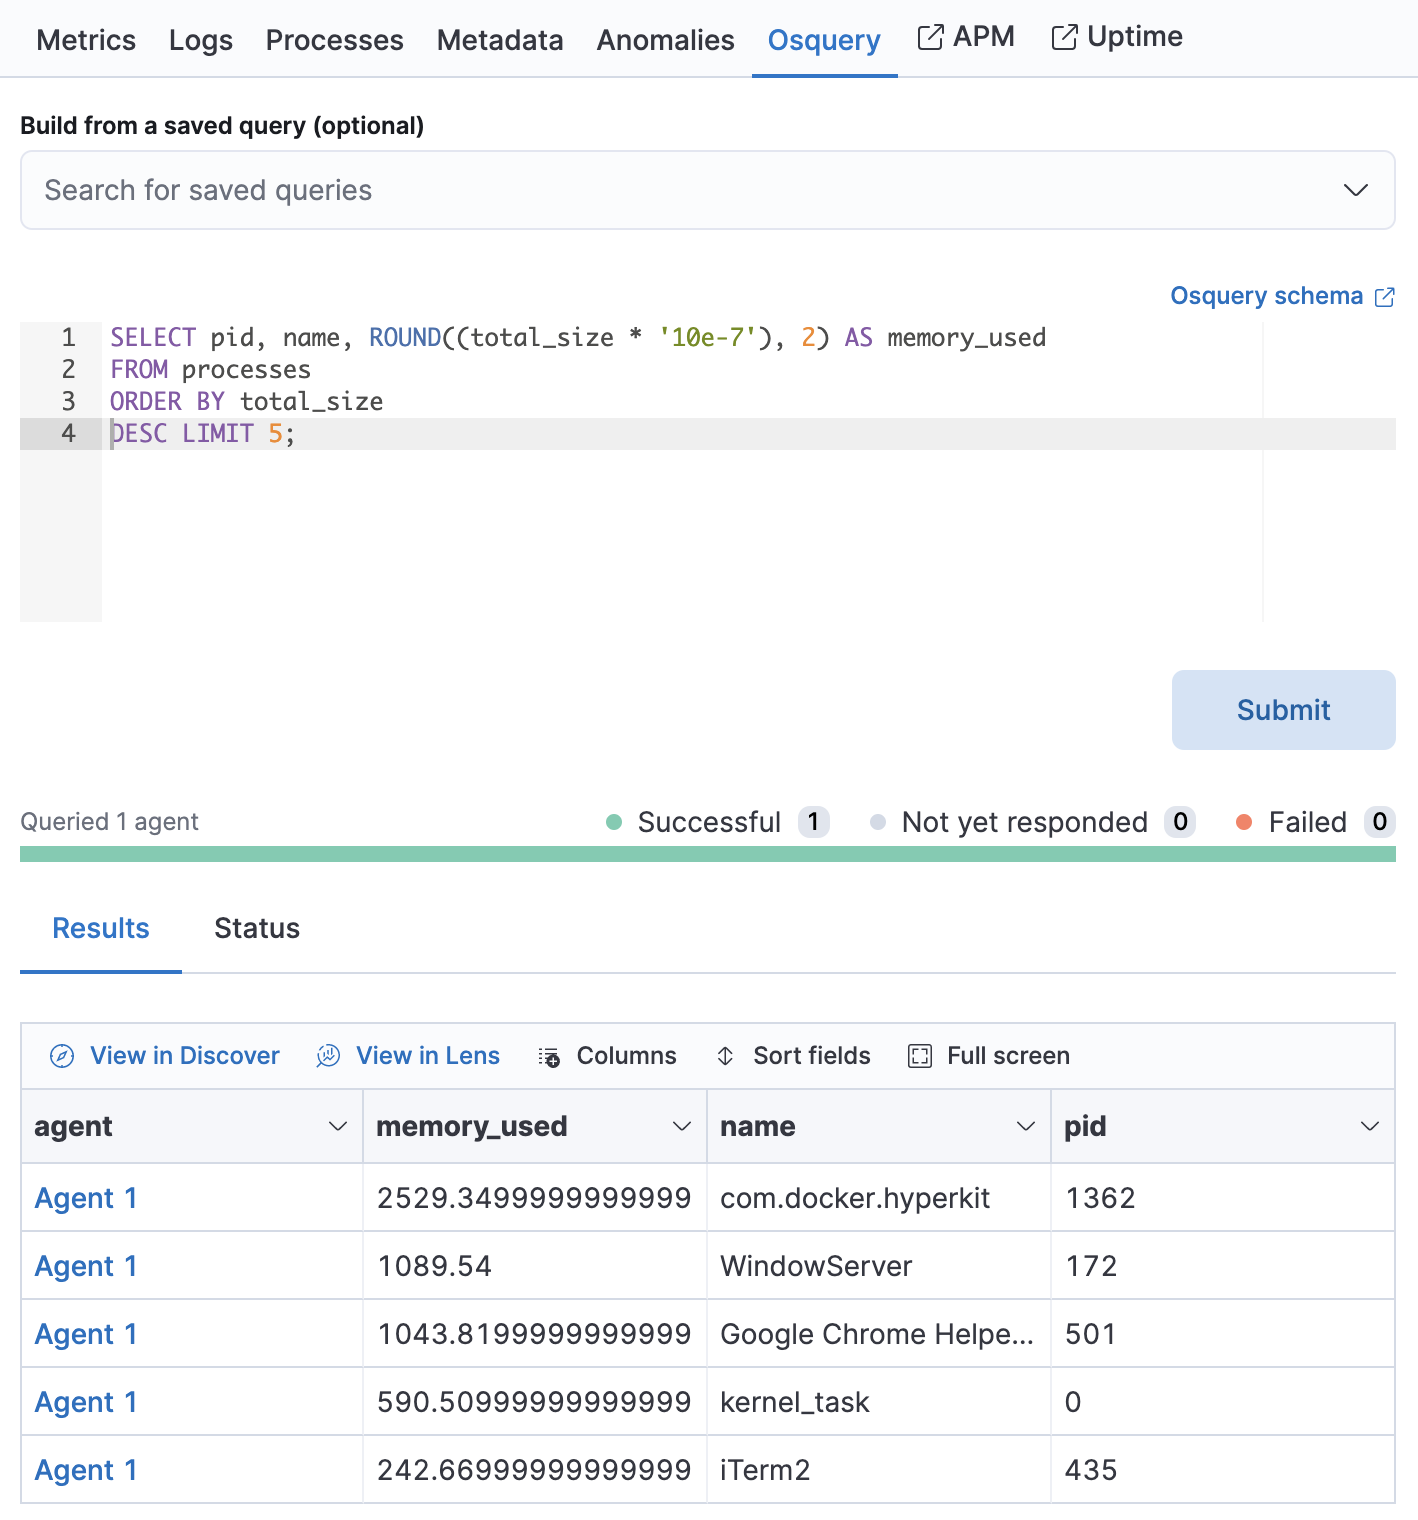
The Osquery tab allows you to build SQL statements to query your host data. You can create and run live or saved queries against the Elastic Agent. Osquery results are stored in Elasticsearch so that you can use the Elastic Stack to search, analyze, and visualize your host metrics. To create saved queries and add scheduled query groups, see Osquery.
In the example above, we query for the top 5 memory hogs running on the host.
Under the Results tab, the total virtual memory size (total_size renamed to
memory_used to be a little more user friendly) is returned in descending order,
along with the process ID (pid), and the process path (name).
To view more information about the query, click the Status tab. A query status can result in
success, error (along with an error message), or pending (if the Elastic Agent is offline).
Other options include:
- View in Discover to search, filter, and view information about the structure of host metric fields. To learn more, see Discover.
- View in Lens to create visualizations based on your host metric fields. To learn more, see Lens.
- View the results in full screen mode.
- Add, remove, reorder, and resize columns.
- Sort field names in ascending or descending order.