View infrastructure metrics
editView infrastructure metrics
editThe Inventory page provides a metrics-driven view of your entire infrastructure grouped by the resources that you are monitoring. All monitored resources emitting a core set of infrastructure metrics are displayed to give you a quick view of the overall health of your infrastructure.
To access this page, go to Observability > Metrics. The Inventory page is displayed by default.
An overview of the hosts that you are monitoring and the current CPU usage for each host are displayed in a waffle map of one or more rectangular grids. Alternatively, you can change this map view to a table view.
Without leaving the Inventory page, you can view enhanced metrics relating to each host running in your infrastructure. On the waffle map, select the host to display the host metrics overlay. For more information, see Host details.
Filter related resources
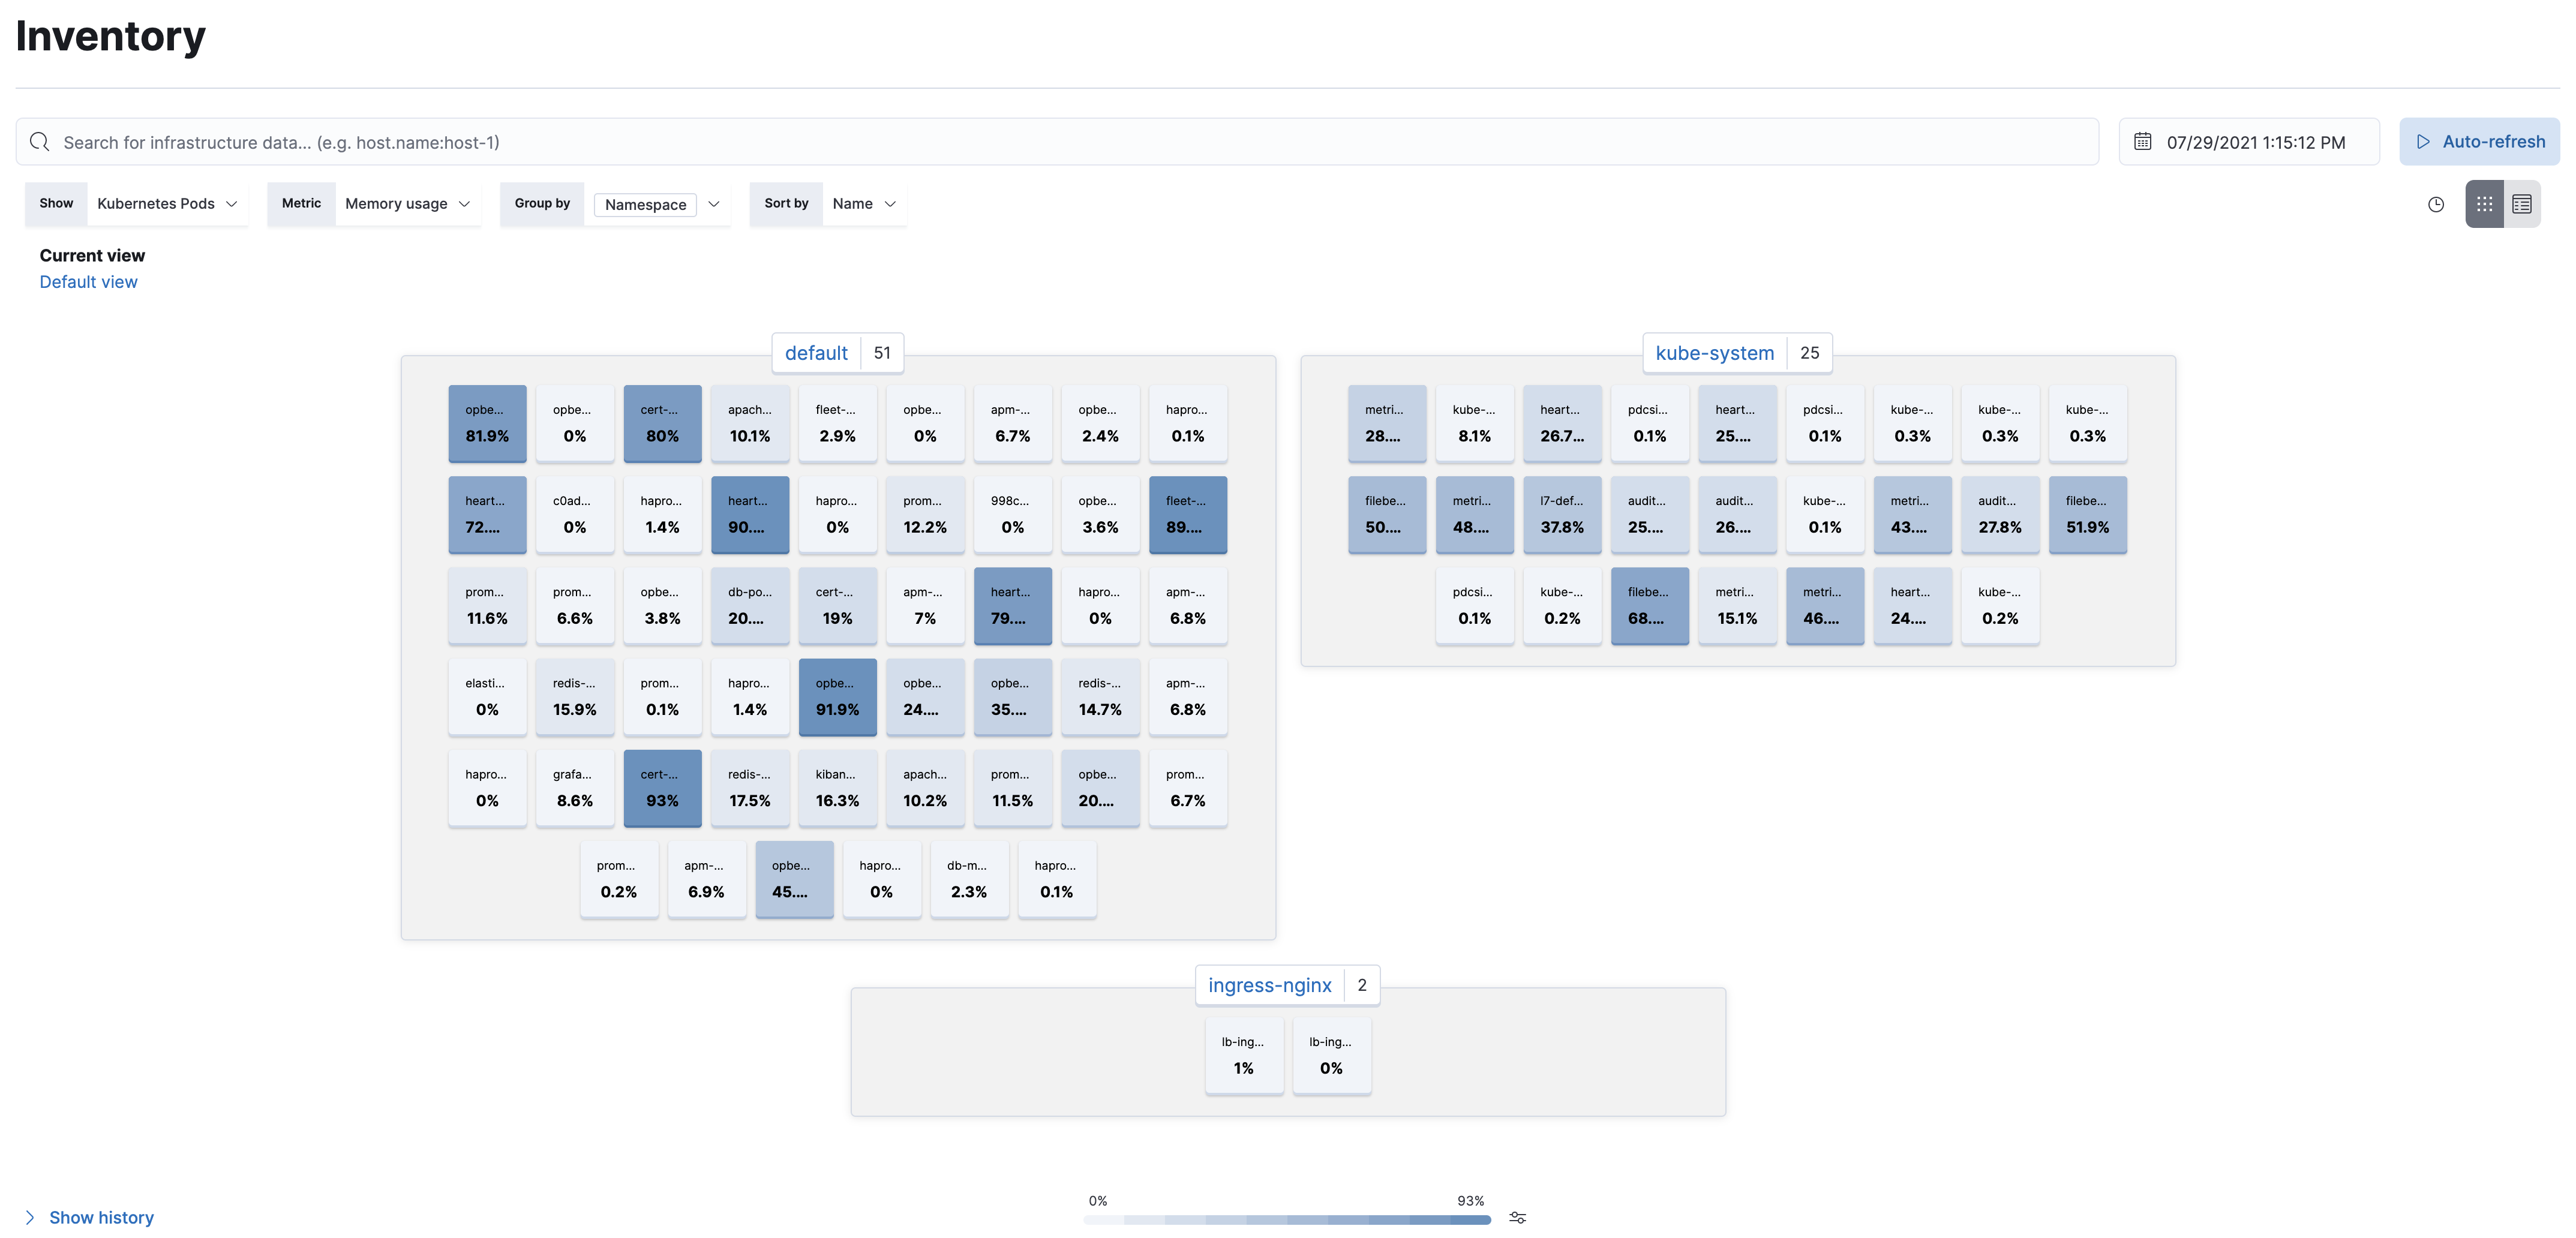
editTo help you get started with your analysis faster, you can change the high-level view from hosts to Kubernetes pods, Docker containers, or AWS, which includes EC2 instances, S3 buckets, RDS databases, and SQS queues. When you hover over each resource, the metrics specific to that resource are displayed.
You can sort by resource, group the resource by specific fields related to it, and sort by either name or metric value. For example, you can filter the view to display the memory usage of your Kubernetes pods, grouped by namespace, and sorted by the memory usage value.
You can also use the search bar to create structured queries using Kibana Query Language.
For example, enter host.hostname : "host1" to see only the information for host1.
To examine the metrics for a specific time, use the time filter to select the date and time.
Add custom metrics
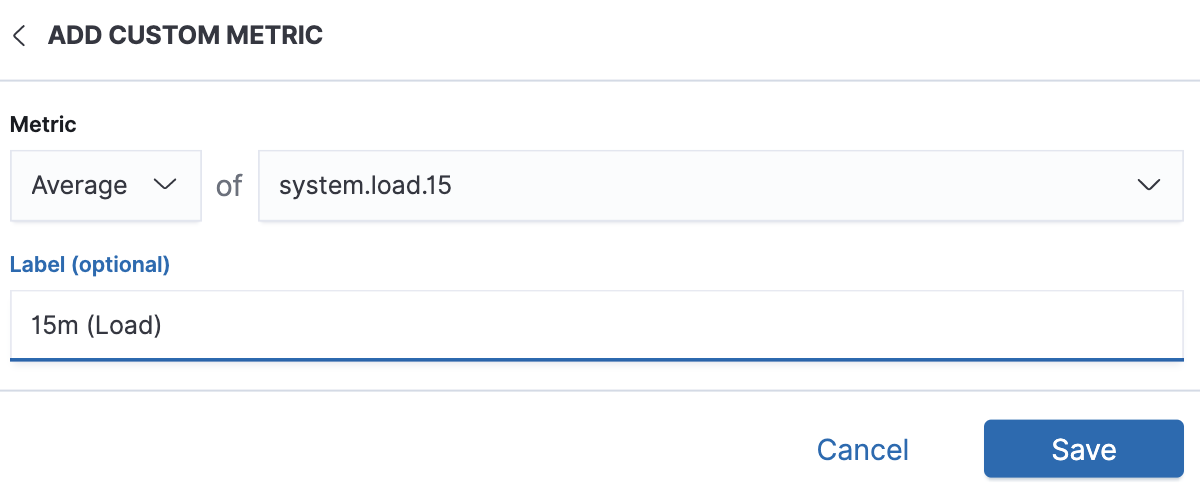
editIf the predefined metrics displayed on the Inventory page for each resource are not sufficient for your specific use case, you can add and define custom metrics.
Select your resource, and from the Metrics view filter, click Add metric.
You can also group your resources by custom fields. Select your resource, and then click Group by > Custom field.
Analyze resource metrics
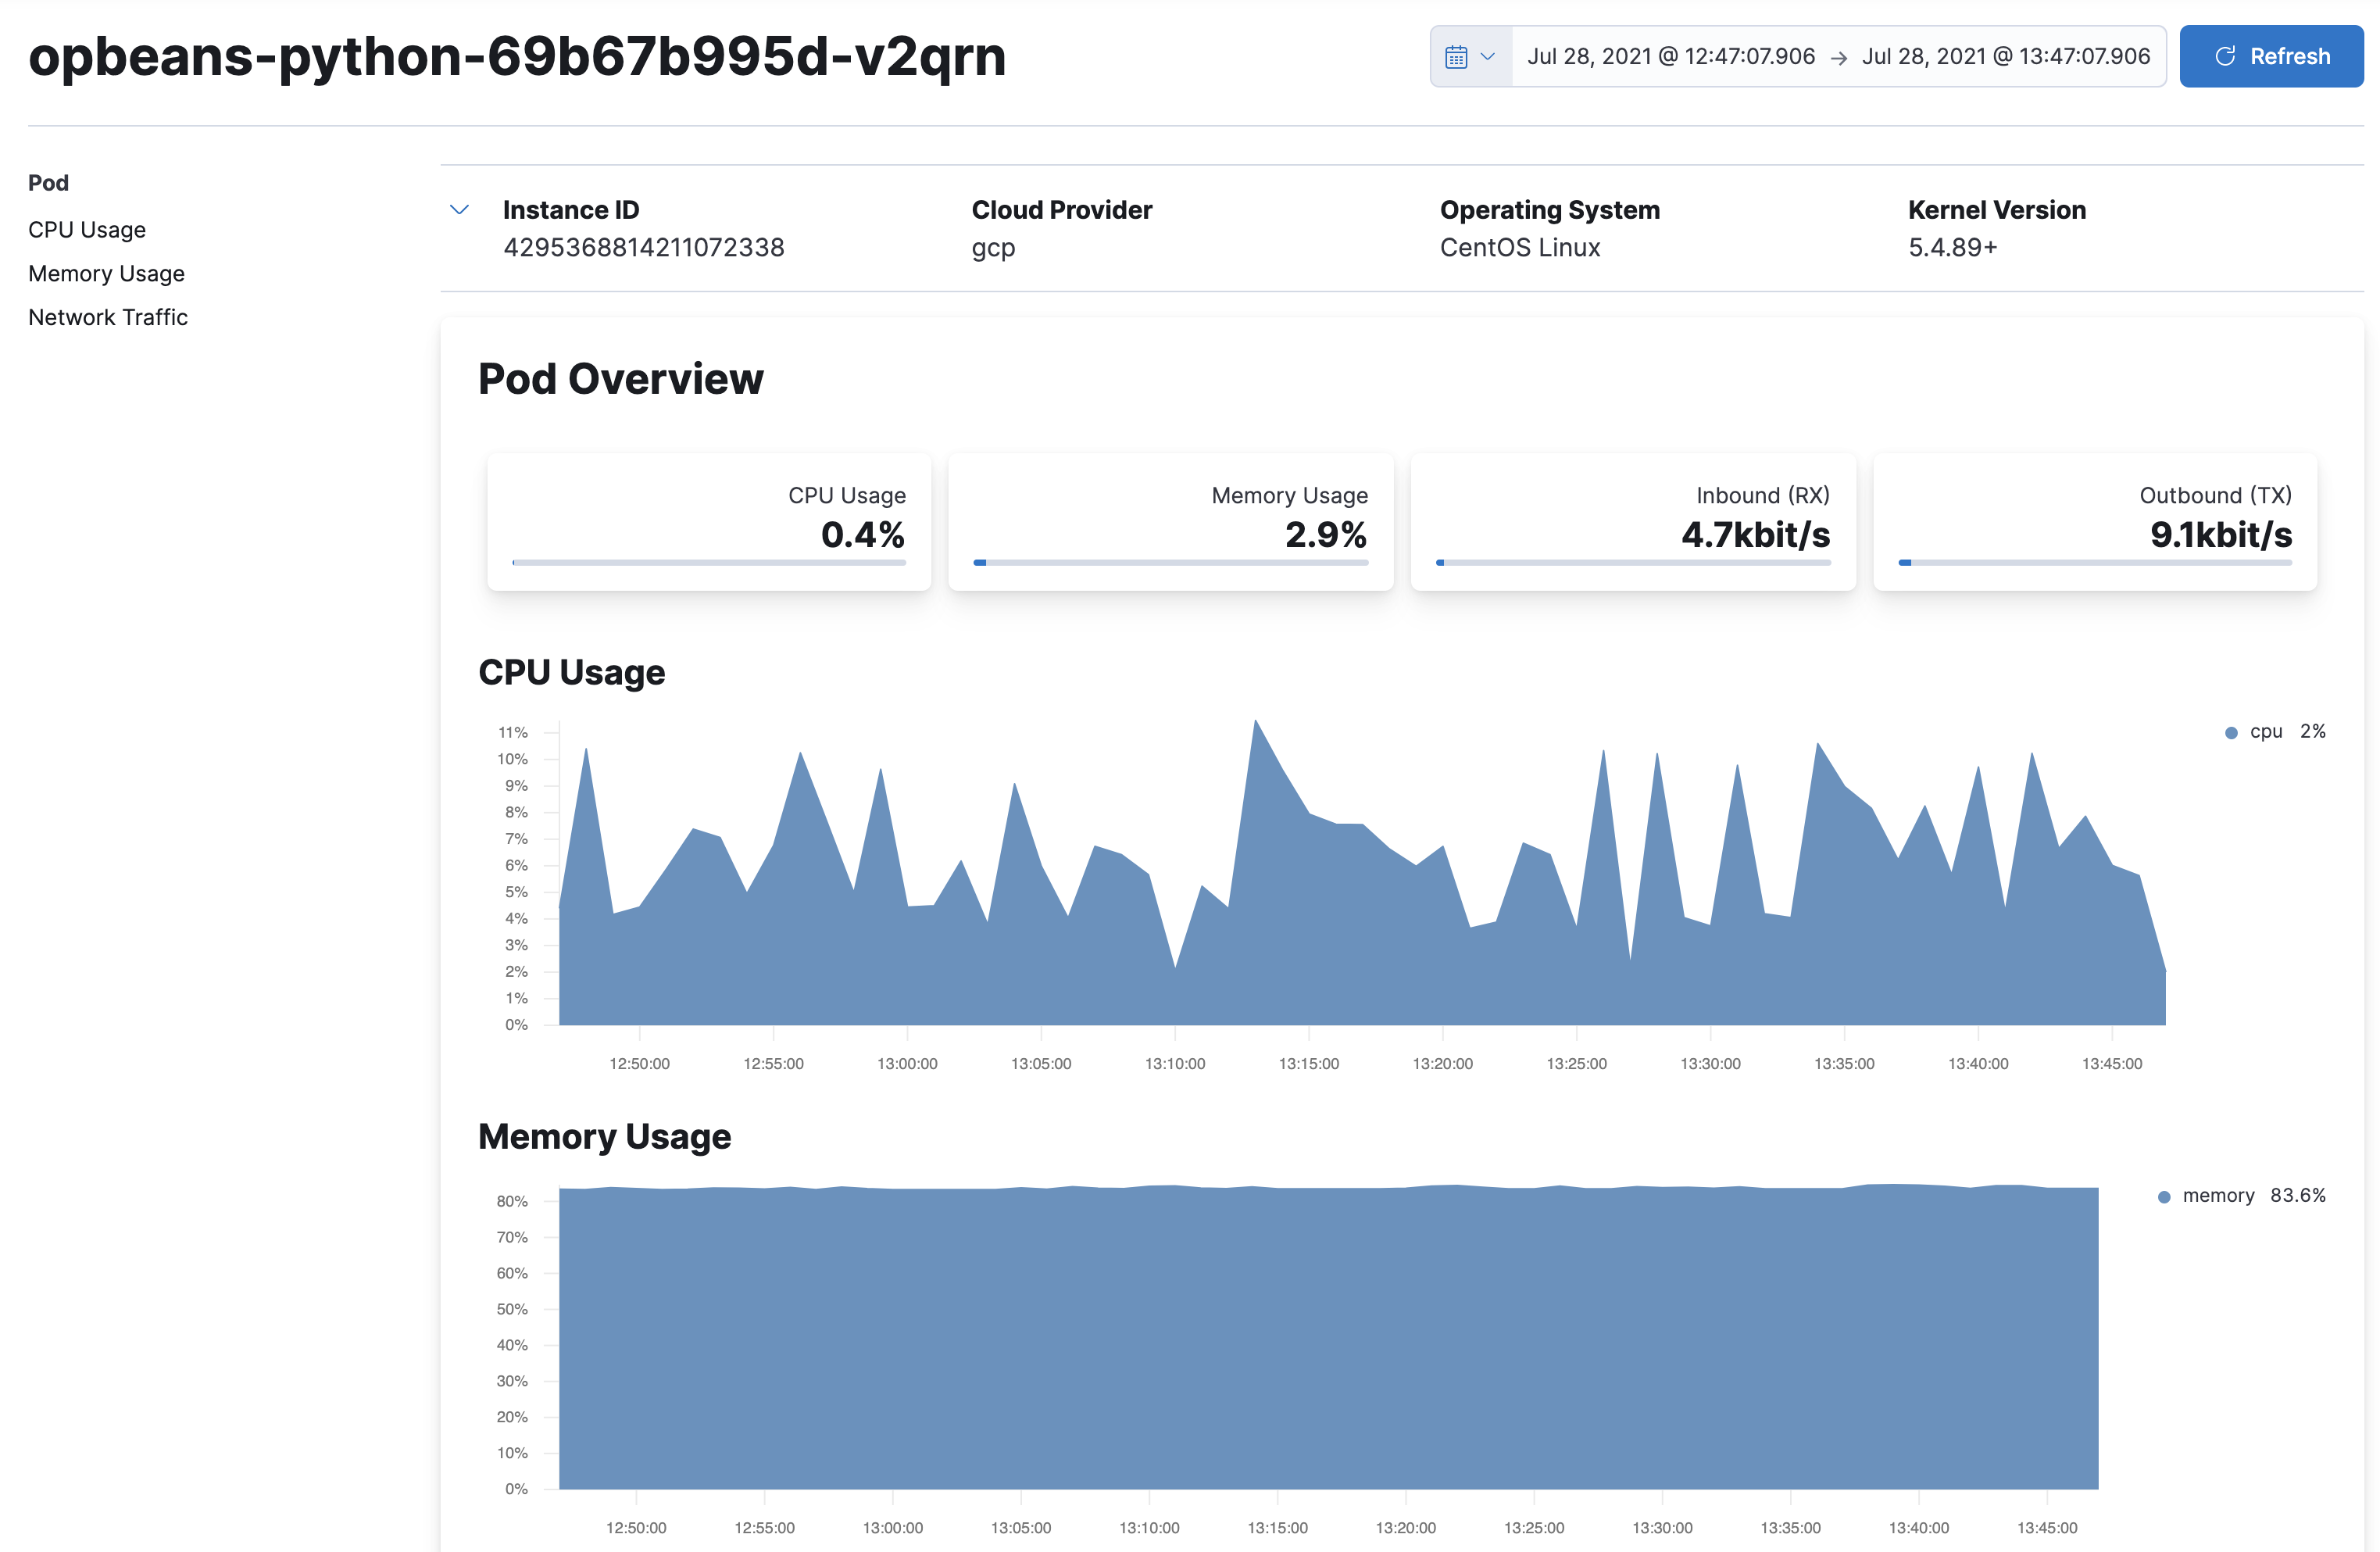
editWhen you have searched and filtered for a specific resource, you can drill-down to analyze the metrics relating to it. For example, to view the metrics relating to a particular Kubernetes pod, click on the pod displayed in the high-level view, and then select Kubernetes Pod metrics.
Integrate with Logs, Uptime, and APM
editDepending on the features you have installed and configured, you can view logs, traces, or uptime information relating to a specific resource. For example, in the high-level view, when you click a Kubernetes Pod resource, you can choose:
- Kubernetes Pod logs to view corresponding logs in the Logs app.
- Kubernetes Pod APM traces to view corresponding APM traces in the APM app.
- Kubernetes Pod in Uptime to view related uptime information in the Uptime app.