GCP Dataflow templates
editGCP Dataflow templates
editIn this tutorial, you’ll learn how to ship logs directly from the Google Cloud Console with the Dataflow template for analyzing GCP Audit Logs in the Elastic Stack.
What you’ll learn
editYou’ll learn how to:
- Export GCP audit logs through Pub/Sub topics and subscriptions.
- Ingest logs using Google Dataflow and view those logs in Kibana.
Before you begin
editCreate a deployment using our hosted Elasticsearch Service on Elastic Cloud. The deployment includes an Elasticsearch cluster for storing and searching your data, and Kibana for visualizing and managing your data. For more information, see Spin up the Elastic Stack.
Step 1: Install the GCP integration
editYou’ll start with installing the Elastic GCP integration to add pre-built dashboards, ingest node configurations, and other assets that help you get the most of the GCP logs you ingest.
-
Go to Integrations in Kibana and search for
gcp.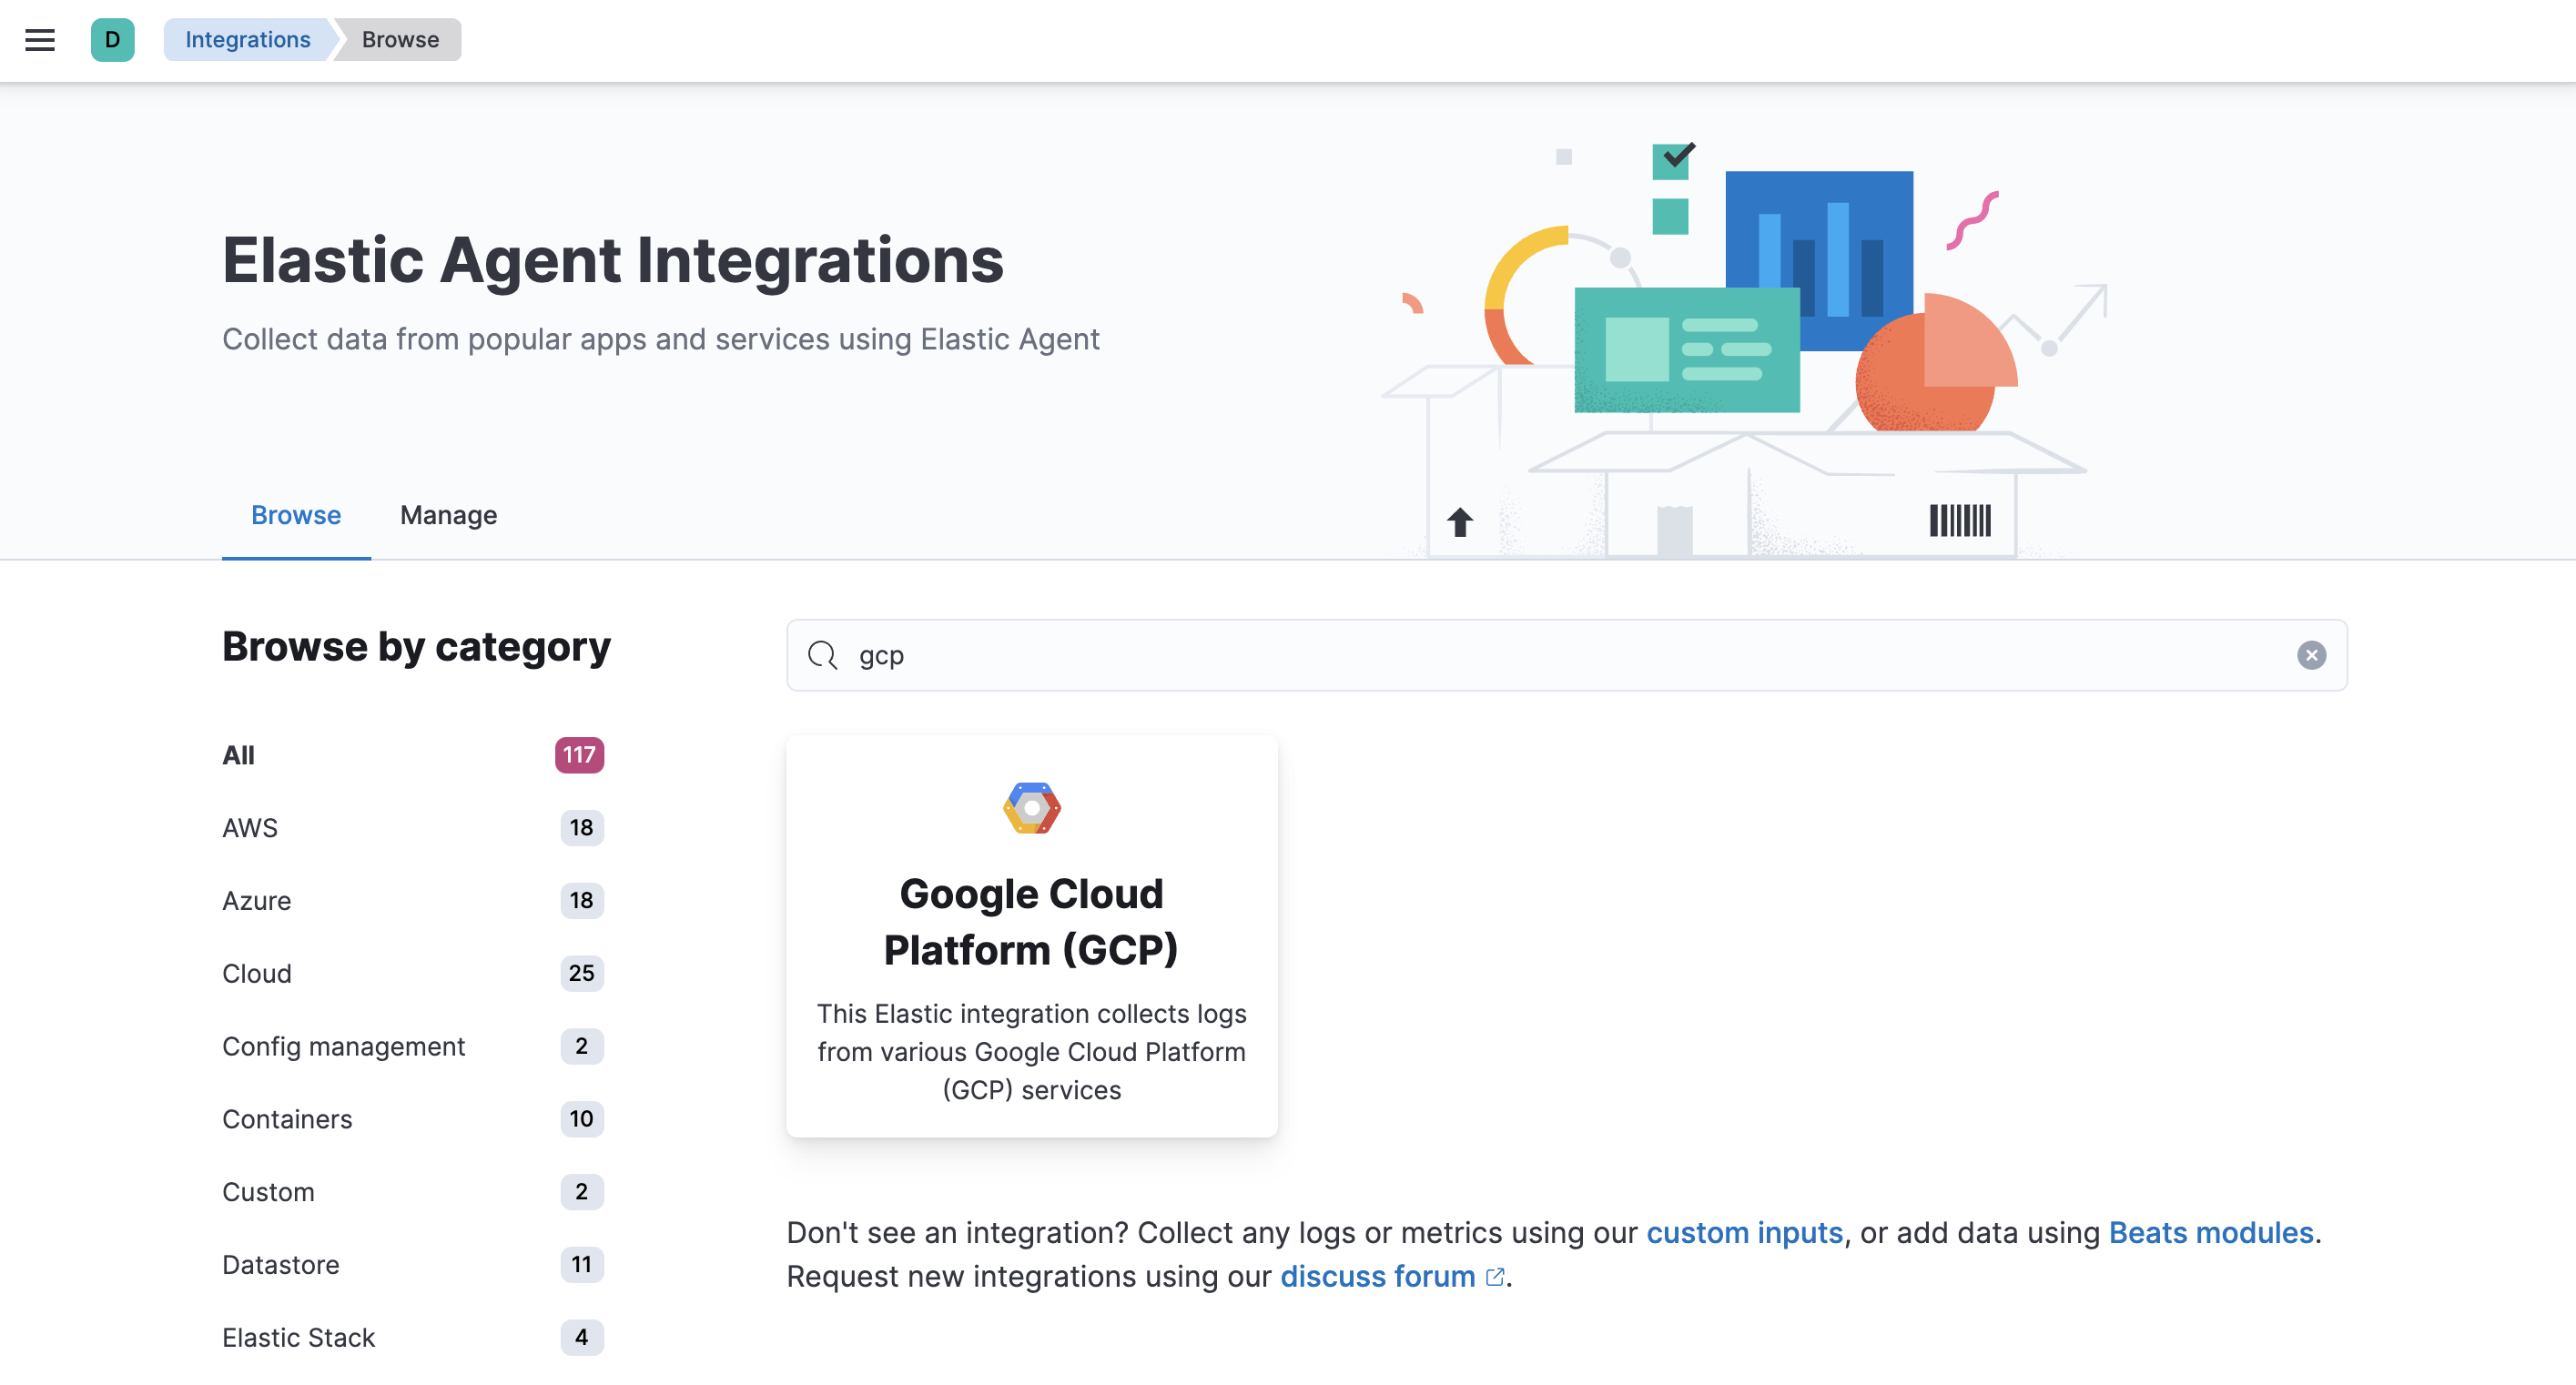
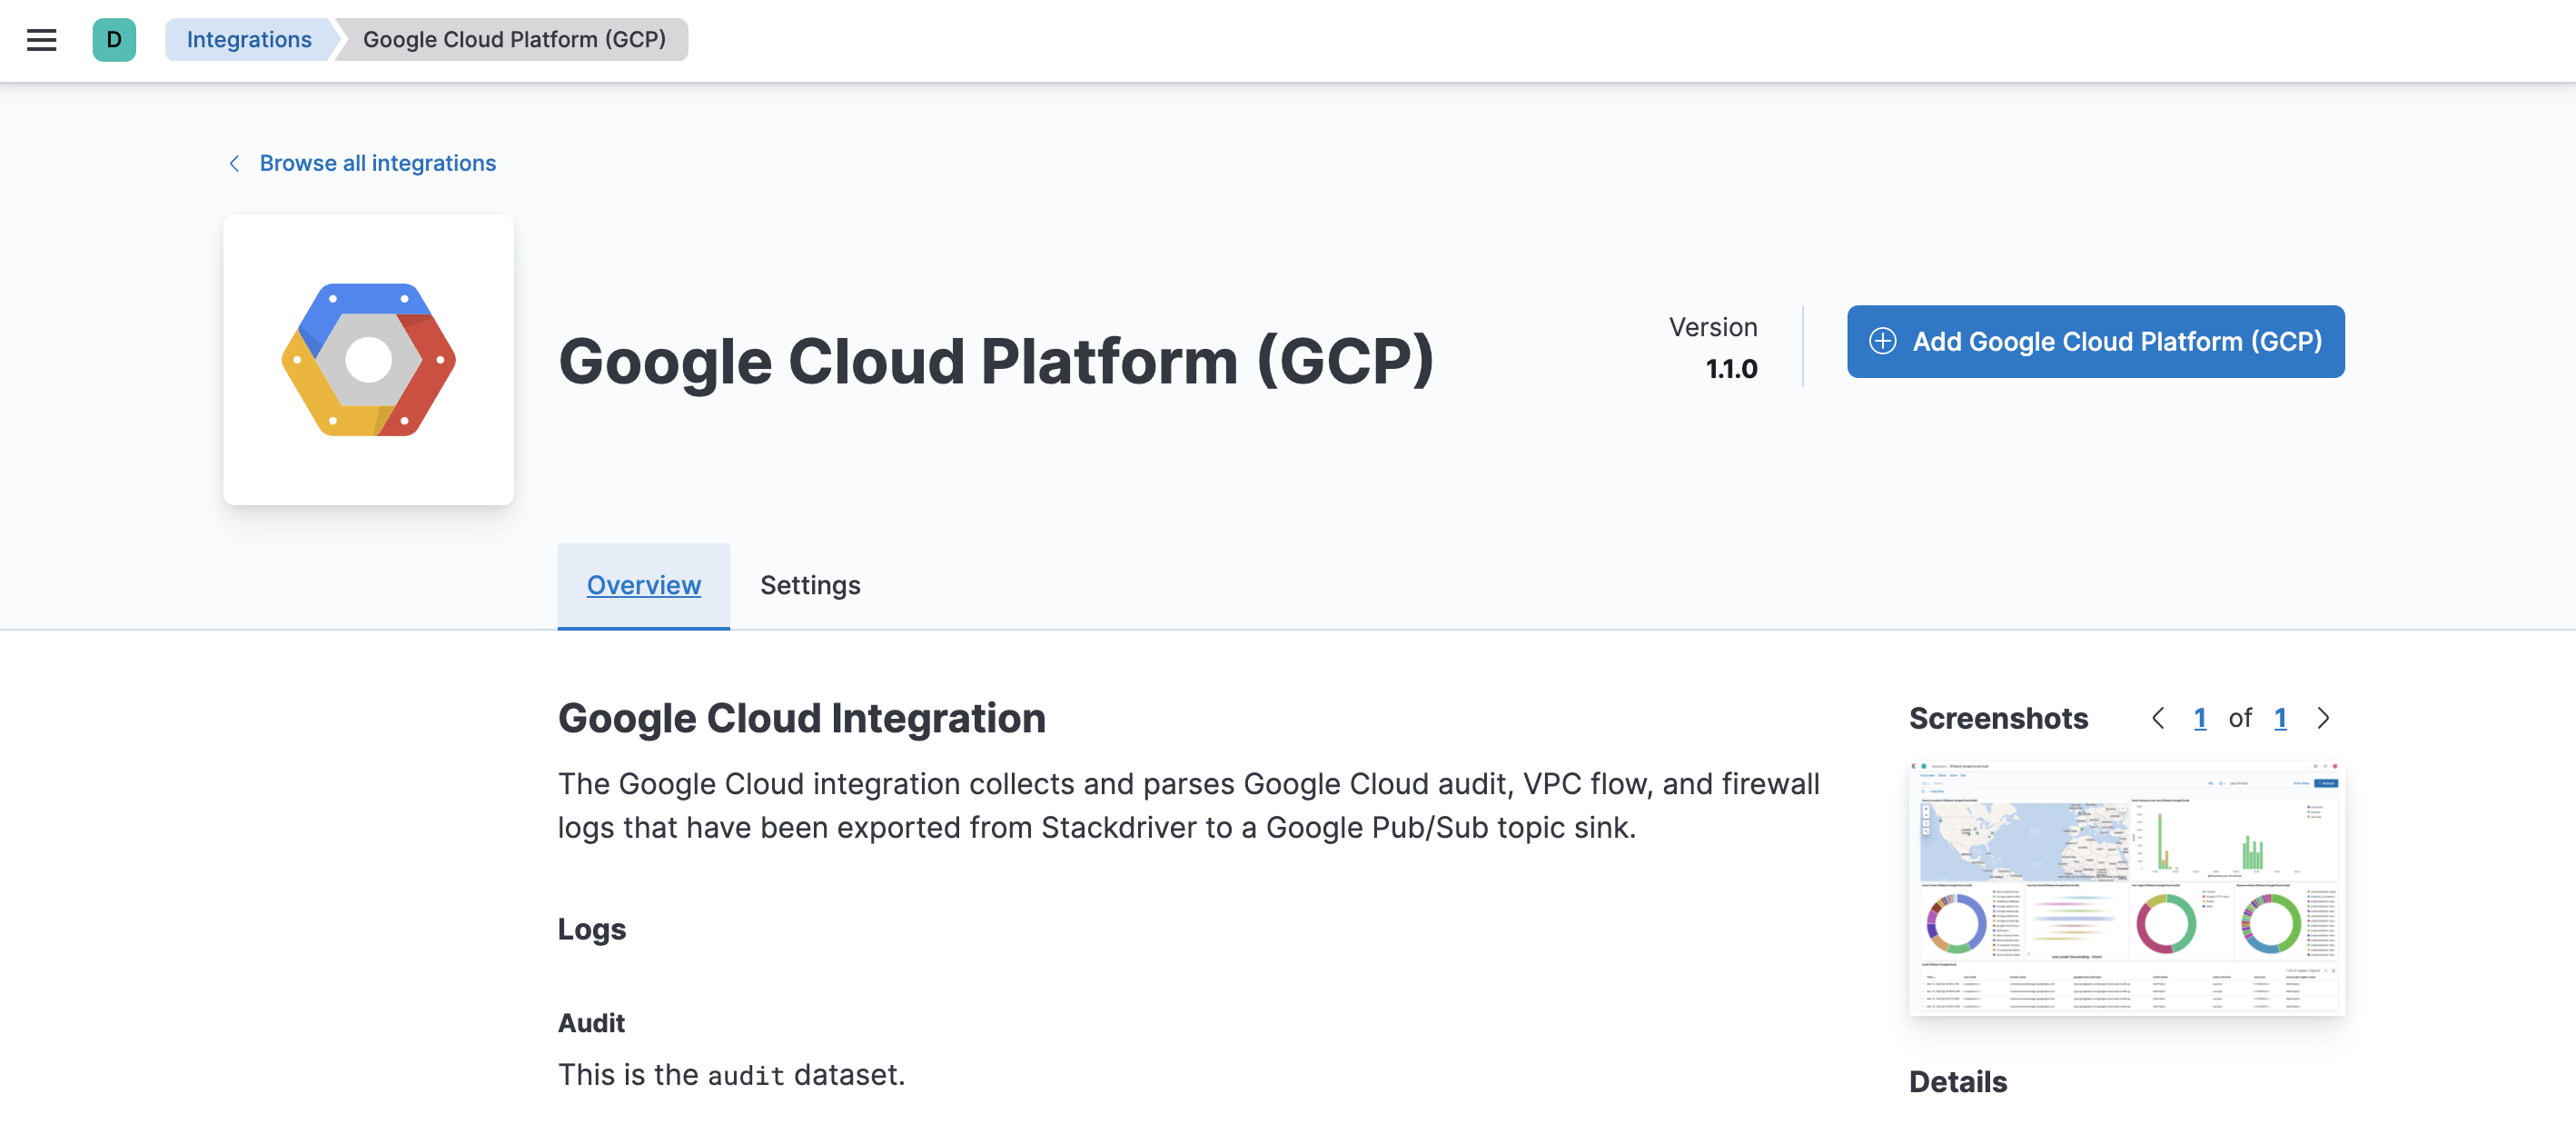
-
Click the Elastic Google Cloud Platform (GCP) integration to see more details about it, then click Add Google Cloud Platform (GCP).
- Click Save integration.
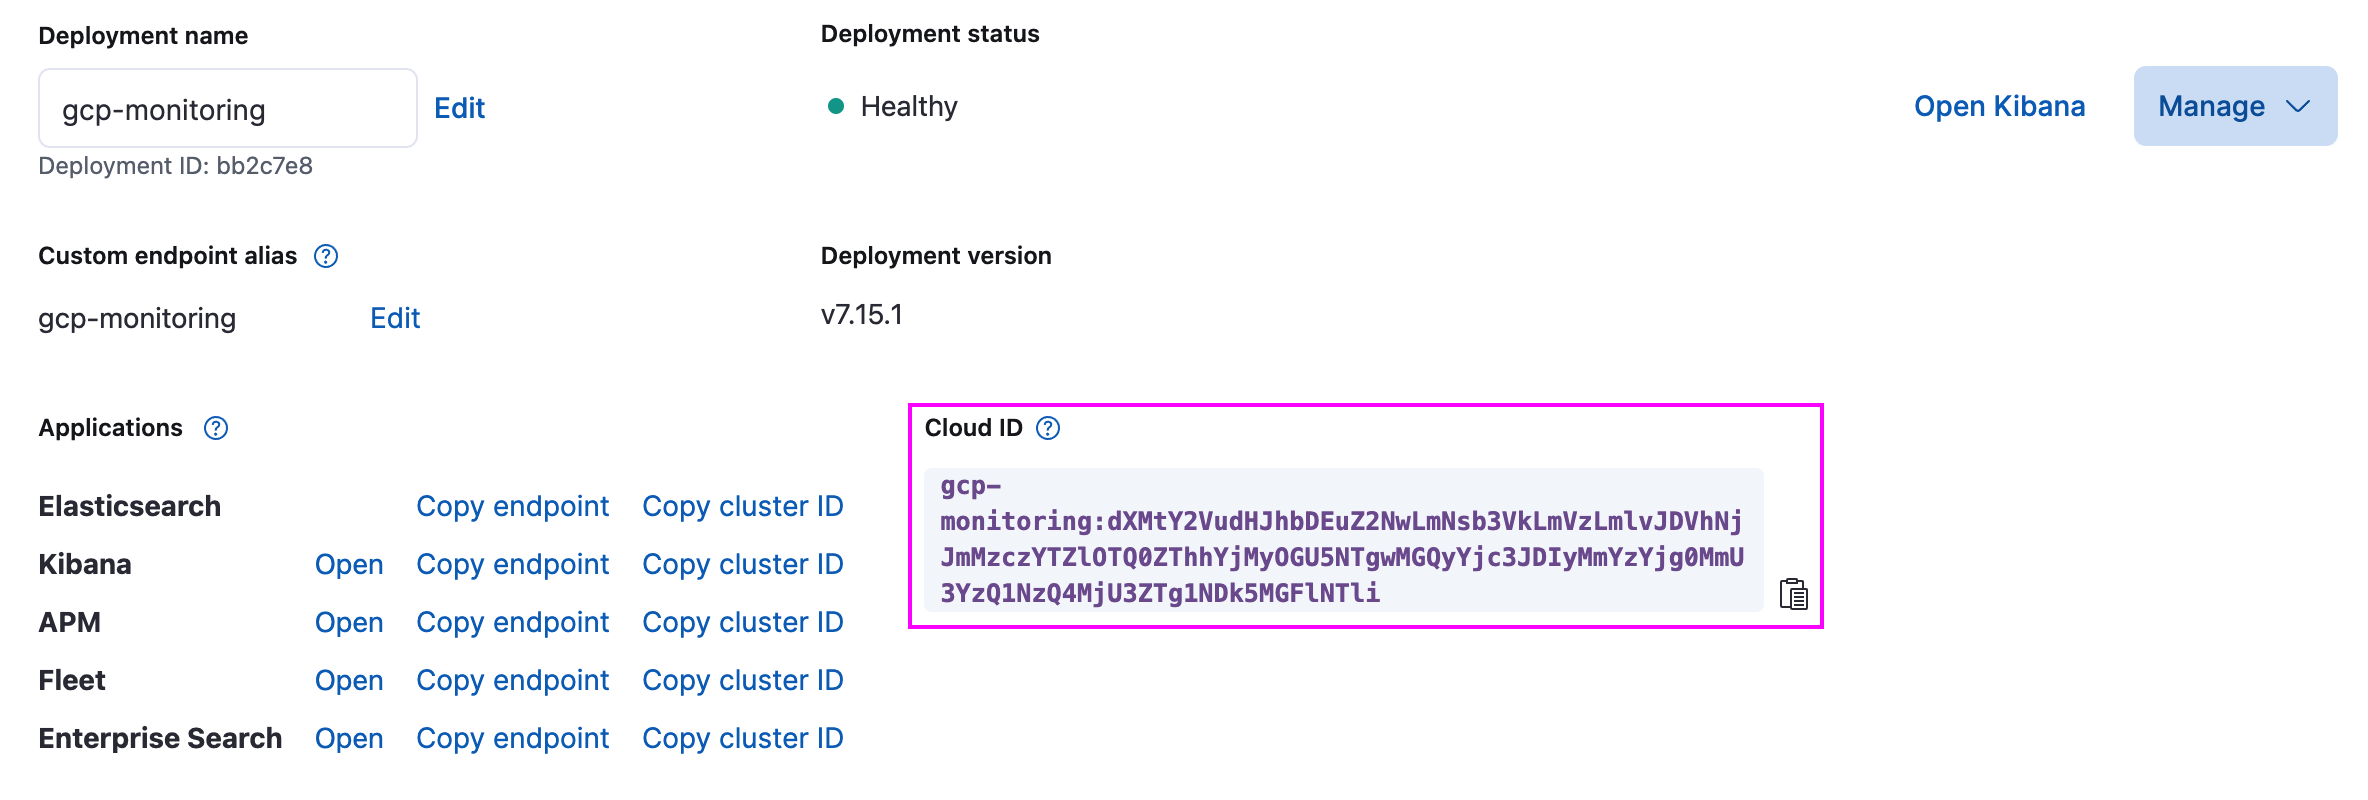
This tutorial assumes the Elastic cluster is already running. To continue, you’ll need your Cloud ID and an API Key.
To find the Cloud ID of your deployment, go to the deployment’s Overview page.
Use Kibana to create a Base64-encoded API key to authenticate on your deployment.
You can optionally restrict the privileges of your API Key; otherwise they’ll
be a point in time snapshot of permissions of the authenticated user.
For this tutorial the data is written to the logs-gcp.audit-default data streams.
Step 2: Create a Pub/Sub topic and subscription
editBefore configuring the Dataflow template, create a Pub/Sub
topic and subscription from your Google Cloud Console where you can send your
logs from Google Operations Suite.
There are three available filesets:
audit, vpcflow, firewall. This tutorial covers the audit fileset.
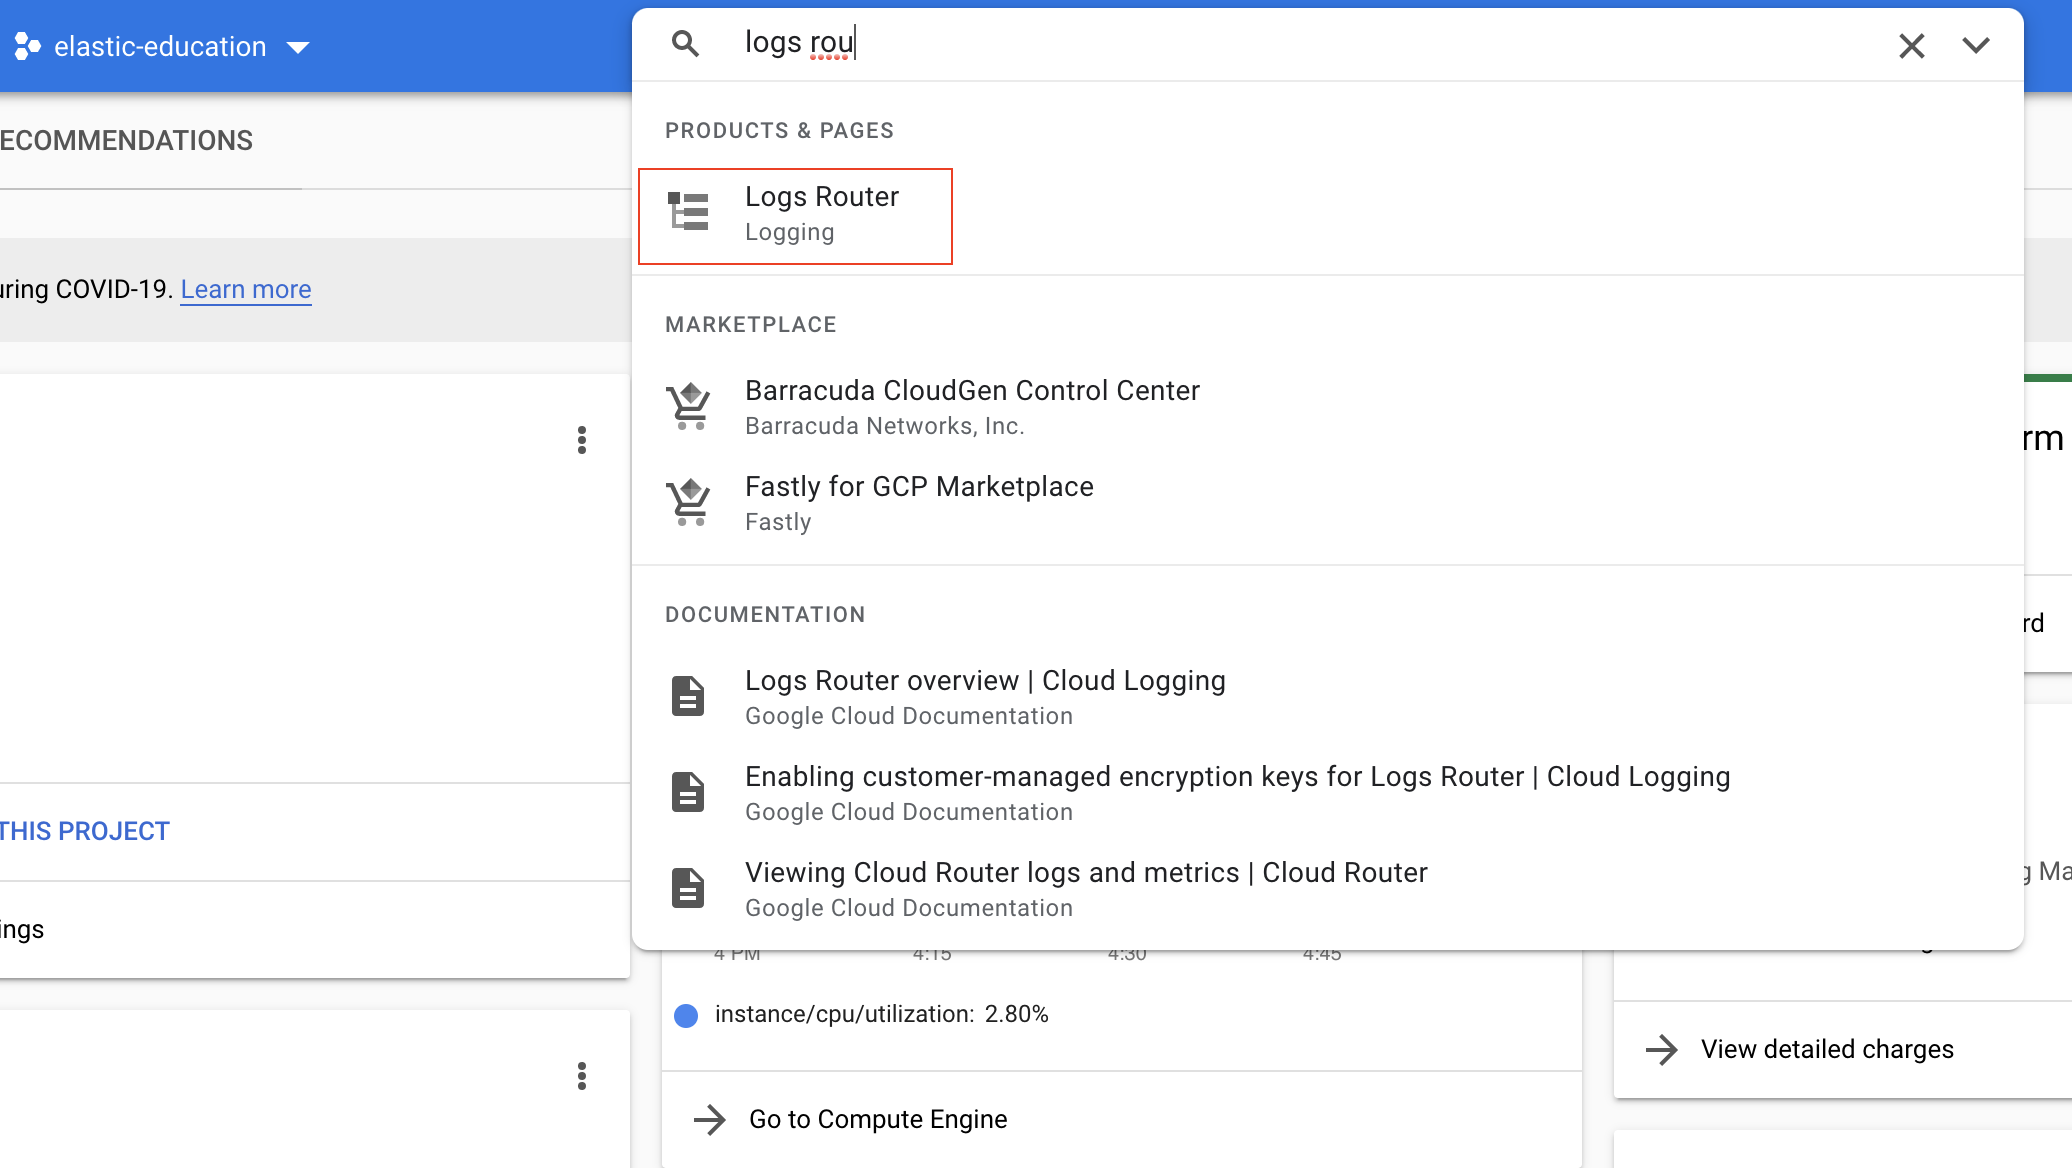
-
Go to the Logs Router page to configure GCP to export logs to a Pub/Sub topic. Use the search bar to find the page:
To set up the logs routing sink, click Create sink. Set sink name as
monitor-gcp-audit-sink. Select the Cloud Pub/Sub topic as the sink service and Create new Cloud Pub/Sub topic namedmonitor-gcp-audit: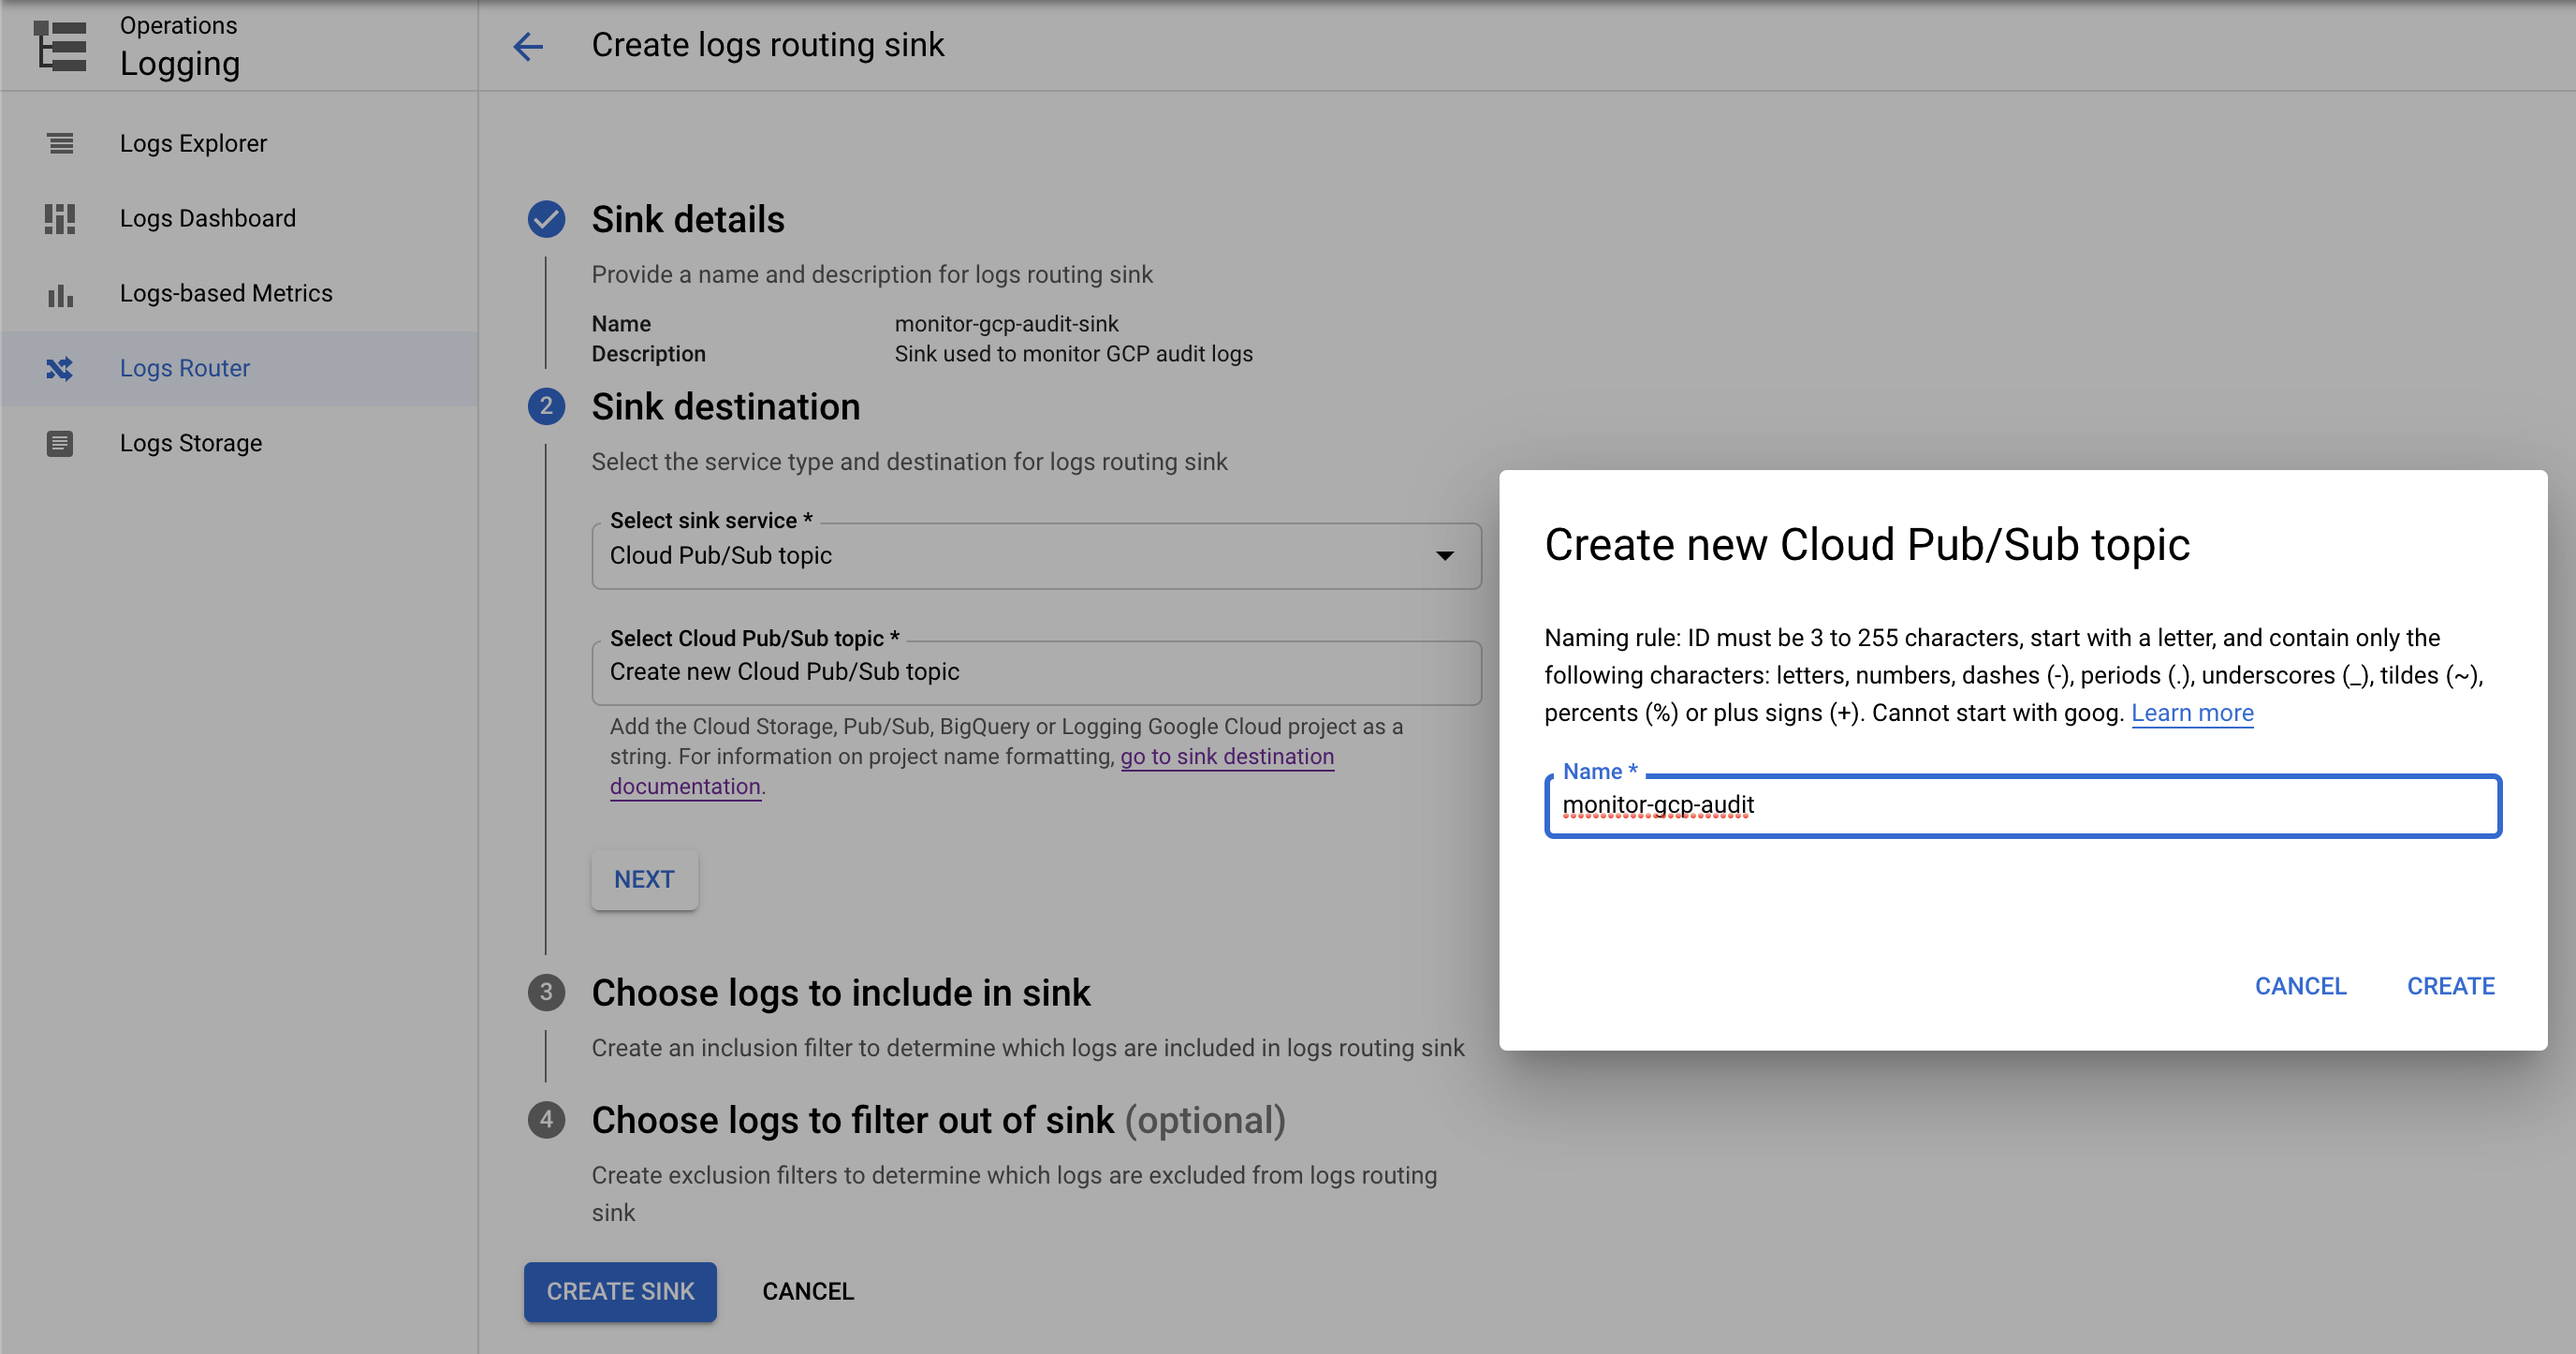
Finally, under Choose logs to include in sink, add
logName:"cloudaudit.googleapis.com"(it includes all audit logs). Click create sink. It will look something like the following: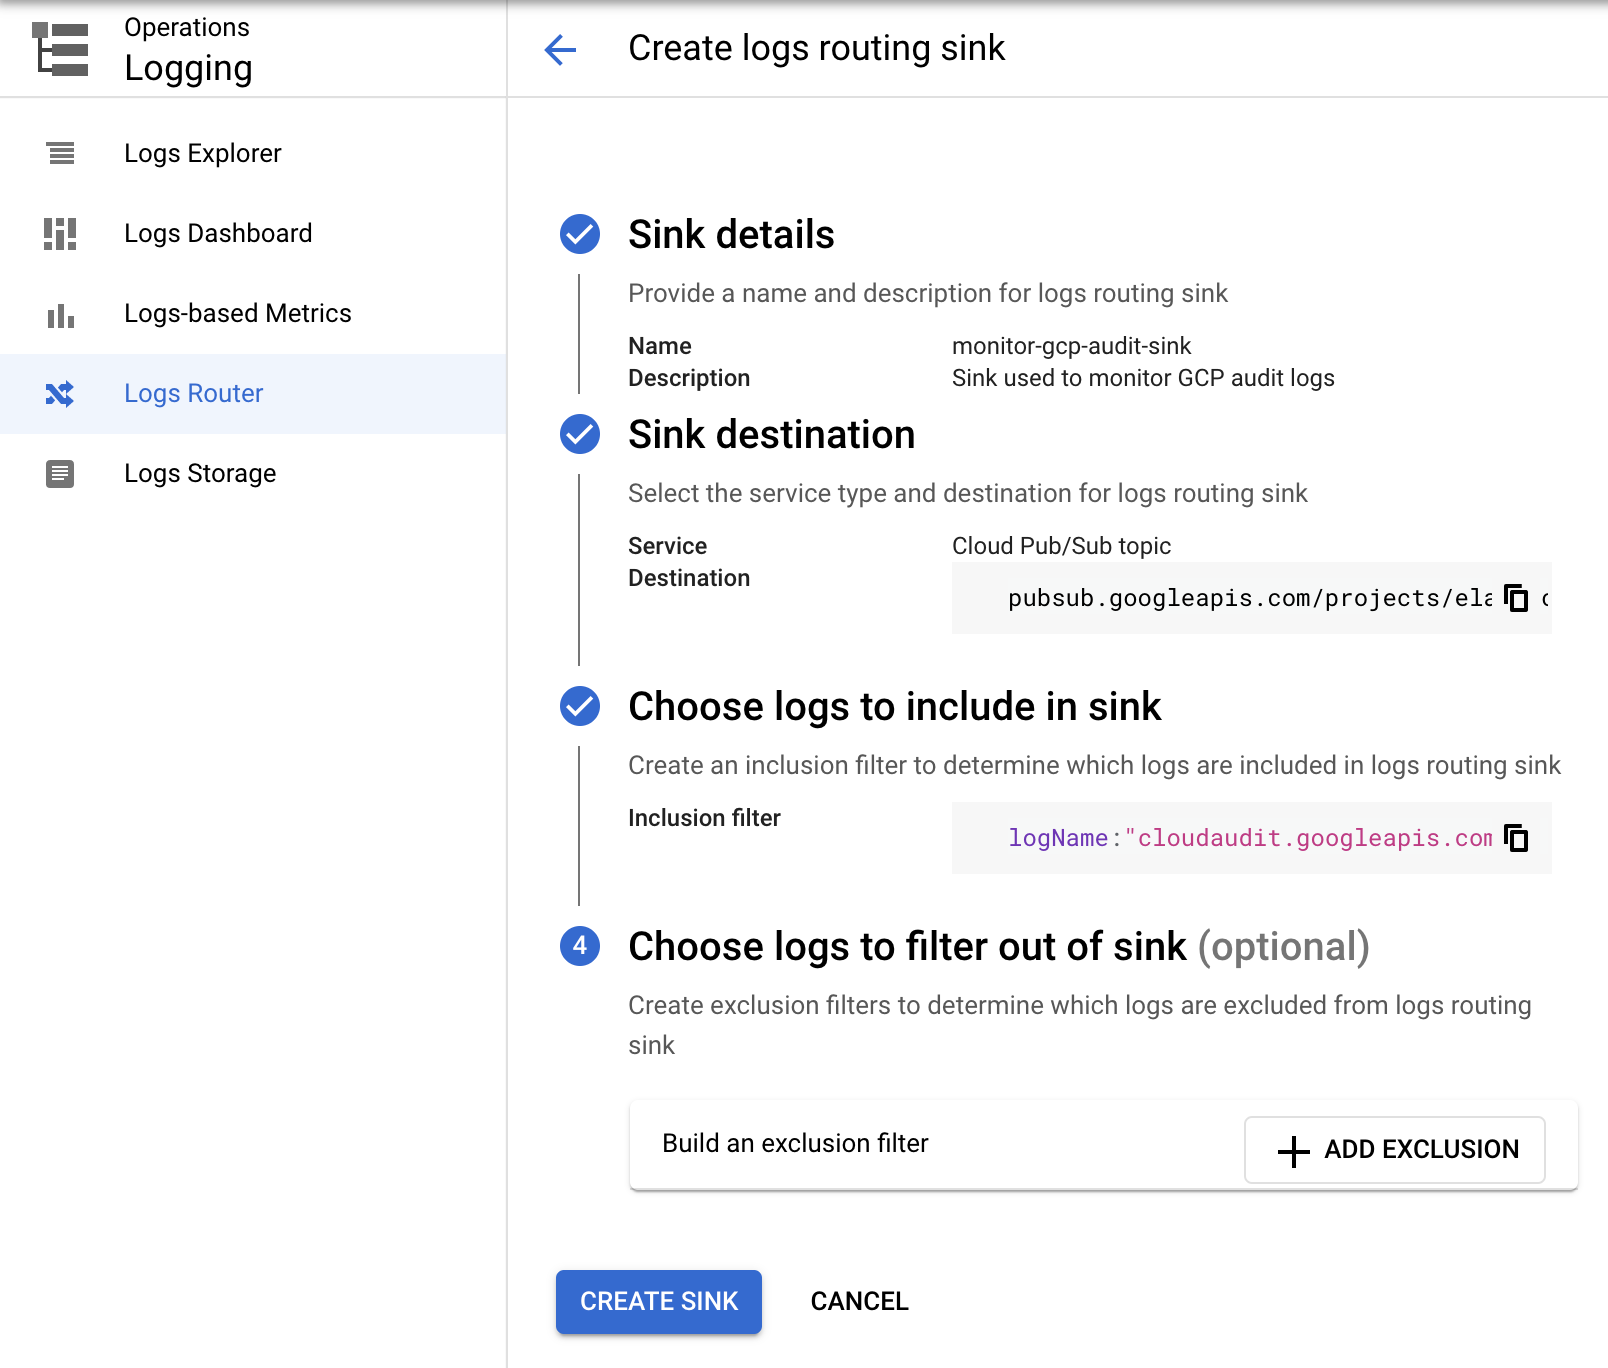
-
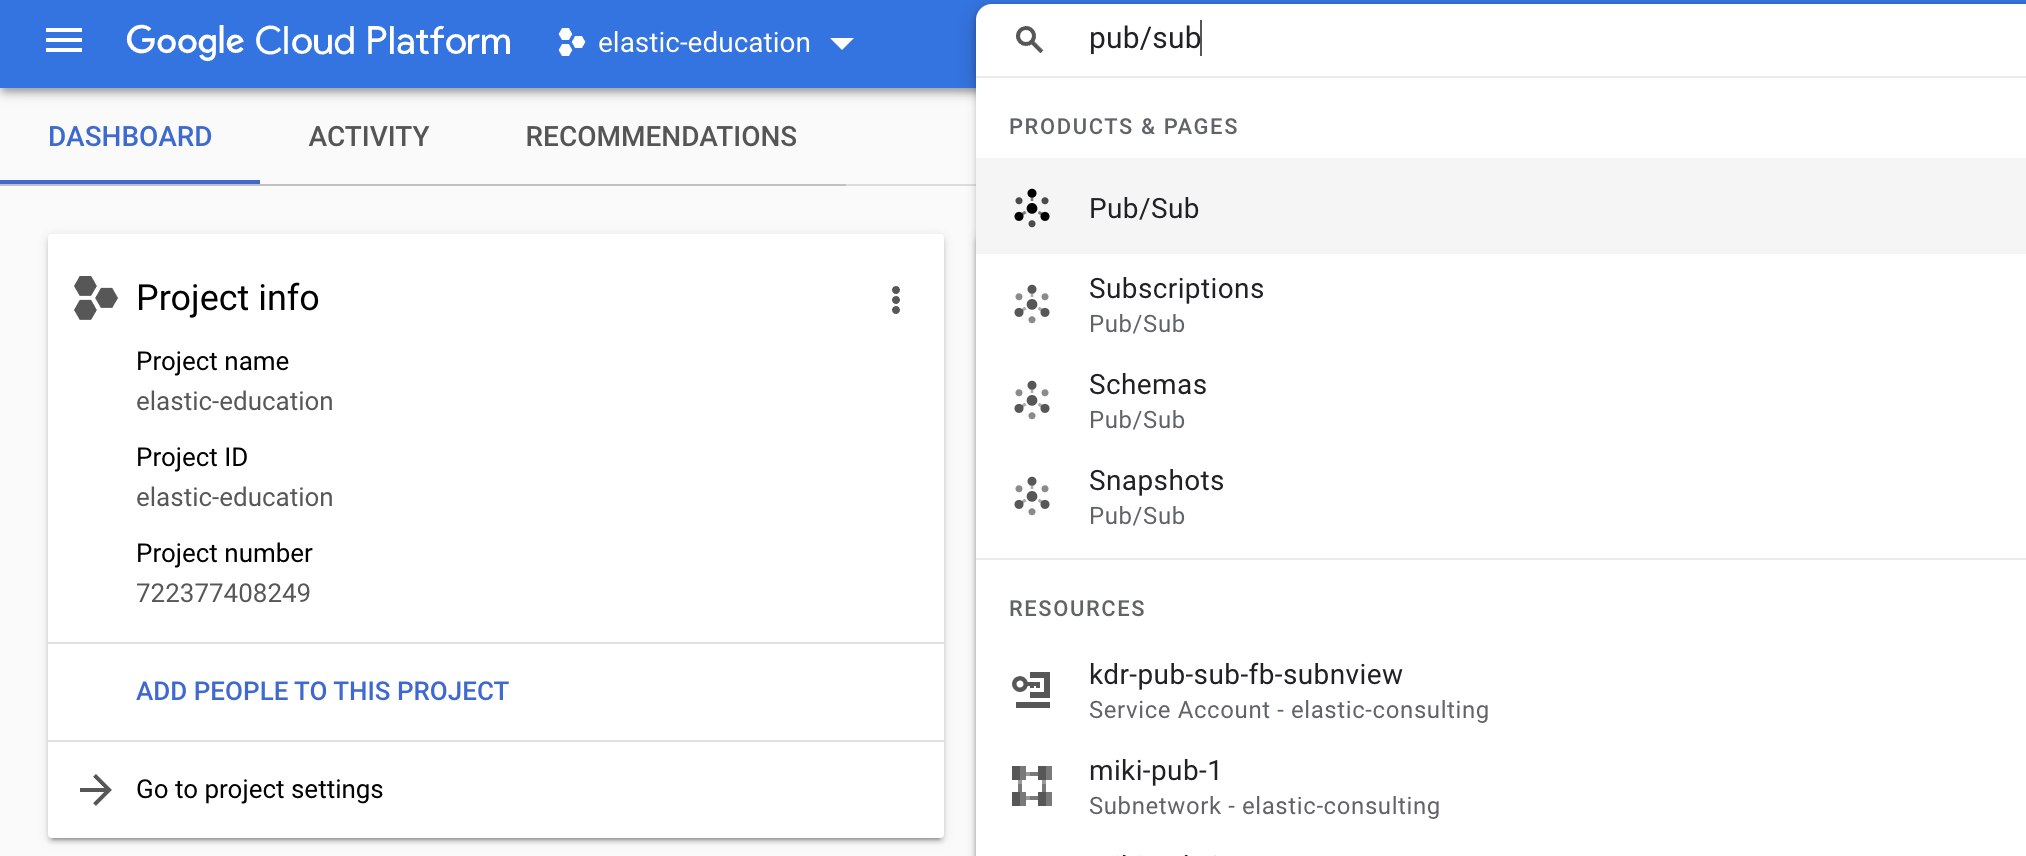
Now go to the Pub/Sub page to add a subscription to the topic you just created. Use the search bar to find the page:
To add a subscription to the
monitor-gcp-audittopic click Create subscription: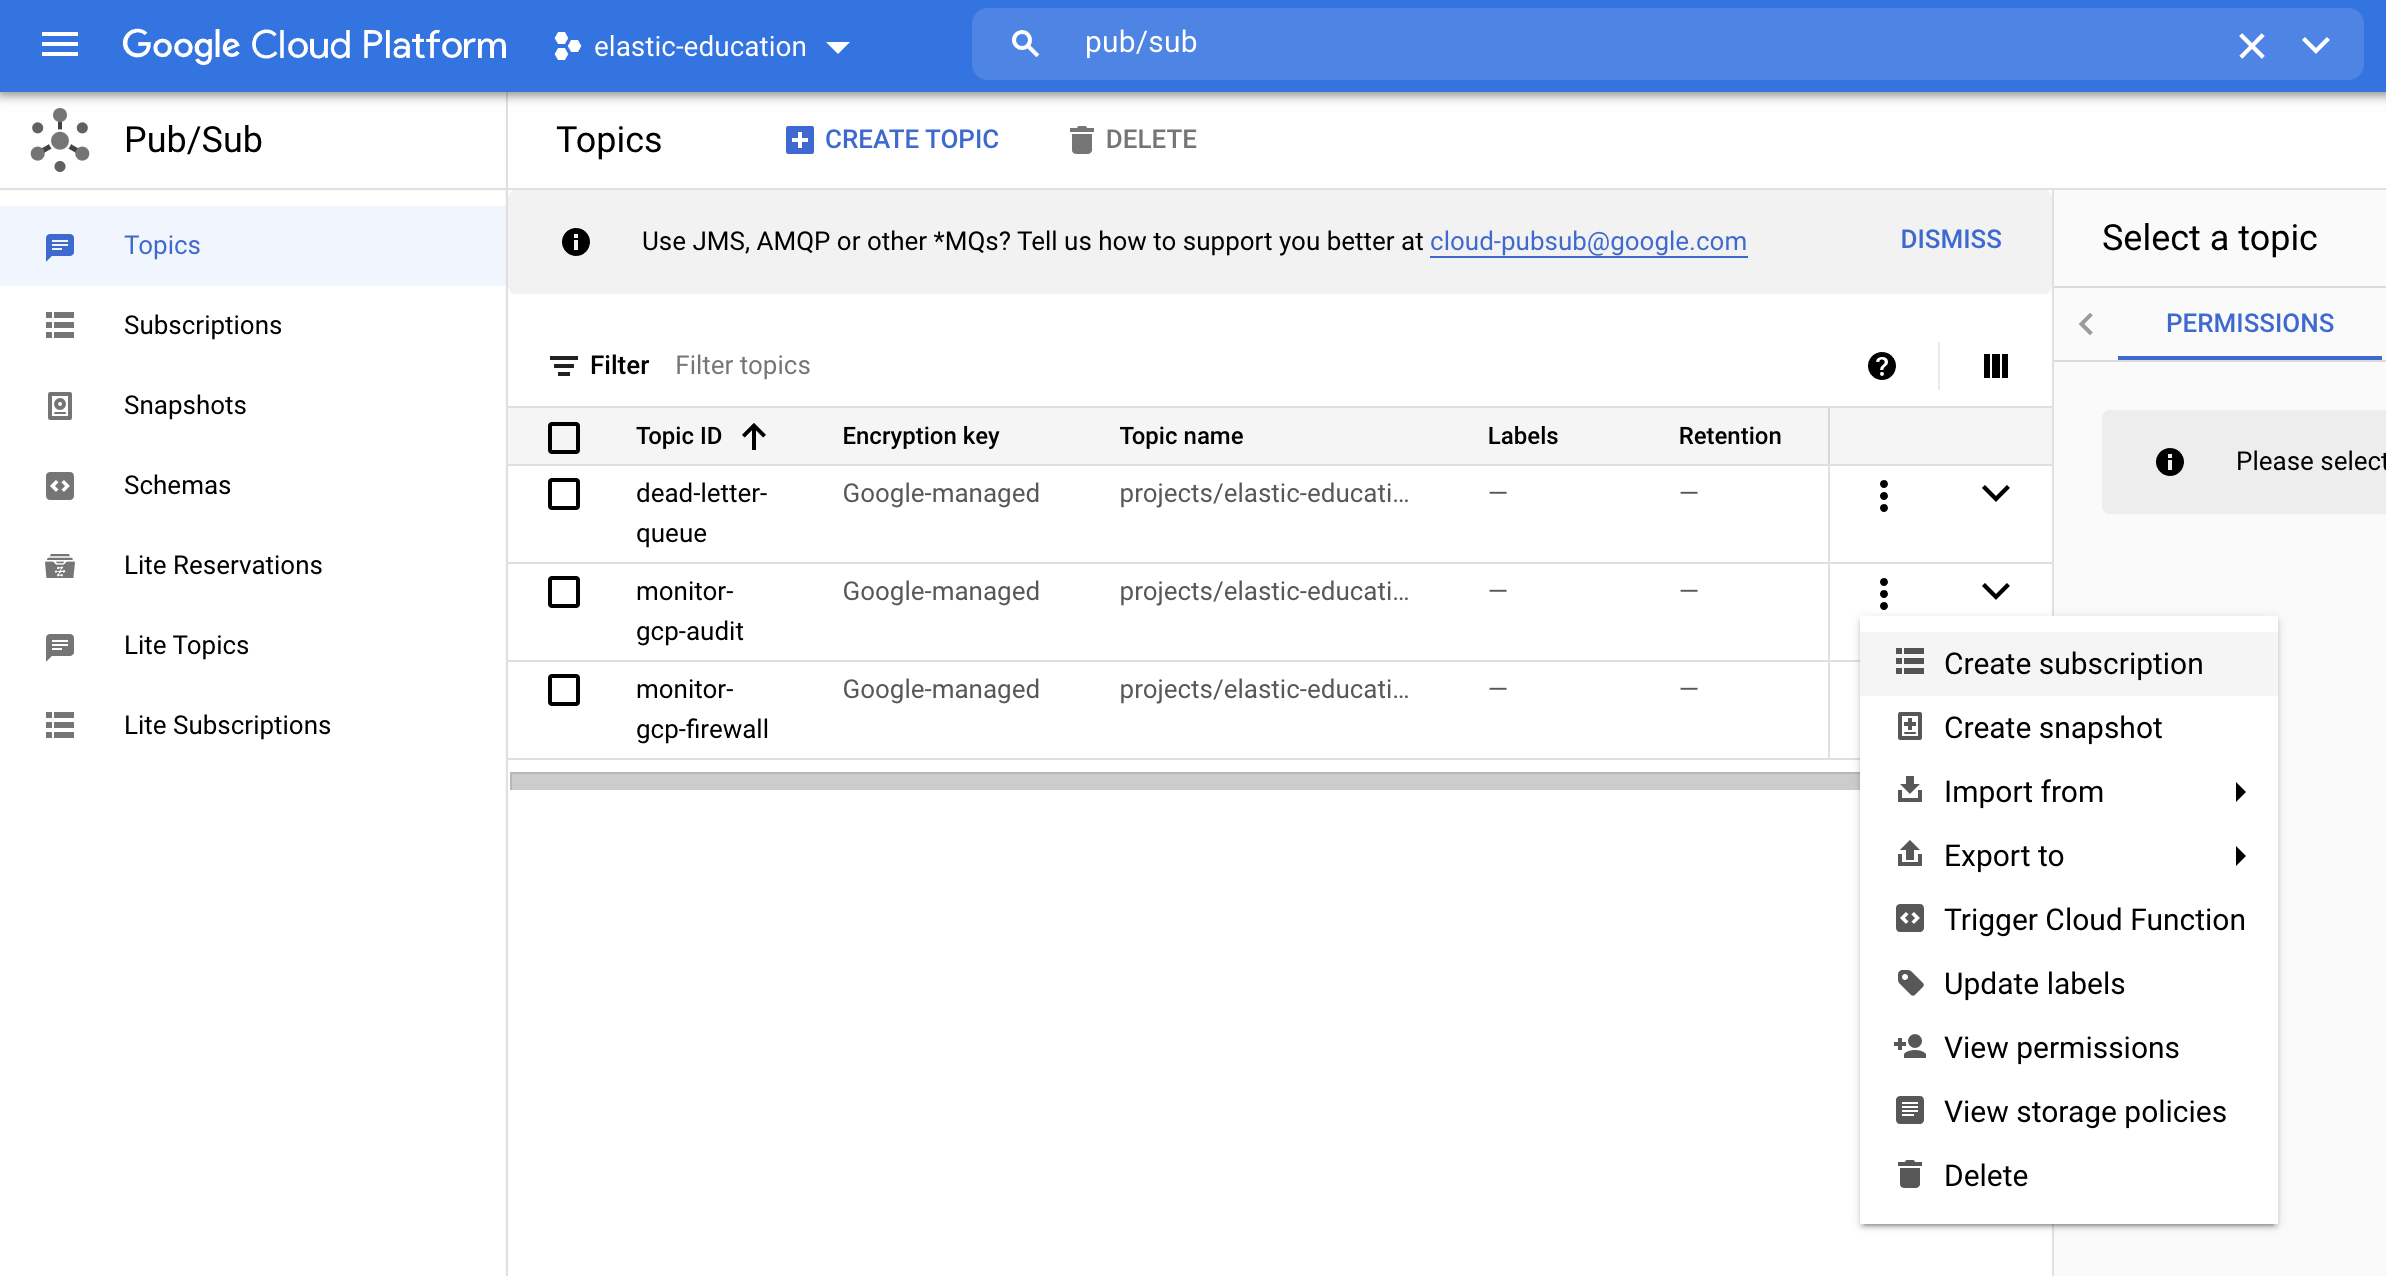
Set
monitor-gcp-audit-subas the Subscription ID and leave the Delivery type as pull: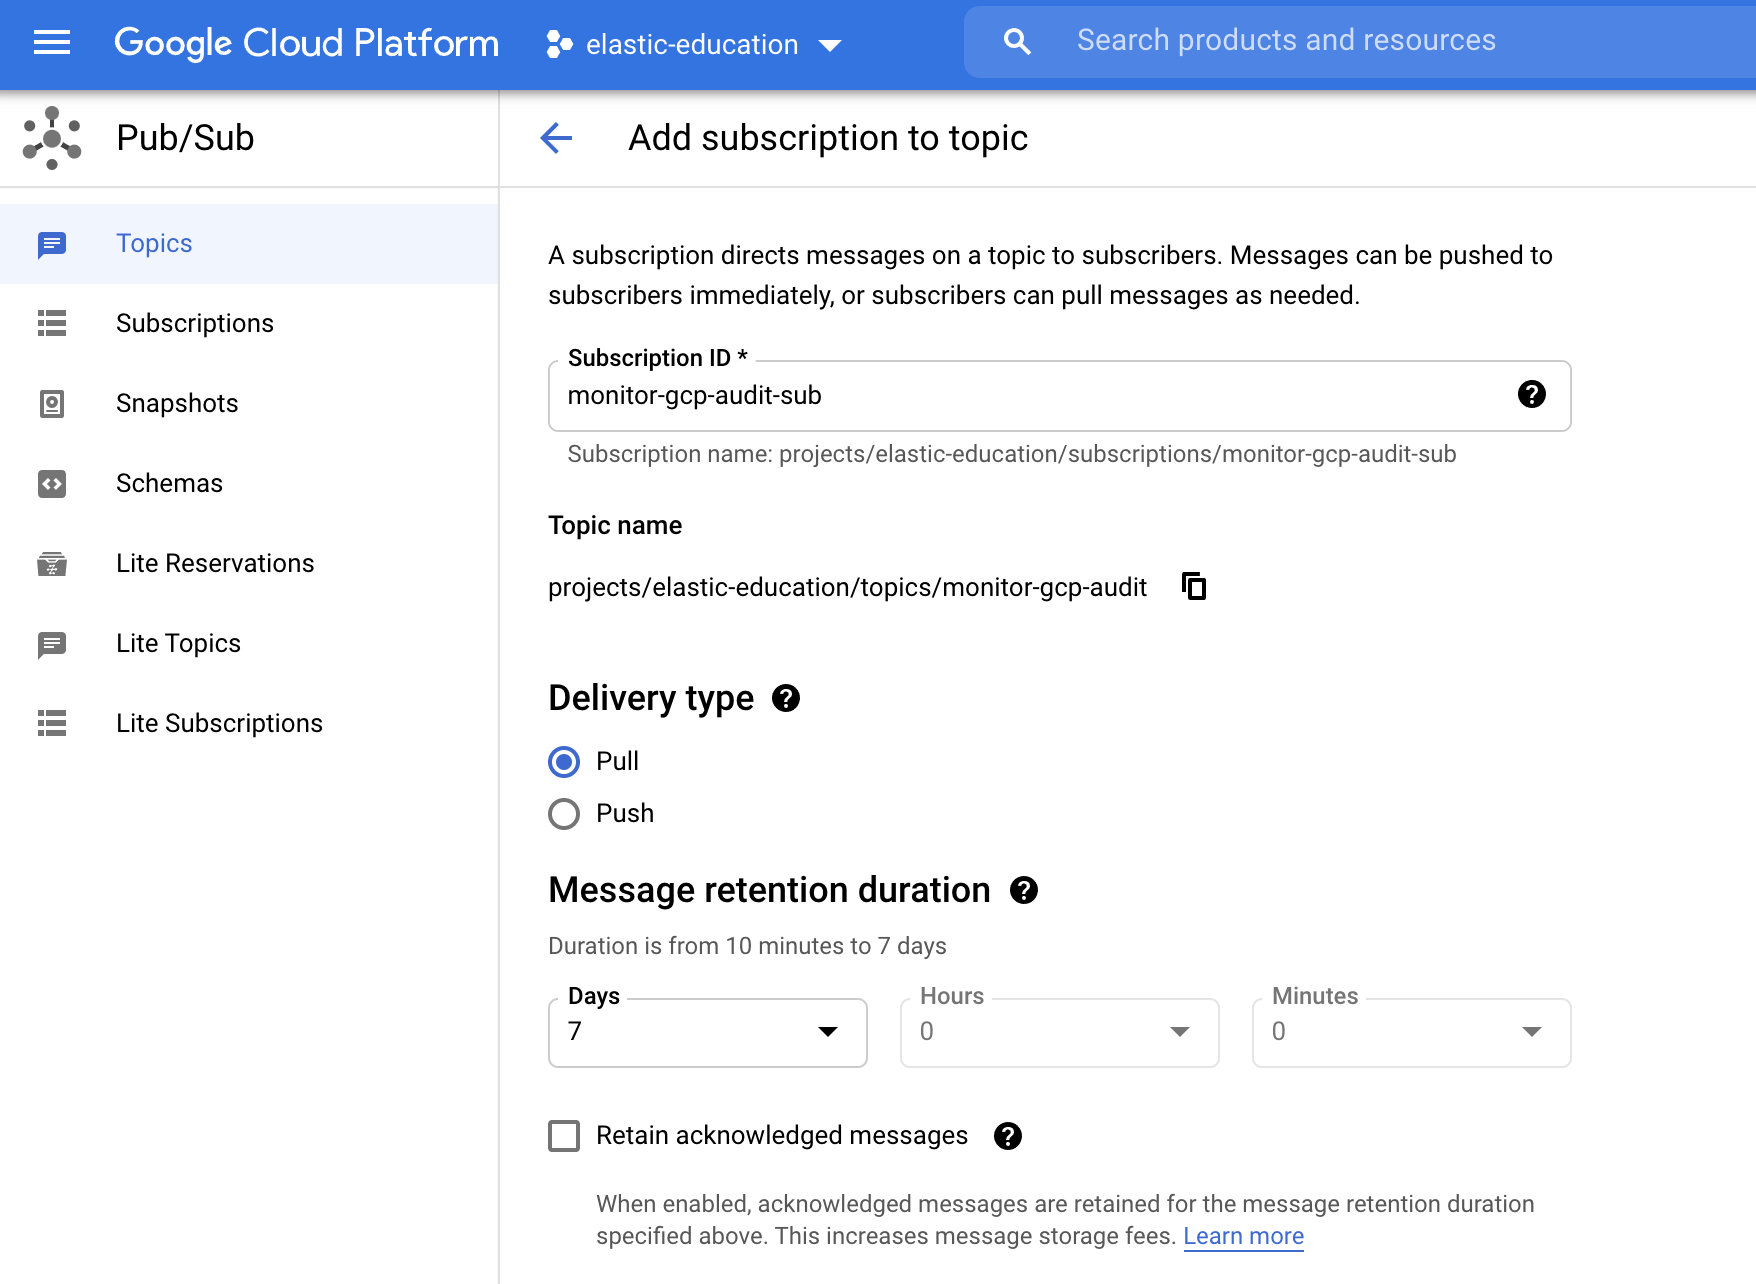
Finally, scroll down and click Create.
Step 3: Configure the Google Dataflow template
editAfter creating a Pub/Sub topic and subscription, go to the Dataflow Jobs page and configure your template to use them. Use the search bar to find the page:
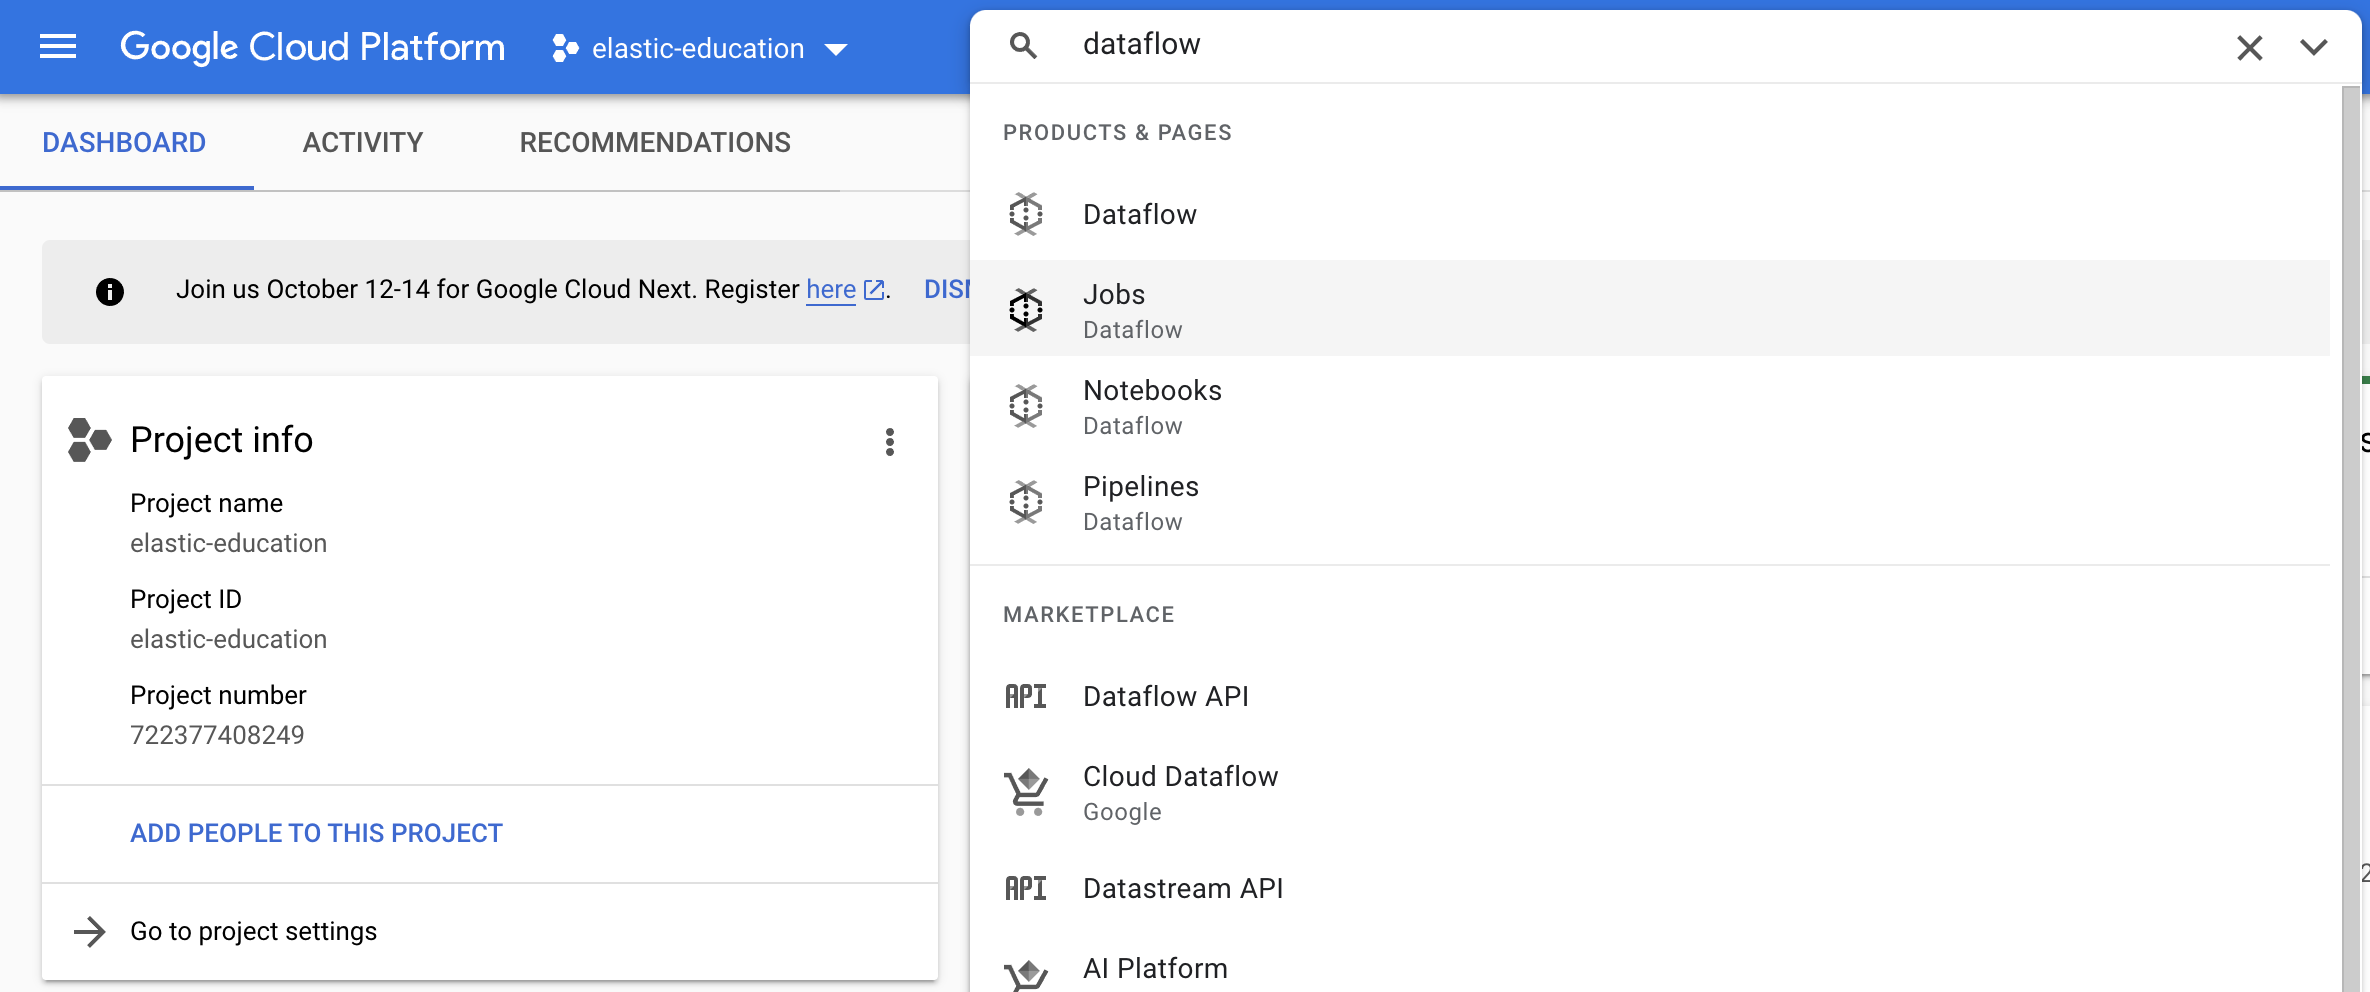
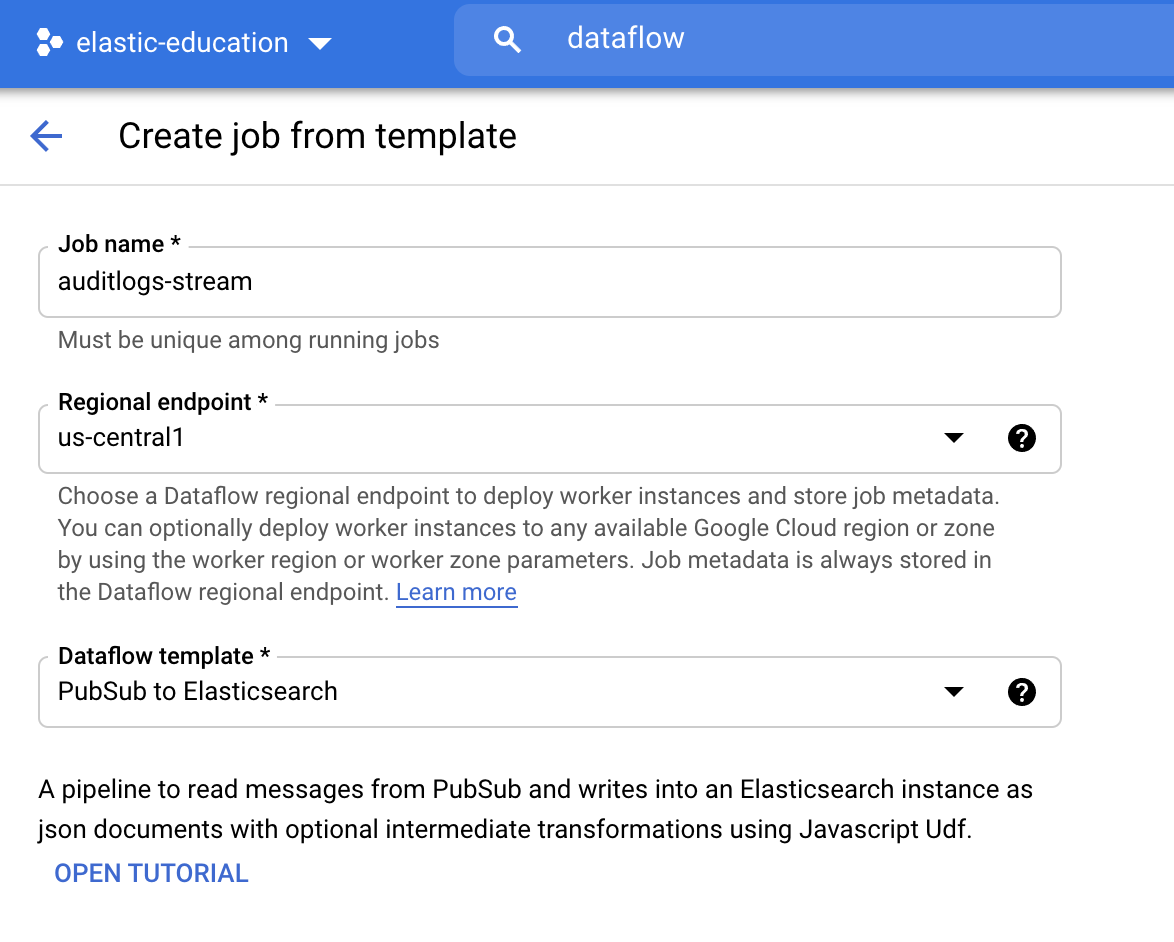
To create a job, click Create Job From Template.
Set Job name as auditlogs-stream and select Pub/Sub to Elasticsearch from
the Dataflow template dropdown menu:
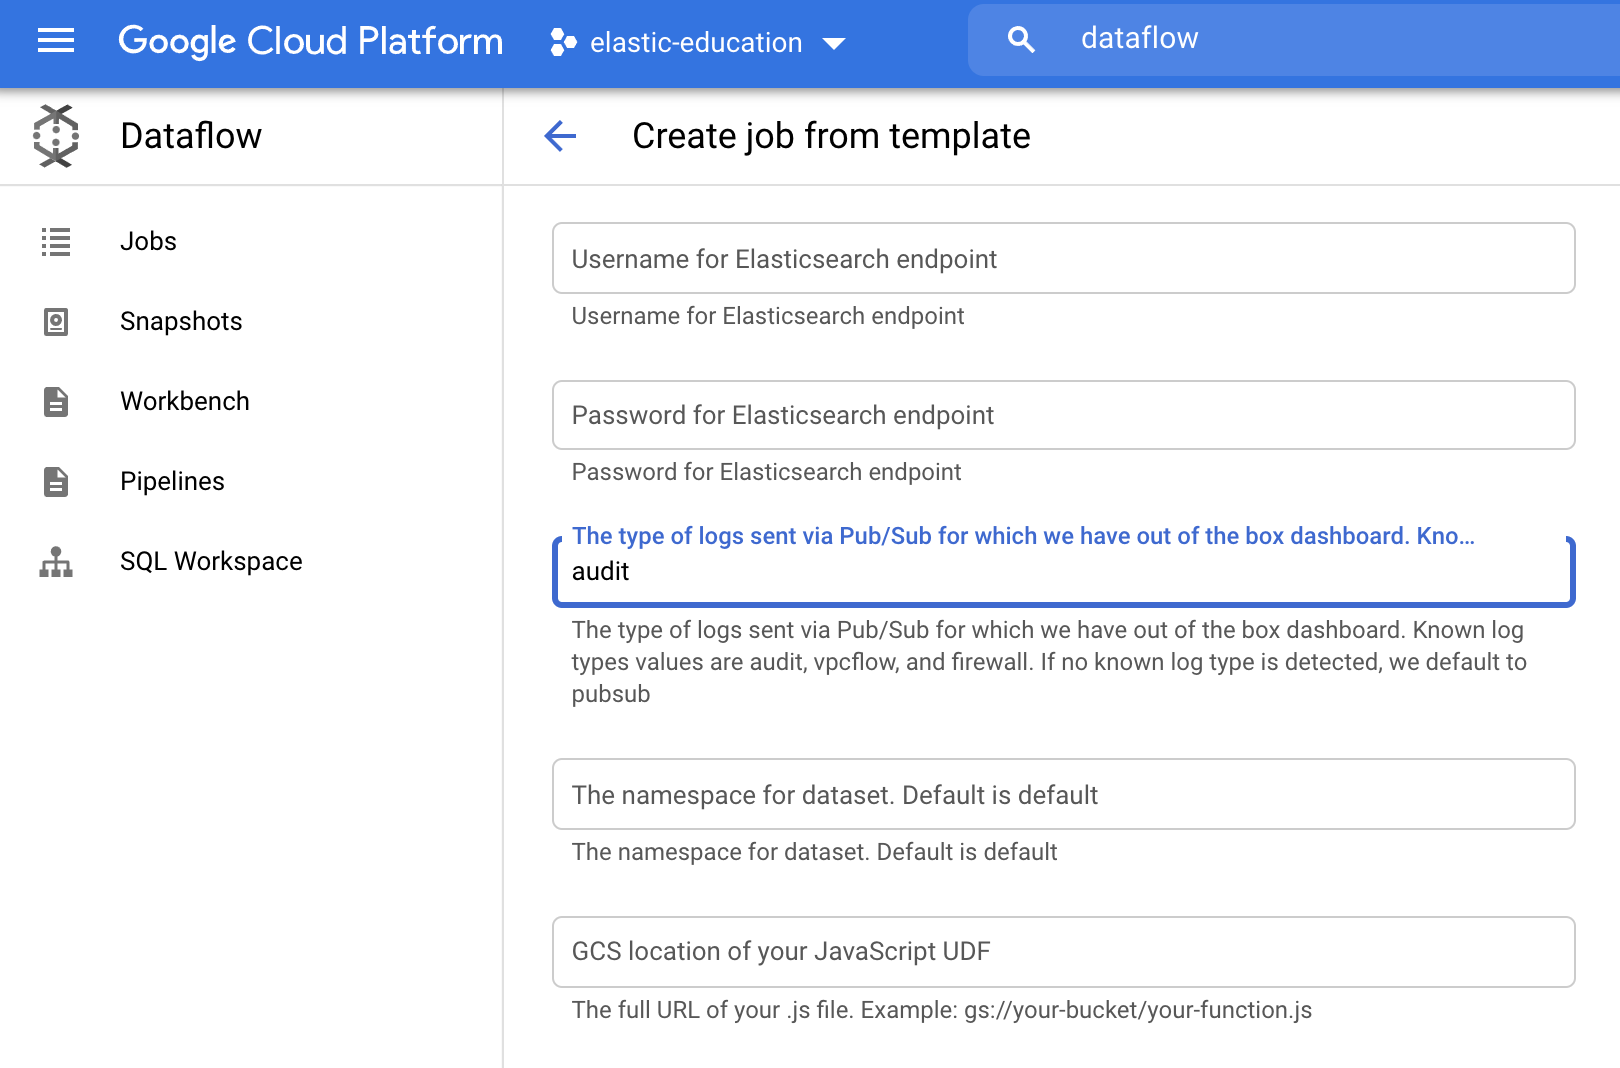
Before running the job, fill in required parameters:
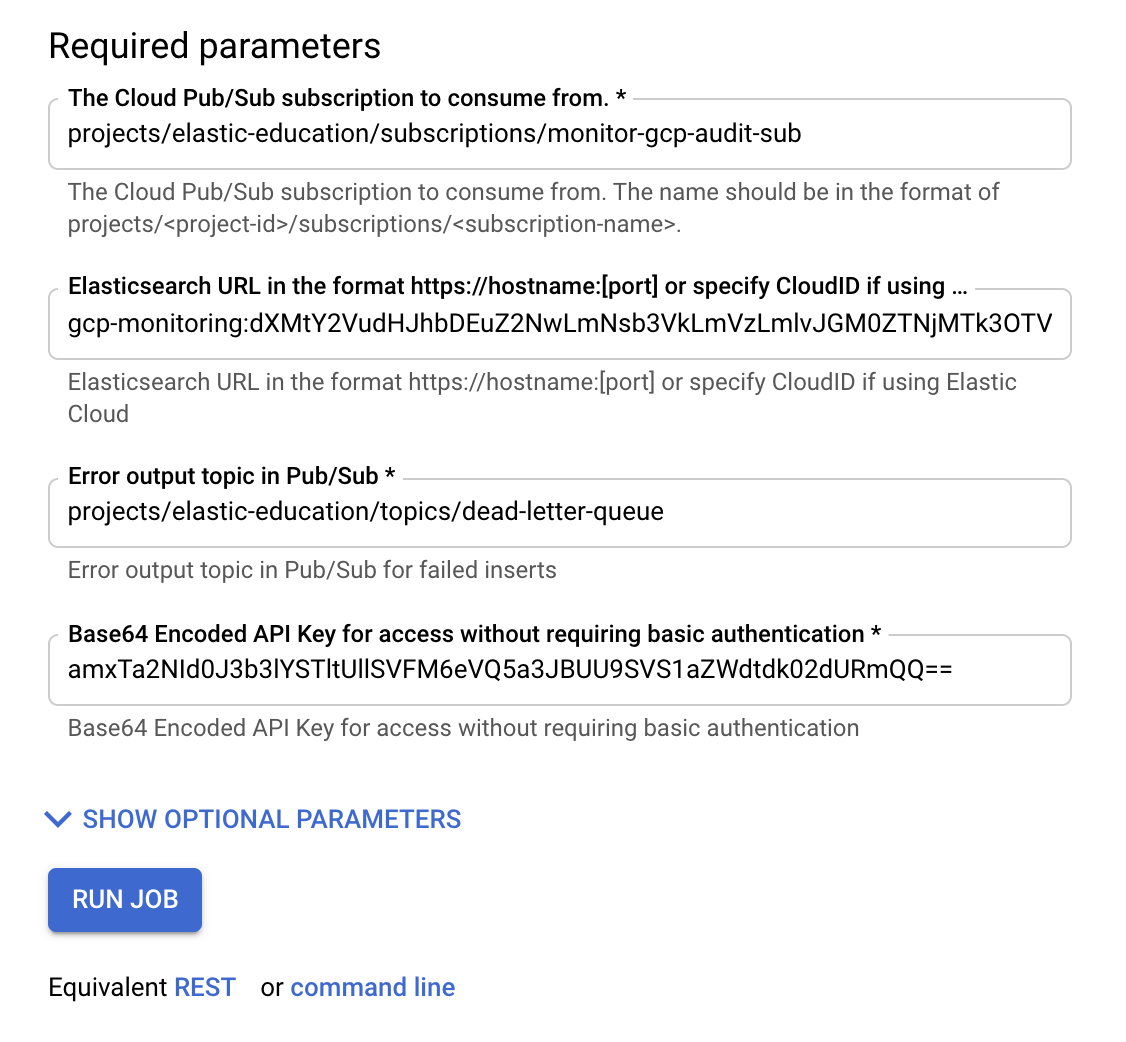
For Cloud Pub/Sub subscription, use the subscription you created in the previous step. For Cloud ID and Base64-encoded API Key, use the values you got earlier. If you don’t have an Error output topic, create one like you did in the previous step.
After filling the required parameters, click Show Optional Parameters and add
audit as the log type parameter.
When you are all set, click Run Job and wait for Dataflow to execute the template, which takes a few minutes.
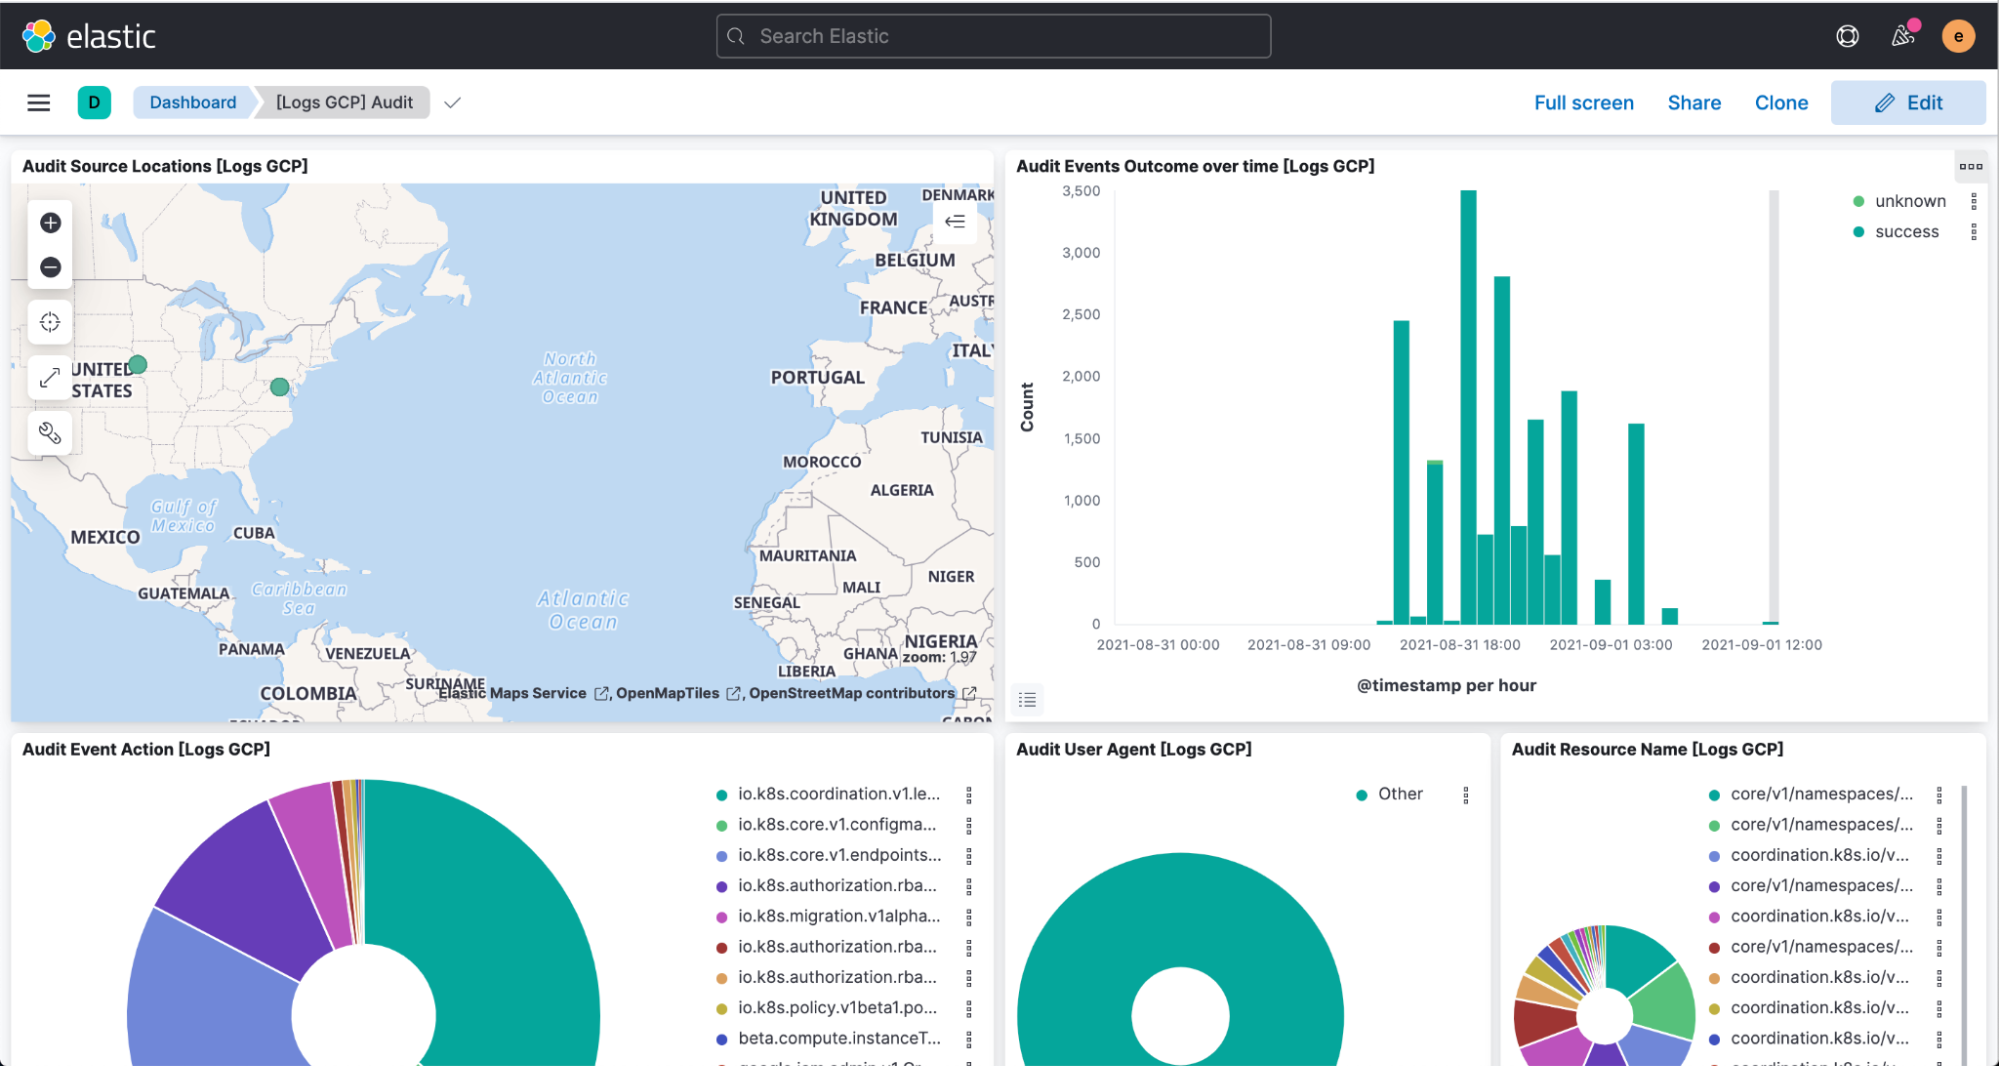
Finally, navigate to Kibana to see your logs parsed and visualized in the [Logs GCP] Audit dashboard.
Besides collecting audit logs from your Google Cloud Platform, you can also use Dataflow integrations to ingest data directly into Elastic from Google BigQuery and Google Cloud Storage.