View anomaly detection job results
editView anomaly detection job results
editAfter the anomaly detection job has processed some data, you can view the results in Kibana.
Depending on the capacity of your machine, you might need to wait a few seconds for the machine learning analysis to generate initial results.
There are two tools for examining the results from anomaly detection jobs in Kibana: the Anomaly Explorer and the Single Metric Viewer.
Bucket results
editWhen you view your machine learning results, each bucket has an anomaly score. This score is a statistically aggregated and normalized view of the combined anomalousness of all the record results in the bucket.
The machine learning analytics enhance the anomaly score for each bucket by considering
contiguous buckets. This extra multi-bucket analysis effectively uses a
sliding window to evaluate the events in each bucket relative to the larger
context of recent events. When you review your machine learning results, there is a
multi_bucket_impact property that indicates how strongly the final anomaly
score is influenced by multi-bucket analysis. In Kibana, anomalies with medium or
high multi-bucket impact are depicted in the Anomaly Explorer and the
Single Metric Viewer with a cross symbol instead of a dot. For example:
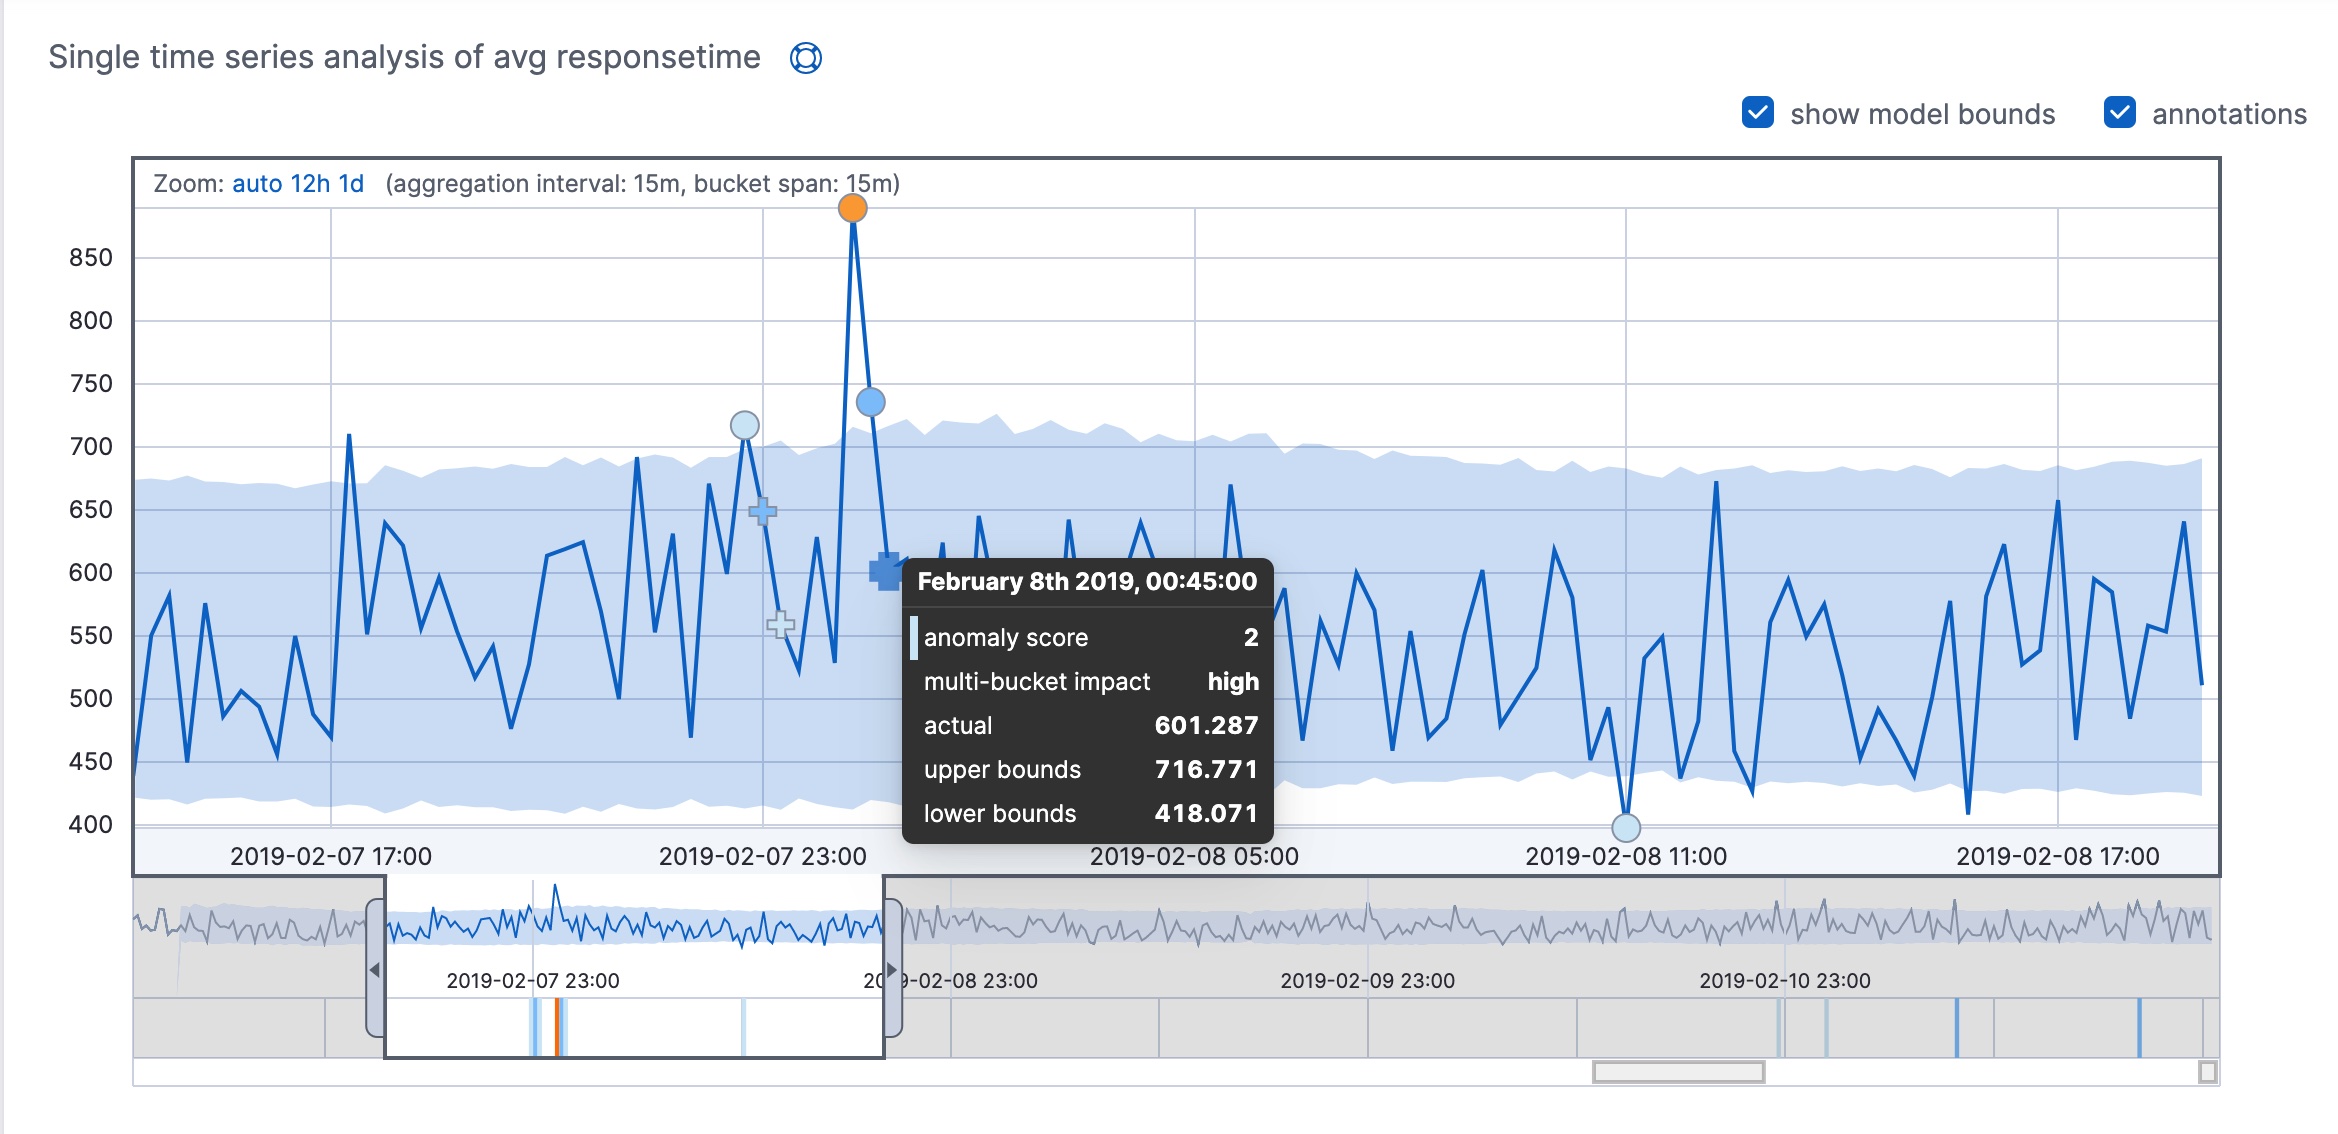
In this example, you can see that some of the anomalies fall within the shaded blue area, which represents the bounds for the expected values. The bounds are calculated per bucket, but multi-bucket analysis is not limited by that scope.
If you have more than one anomaly detection job, you can also obtain overall bucket results, which combine and correlate anomalies from multiple jobs into an overall score. When you view the results for job groups in Kibana, it provides the overall bucket scores. For more information, see Get overall buckets API.
Bucket results provide the top level, overall view of the anomaly detection job and are ideal for alerts. For example, the bucket results might indicate that at 16:05 the system was unusual. This information is a summary of all the anomalies, pinpointing when they occurred. When you identify an anomalous bucket, you can investigate further by examining the pertinent records.
Influencer results
editThe influencer results show which entities were anomalous and when. One influencer result is written per bucket for each influencer that affects the anomalousness of the bucket. The machine learning analytics determine the impact of an influencer by performing a series of experiments that remove all data points with a specific influencer value and check whether the bucket is still anomalous. That means that only influencers with statistically significant impact on the anomaly are reported in the results. For jobs with more than one detector, influencer scores provide a powerful view of the most anomalous entities.
For example, the high_sum_total_sales anomaly detection job for the eCommerce orders
sample data uses customer_full_name.keyword and category.keyword as
influencers. You can examine the influencer results with the
get influencers API. Alternatively, you can use
the Anomaly Explorer in Kibana:
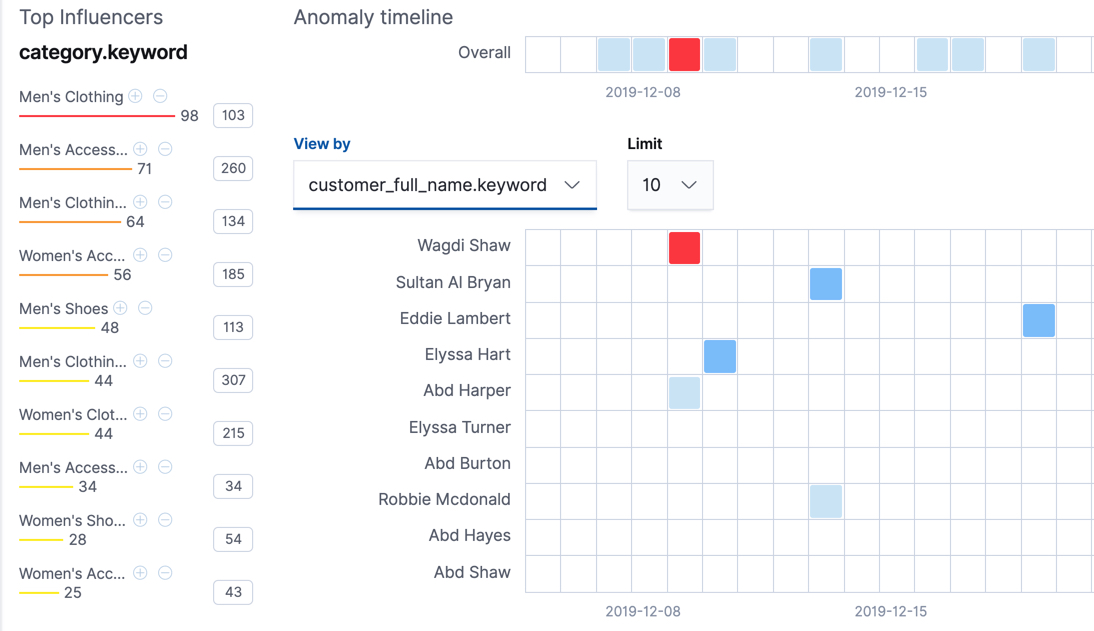
On the left is a list of the top influencers for all of the detected anomalies in that same time period. The list includes maximum anomaly scores, which in this case are aggregated for each influencer, for each bucket, across all detectors. There is also a total sum of the anomaly scores for each influencer. You can use this list to help you narrow down the contributing factors and focus on the most anomalous entities.
You can also explore swim lanes that correspond to the values of an influencer.
In this example, the swim lanes correspond to the values for the
customer_full_name.keyword. By default, the swim lanes are sorted according to
which entity has the maximum anomaly score values. You can click on the sections
in the swim lane to see details about the anomalies that occurred in that time
interval.
The anomaly scores that you see in each section of the Anomaly Explorer might differ slightly. This disparity occurs because for each anomaly detection job, there are bucket results, influencer results, and record results. Anomaly scores are generated for each type of result. The anomaly timeline in Kibana uses the bucket-level anomaly scores. If you view swim lanes by influencer, it uses the influencer-level anomaly scores, as does the list of top influencers. The list of anomalies uses the record-level anomaly scores.