Collect Logstash monitoring data using internal collectors
editCollect Logstash monitoring data using internal collectors
editUsing internal collectors for Logstash X-Pack monitoring these components:
These pieces live outside of the default Logstash pipeline in a dedicated monitoring
pipeline. This configuration ensures that all data and processing has a minimal
impact on ordinary Logstash processing. Existing Logstash features, such as the
elasticsearch output, can be reused to
benefit from its retry policies.
The elasticsearch output that is used by X-Pack monitoring for Logstash is
configured exclusively via settings found in logstash.yml. It is not
configured by using anything from the Logstash configurations that might also be
using their own separate elasticsearch outputs.
The Elasticsearch cluster that is configured for use with X-Pack monitoring for Logstash is expected to be the production cluster. This configuration enables the production Elasticsearch cluster to add metadata (for example, its cluster UUID) to the Logstash monitoring data then route it to the monitoring clusters. For more information about typical monitoring architectures, see How monitoring works in the Elasticsearch Reference.
Collectors
editCollectors, as their name implies, collect things. In X-Pack monitoring for Logstash, collectors are just Inputs in the same way that ordinary Logstash configurations provide inputs.
Like X-Pack monitoring for Elasticsearch, each collector can create zero or more monitoring documents. As it is currently implemented, each Logstash node runs two types of collectors: one for node stats and one for pipeline stats.
| Collector | Data Types | Description |
|---|---|---|
Node Stats |
|
Gathers details about the running node, such as memory utilization and CPU
usage (for example, This runs on every Logstash node with X-Pack monitoring enabled. One common
failure is that Logstash directories are copied with their |
Pipeline Stats |
|
Gathers details about the node’s running pipelines, which powers the Monitoring Pipeline UI. |
Per collection interval, which defaults to 10 seconds (10s), each collector is
run. The failure of an individual collector does not impact any other collector.
Each collector, as an ordinary Logstash input, creates a separate Logstash event
in its isolated monitoring pipeline. The Logstash output then sends the data.
The collection interval can be configured dynamically and you can also disable data collection. For more information about the configuration options for the collectors, see Monitoring Settings.
Unlike X-Pack monitoring for Elasticsearch and Kibana, there is no
xpack.monitoring.collection.enabled setting on Logstash. You must use the
xpack.monitoring.enabled setting to enable and disable data collection.
If gaps exist in the monitoring charts in Kibana, it is typically because either a collector failed or the monitoring cluster did not receive the data (for example, it was being restarted). In the event that a collector fails, a logged error should exist on the node that attempted to perform the collection.
Output
editLike all Logstash pipelines, the purpose of the dedicated monitoring pipeline is
to send events to outputs. In the case of X-Pack monitoring for Logstash, the output
is always an elasticsearch output. However, unlike ordinary Logstash pipelines,
the output is configured within the logstash.yml settings file via the
xpack.monitoring.elasticsearch.* settings.
Other than its unique manner of configuration, this elasticsearch output
behaves like all elasticsearch outputs, including its ability to pause data
collection when issues exist with the output.
It is critical that all Logstash nodes share the same setup. Otherwise, monitoring data might be routed in different ways or to different places.
Default Configuration
editIf a Logstash node does not explicitly define an X-Pack monitoring output setting, the following default configuration is used:
xpack.monitoring.elasticsearch.hosts: [ "http://localhost:9200" ]
All data produced by X-Pack monitoring for Logstash is indexed in the monitoring
cluster by using the .monitoring-logstash template, which is managed by the
exporters within Elasticsearch.
If you are working with a cluster that has X-Pack security enabled, extra steps are necessary to properly configure Logstash. For more information, see Monitoring Logstash with X-Pack.
When discussing security relative to the elasticsearch output, it
is critical to remember that all users are managed on the production cluster,
which is identified in the xpack.monitoring.elasticsearch.hosts setting.
This is particularly important to remember when you move from development
environments to production environments, where you often have dedicated
monitoring clusters.
For more information about the configuration options for the output, see Monitoring Settings.
Configure Logstash monitoring with internal collectors
editTo monitor Logstash nodes:
-
Specify where to send monitoring data. This cluster is often referred to as the production cluster. For examples of typical monitoring architectures, see How monitoring works.
To visualize Logstash as part of the Elastic Stack (as shown in Step 6), send metrics to your production cluster. Sending metrics to a dedicated monitoring cluster will show the Logstash metrics under the monitoring cluster.
-
Verify that the
xpack.monitoring.collection.enabledsetting istrueon the production cluster. If that setting isfalse, the collection of monitoring data is disabled in Elasticsearch and data is ignored from all other sources. -
Configure your Logstash nodes to send metrics by setting the
xpack.monitoring.elasticsearch.hostsinlogstash.yml. If X-Pack security is enabled, you also need to specify the credentials for the built-inlogstash_systemuser. For more information about these settings, see Monitoring Settings.xpack.monitoring.elasticsearch.hosts: ["http://es-prod-node-1:9200", "http://es-prod-node-2:9200"] xpack.monitoring.elasticsearch.username: "logstash_system" xpack.monitoring.elasticsearch.password: "changeme"
If SSL/TLS is enabled on the production cluster, you must connect through HTTPS. As of v5.2.1, you can specify multiple Elasticsearch hosts as an array as well as specifying a single host as a string. If multiple URLs are specified, Logstash can round-robin requests to these production nodes.
If X-Pack security is disabled on the production cluster, you can omit these
usernameandpasswordsettings. -
If SSL/TLS is enabled on the production Elasticsearch cluster, specify the trusted CA certificates that will be used to verify the identity of the nodes in the cluster.
To add a CA certificate to a Logstash node’s trusted certificates, you can specify the location of the PEM encoded certificate with the
certificate_authoritysetting:xpack.monitoring.elasticsearch.ssl.certificate_authority: /path/to/ca.crt
Alternatively, you can configure trusted certificates using a truststore (a Java Keystore file that contains the certificates):
xpack.monitoring.elasticsearch.ssl.truststore.path: /path/to/file
xpack.monitoring.elasticsearch.ssl.truststore.password: password
Also, optionally, you can set up client certificate using a keystore (a Java Keystore file that contains the certificate):
xpack.monitoring.elasticsearch.ssl.keystore.path: /path/to/file
xpack.monitoring.elasticsearch.ssl.keystore.password: password
Set sniffing to
trueto enable discovery of other nodes of the Elasticsearch cluster. It defaults tofalse.xpack.monitoring.elasticsearch.sniffing: false
- Restart your Logstash nodes.
-
To verify your X-Pack monitoring configuration, point your web browser at your Kibana host, and select Monitoring from the side navigation. Metrics reported from your Logstash nodes should be visible in the Logstash section. When security is enabled, to view the monitoring dashboards you must log in to Kibana as a user who has the
kibana_userandmonitoring_userroles.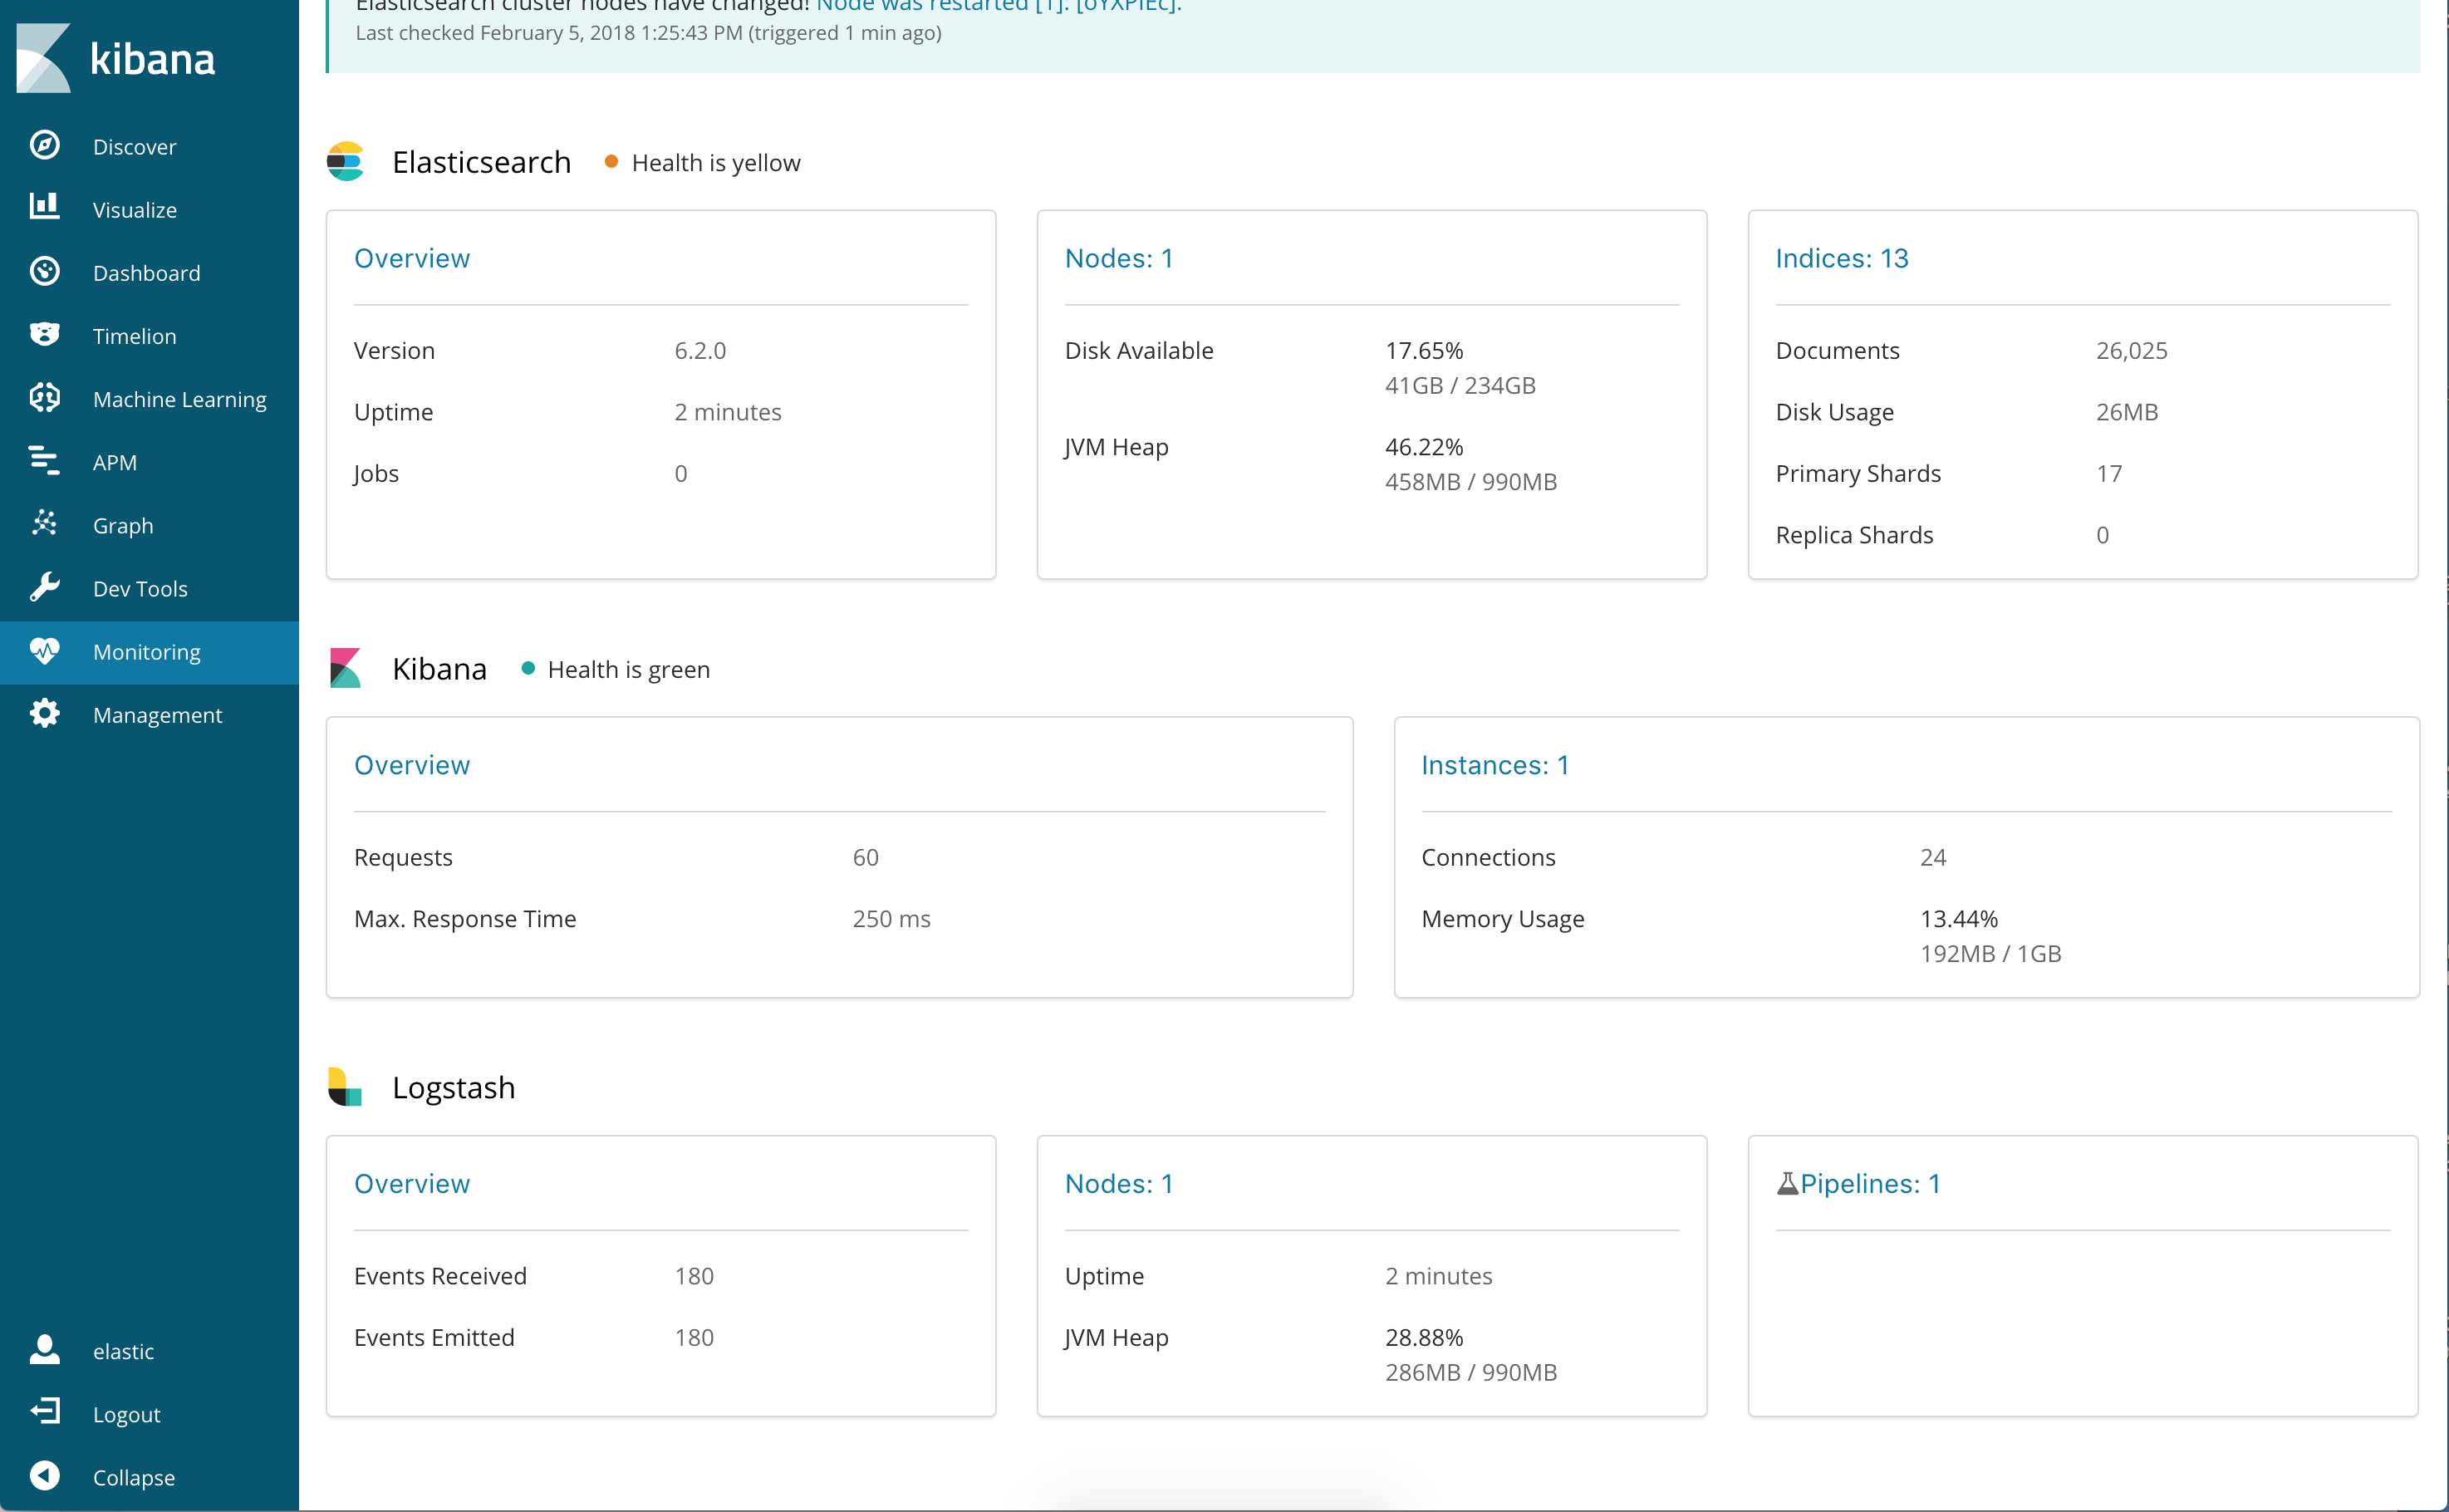

Re-enabling Logstash Monitoring After Upgrading
editWhen upgrading from older versions of X-Pack, the built-in logstash_system
user is disabled for security reasons. To resume monitoring,
change the password and re-enable the logstash_system user.
Monitoring settings for internal collection
editYou can set the following xpack.monitoring settings in logstash.yml to
control how monitoring data is collected from your Logstash nodes. However, the
defaults work best in most circumstances. For more information about configuring
Logstash, see logstash.yml.
General monitoring settings
edit-
xpack.monitoring.enabled -
Monitoring is disabled by default. Set to
trueto enable X-Pack monitoring. -
xpack.monitoring.elasticsearch.hosts -
The Elasticsearch instances that you want to ship your Logstash metrics to. This might be
the same Elasticsearch instance specified in the
outputssection in your Logstash configuration, or a different one. This is not the URL of your dedicated monitoring cluster. Even if you are using a dedicated monitoring cluster, the Logstash metrics must be routed through your production cluster. You can specify a single host as a string, or specify multiple hosts as an array. Defaults tohttp://localhost:9200. -
xpack.monitoring.elasticsearch.usernameandxpack.monitoring.elasticsearch.password - If your Elasticsearch is protected with basic authentication, these settings provide the username and password that the Logstash instance uses to authenticate for shipping monitoring data.
Monitoring collection settings
edit-
xpack.monitoring.collection.interval -
Controls how often data samples are collected and shipped on the Logstash side.
Defaults to
10s. If you modify the collection interval, set thexpack.monitoring.min_interval_secondsoption inkibana.ymlto the same value.
X-Pack monitoring TLS/SSL settings
editYou can configure the following Transport Layer Security (TLS) or Secure Sockets Layer (SSL) settings. For more information, see Configuring Credentials for Logstash Monitoring.
-
xpack.monitoring.elasticsearch.ssl.certificate_authority -
Optional setting that enables you to specify a path to the
.pemfile for the certificate authority for your Elasticsearch instance. -
xpack.monitoring.elasticsearch.ssl.truststore.path - Optional settings that provide the paths to the Java keystore (JKS) to validate the server’s certificate.
-
xpack.monitoring.elasticsearch.ssl.truststore.password - Optional settings that provide the password to the truststore.
-
xpack.monitoring.elasticsearch.ssl.keystore.path - Optional settings that provide the paths to the Java keystore (JKS) to validate the client’s certificate.
-
xpack.monitoring.elasticsearch.ssl.keystore.password - Optional settings that provide the password to the keystore.